Summary:
- Nvidia Corporation thrives on cyclical growth from AI-driven infrastructure, but its reliance on short-term model training and medium-term inference exposes the business to sharp valuation fluctuations.
- Despite a forecasted $6 trillion 2028 enterprise value, risks of overvaluation, sentiment detachment, and revenue decline suggest a potential medium-term downside for NVDA investors.
- Nvidia’s engineering focus and robust financials position it for growth in AI factories, robotics, and edge AI, but M&A-driven strategies may be needed to ensure long-term Big Tech stability.
bernie_photo/iStock via Getty Images
Nvidia Corporation (NASDAQ:NVDA) recently posted its Q3 results, and readers who have read my last thesis and my first major analysis focusing on the company’s impending valuation decline related to Cisco (CSCO)—inspired by David Friedberg’s initial observation and comparison—will know the line of thought already. Nvidia is facing a highly probable valuation collapse due to the culmination of data center expansion related to AI model training.
Therefore, in this analysis, while I do focus on the Q3 earnings review, I also delve more deeply into Nvidia’s possible future upcycles following the downcycle of its tsunami AI opportunity. Jensen Huang is one of my favorite CEOs of all time, and I do not doubt that Nvidia will be a company that endures as a world-leading tech company in the coming decades.
Q3 Earnings
The company achieved record revenue for the quarter of $35.1 billion, which is a 94% year-over-year growth. Moreover, its Data Center revenue was $30.8 billion, which was up 122% year-over-year, driven by Nvidia Hopper and H200 demand. Gaming revenue was up 15% year-over-year, and automotive revenue was up 72% year-over-year, driven by the Nvidia Orin self-driving platform. Management provided a Q4 revenue guidance of $37.5 billion, driven by Hopper demand and the Blackwell ramp.
The market reacted how one would expect, given that Nvidia has an attitude of under-promising and overdelivering, a quality I believe is instilled in the company by Jensen Huang.
Huang once told a story of a gardener in Kyoto who was patiently weeding the vast moss landscape, and when Huang asked him how he managed to tend to a garden so big, he said, “I have plenty of time.” Nvidia’s management seems to take the same approach, and this philosophy will be particularly crucial in understanding the long-term cyclical potential for the company’s future.
More tangibly, the company acknowledged supply limitations for its AI chips, particularly for the new Blackwell series, indicating that demand is expected to exceed supply for several quarters into Fiscal 2026. In addition, its non-GAAP gross margin of 75% was down slightly due to higher costs for new Blackwell products.
AI Cycles
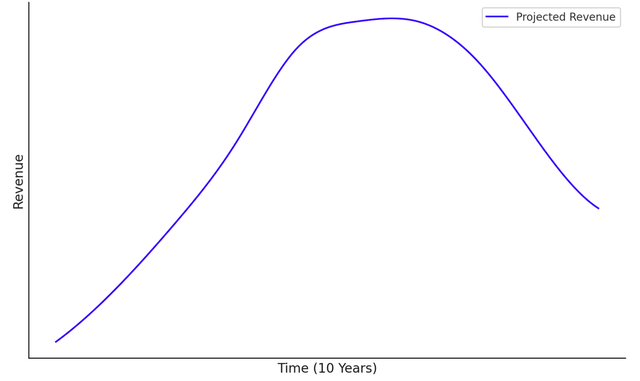
In my previous writing on Nvidia, I mentioned that its current AI infrastructure opportunity is a “one-time event”; in retrospect, this statement was regrettably wrong. However, I was onto something, and I believe the statement can be better rephrased to state that Nvidia’s capitalization on AI infrastructure building at this scale will be cyclical. However, for the next 10 years, this is what we are dealing with:
| Phase | Focus | GPU Demand Characteristics |
|---|---|---|
| Short-Term (1–3 Years) | Foundation Model Training |
– Highest GPU Usage for training massive models. – Requires large-scale clusters (e.g., H100, Blackwell). |
| Medium-Term (3–5 Years) | Widespread AI Inference |
– Moderate GPU Demand but scaling with adoption. – Can use the same GPUs as training, but need more efficient GPUs for cost and latency. |
| Long-Term (5–10 Years) | AI Factories and Industry-Specific Deployments |
– Focus on fine-tuning foundation models and industry-specific training. – Inference workloads surpass training in aggregate demand. – Growth in edge computing using smaller, efficient GPUs (e.g., Orin). |
The question then becomes, “What’s the next big cycle going to be?” This is a question I am quite certain even Huang and his executive management team don’t quite know the answer to. Indeed, this is the mystique of Nvidia’s semiconductor business. It builds the infrastructure and then capitalizes on the opportunities when it finds them. It is both ingenious and volatile but also highly profitable. It is also a business that thrives on engineering and technical science rather than the pursuit of stable value accumulation. This is why Nvidia is such a profoundly impactful company because its focus is heavily on the products it produces rather than aggressive value-driven M&A like Microsoft (MSFT).
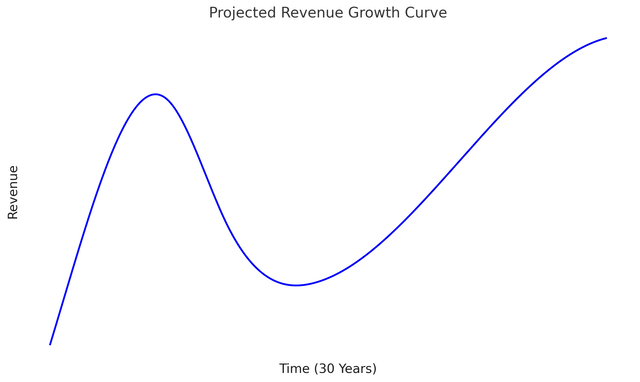
Is it possible that with a major revenue decline on the horizon, we’ll get an initial glimpse of Nvidia’s meteoric valuation, but this will collapse and then climb back to previous levels over decades? This could be supported by AI factories, edge AI, distributed computing, autonomous systems and robotics, and other advanced AI-driven technologies dominating the company’s long-term focus. Nvidia certainly has a robust financial position coming out of this mega AI infrastructure cycle to aid it in achieving this. If so, the future could look like this:
Valuation
| Valuation Period | Now until January 2028 (Fiscal Year 2028) |
| Revenue Growth Assumption | Revenue growth from the Data Center segment will continue until January 2028 |
| Fiscal 2028 Revenue Estimate | $235 billion |
| EBITDA Margin Assumption | 65% |
| Fiscal 2028 EBITDA Estimate | $152.75 billion |
| Terminal EV-to-EBITDA Multiple | 40 (lower than the five-year forward average of 49) |
| Fiscal 2028 Enterprise Value Estimate | $6.11 trillion |
| Current Valuation Status | Indicates a “Buy” but with caution (Hold rating due to expected future decline) |
| Weighted Average Cost of Capital (Discount Rate) | 18.89% |
| Equity Weight | 99.7% |
| Debt Weight | 0.3% |
| Cost of Equity | 18.94% |
| Cost of Debt (After Tax) | 2.01% |
| Discounted Enterprise Value | $3.53 trillion |
| Current Enterprise Value | $3.45 trillion |
| Margin of Safety | 2.27% (approximately fairly valued) |
Long-Term Risks
If the company fails to position itself effectively to capitalize on the next big opportunity—be it in robotics or advanced long-term inference—it may find that novel semiconductor companies focusing on use-case-specific fields fracture Nvidia’s dominant position.
Nvidia may find it useful to focus on an M&A-driven value-accretive model for its next long-term upcycle. Relying too heavily on typical semiconductor cycles could cause too much volatility for management and shareholders to engender a sustainable and stable Big Tech company.
I’m personally not buying Nvidia right now; although my model shows a potential 2028 enterprise value of over $6 trillion, it’s not clear that the company will reach this valuation. Considering that sentiment factors are often detached from fundamentals, the company’s valuation could peak at $4.5 trillion or lower. I would rather not expose myself to the potentially heavy downside that I see as probable in the medium term.
Conclusion: Hold
Nvidia is a fantastic company that is well-managed, authentic, and extremely well-positioned at the moment. Even with a likely impending decline in revenues, management can likely position the company shrewdly for long-term growth, creating a sustainable business model that returns it to a Big Tech valuation over the next 30 years. In my opinion, shareholders and management would be wise to remember one key point of the Nvidia investment thesis: it is still early days for AI, and Nvidia has “plenty of time.”
Analyst’s Disclosure: I/we have no stock, option or similar derivative position in any of the companies mentioned, and no plans to initiate any such positions within the next 72 hours. I wrote this article myself, and it expresses my own opinions. I am not receiving compensation for it (other than from Seeking Alpha). I have no business relationship with any company whose stock is mentioned in this article.
Seeking Alpha’s Disclosure: Past performance is no guarantee of future results. No recommendation or advice is being given as to whether any investment is suitable for a particular investor. Any views or opinions expressed above may not reflect those of Seeking Alpha as a whole. Seeking Alpha is not a licensed securities dealer, broker or US investment adviser or investment bank. Our analysts are third party authors that include both professional investors and individual investors who may not be licensed or certified by any institute or regulatory body.


