Summary:
- Nvidia Corporation’s revenue and guidance have consistently increased by $4 billion per quarter, beating estimates by $2 billion, creating predictability in its earnings reports.
- The stock’s lack of surprise and high implied volatility levels have led to a decline in its trading price, despite strong financial performance.
- Short sale volume has been significant, with traders buying back positions, potentially supporting the stock price temporarily.
- Nvidia’s growth is expected to slow, making its high valuation questionable, and any break in its predictable pattern could negatively impact the market.
William S Jones
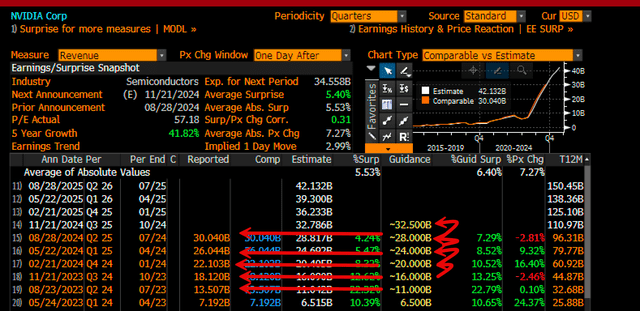
To no surprise, NVIDIA Corporation (NASDAQ:NVDA) just reported revenue and guidance that was as predictable as the Sun rising over the eastern horizon every morning. The company has had a predictable pattern of increasing guidance by $4 billion per quarter for the past five quarters and beating the provided guidance by $2 billion. This trend started some quarters ago, and to no surprise, it happened again yesterday.
The Rule of 4 and 2
Nvidia may have “beat” the Q2 consensus of $28.9 billion, which is not much of a surprise to anyone who saw the pattern prior. The guidance was also not surprising, considering the street was already just around $32 billion. If this pattern persists, analysts will probably need to raise their estimates for the fiscal third quarter of 2025 to something closer to $34.5 billion.
The cadence of the beats and raises is striking, especially considering the number we are referring to: billions of dollars. It was so easy to see that yesterday, in a note written in our IG service Reading The Markets, it was written:
Over the past four quarters, Nvidia has established a pattern of guiding revenue estimates higher and then surpassing them by $2 billion. For example, the company guided last quarter to $24 billion, with the street estimating $24.7 billion, and Nvidia reported $26 billion. Based on the pattern of the past four quarters, the company guided this quarter to $28 billion, which implies the company reports $30 billion.
Another consistent trend has been Nvidia raising its guidance by $4 billion each quarter. If this continues, the company could guide for $32 billion for next quarter, a figure the market is already anticipating. This suggests that both the revenue surprise and the guidance increase might be in line with expectations, reducing the element of surprise in Nvidia’s earnings report.
Hard To Surprise
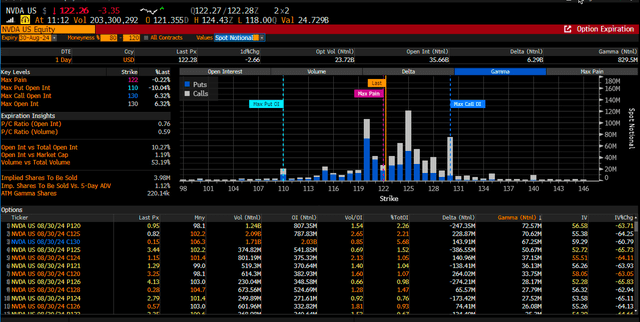
But really, this creates an environment for the stock that makes it difficult to surprise, which is part of why the stock is trading lower following the results. The other part, as noted previously, is that the market was incredibly bullish on the name, and the implied volatility levels reached some really high levels. Those implied volatility levels are melting lower today, and the calls above $125 are losing value, creating market hedging flows that are suppressing the stock.
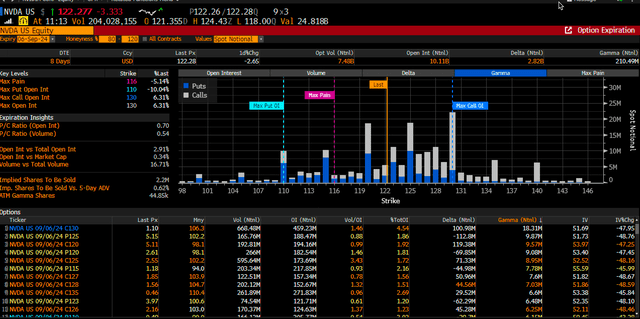
However, one problem may arrive next week because the gamma levels supporting the stock at $120 this week will decline dramatically. Therefore, it may be much easier for the stock to break the $120 level next week and head lower than it is likely to break it this week.
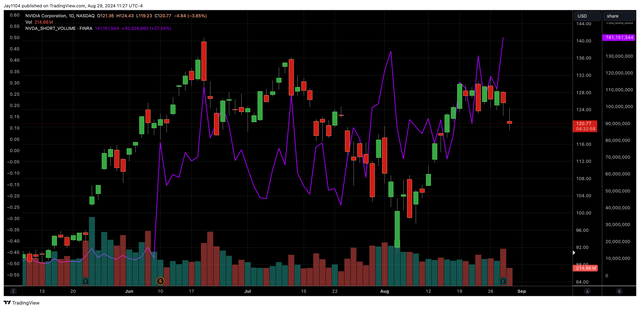
Furthermore, according to FINRA, short sale volume has accounted for about a third of the overall trading volume in Nvidia in the past two weeks. In fact, yesterday, that volume hit 141 million shares and was steadily trending higher starting around August 15. It is likely that many of those traders shorting the stock in the $130 range are now buying back their short positions and potentially helping to create a bid in the shares.
Too Expensive For Future Growth
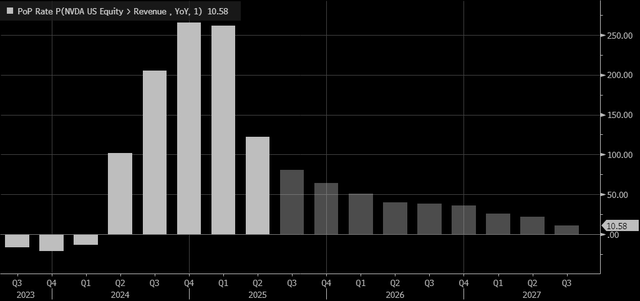
Ultimately, this company is past peak growth, with a revenue growth rate expected to decline materially over the coming quarters. Given its predictable nature of guiding up by $4 billion from the previous quarter and beating by $2 billion, it apparently has no ability to surprise the market any longer.
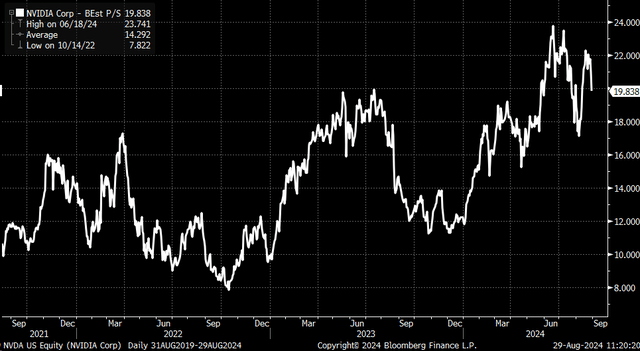
One must wonder if this stock is worth paying almost times 20 its NTM forward sales estimates at this point of the game, with peak growth now behind and growth only slowing going forward. The real risk, of course, is the quarter that the cycle of 4 and 2 breaks. This is because when it breaks, given the law of large numbers, it likely breaks to the downside, and that will come as a surprise to the market and not in a good way.
It has undoubtedly become a critical stock to the entire market – a little too important, given how nervous the market seemed ahead of its results.
Analyst’s Disclosure: I/we have no stock, option or similar derivative position in any of the companies mentioned, and no plans to initiate any such positions within the next 72 hours. I wrote this article myself, and it expresses my own opinions. I am not receiving compensation for it (other than from Seeking Alpha). I have no business relationship with any company whose stock is mentioned in this article.
Charts used with the permission of Bloomberg Finance L.P. This report contains independent commentary to be used for informational and educational purposes only. Michael Kramer is a member and investment adviser representative with Mott Capital Management. Mr. Kramer is not affiliated with this company and does not serve on the board of any related company that issued this stock. All opinions and analyses presented by Michael Kramer in this analysis or market report are solely Michael Kramer’s views. Readers should not treat any opinion, viewpoint, or prediction expressed by Michael Kramer as a specific solicitation or recommendation to buy or sell a particular security or follow a particular strategy. Michael Kramer’s analyses are based upon information and independent research that he considers reliable, but neither Michael Kramer nor Mott Capital Management guarantees its completeness or accuracy, and it should not be relied upon as such. Michael Kramer is not under any obligation to update or correct any information presented in his analyses. Mr. Kramer’s statements, guidance, and opinions are subject to change without notice. Past performance is not indicative of future results. Neither Michael Kramer nor Mott Capital Management guarantees any specific outcome or profit. You should be aware of the real risk of loss in following any strategy or investment commentary presented in this analysis. Strategies or investments discussed may fluctuate in price or value. Investments or strategies mentioned in this analysis may not be suitable for you. This material does not consider your particular investment objectives, financial situation, or needs and is not intended as a recommendation appropriate for you. You must make an independent decision regarding investments or strategies in this analysis. Upon request, the advisor will provide a list of all recommendations made during the past twelve months. Before acting on information in this analysis, you should consider whether it is suitable for your circumstances and strongly consider seeking advice from your own financial or investment adviser to determine the suitability of any investment.
Seeking Alpha’s Disclosure: Past performance is no guarantee of future results. No recommendation or advice is being given as to whether any investment is suitable for a particular investor. Any views or opinions expressed above may not reflect those of Seeking Alpha as a whole. Seeking Alpha is not a licensed securities dealer, broker or US investment adviser or investment bank. Our analysts are third party authors that include both professional investors and individual investors who may not be licensed or certified by any institute or regulatory body.
Join Reading The Markets
Reading the Markets helps readers cut through all the noise, delivering daily video and written market commentaries to prepare you for upcoming events.
We use a repeated and detailed process of watching the fundamental trends, technical charts, and options trading data. The process helps isolate and determine where a stock, sector, or market may be heading over various time frames.


