Summary:
- Nvidia Corporation’s downward trajectory is the right direction to make it attractive for additional accumulation.
- In light of normal DSO and strong free cash flow, concerns about a single data point showing increased accounts receivables seem overblown.
- Nvidia’s revenue is backed by increased CAPEX from major tech giants, though reliance on few customers poses long-term concentration risks and CAPEX growth decelerates.
- My valuation estimates for Nvidia range between $90 and $120, while the current trading price of $132 indicates the stock is still priced for perfection, though gradually approaching fair value.
- Despite yet again beating estimates, Nvidia’s stock reaction remains muted, highlighting high market expectations and the need for cautious valuation.
BING-JHEN HONG
Nvidia Corporation’s (NASDAQ:NVDA) ongoing, now double-digit decline over the past weeks — in particular after the Q3 earnings report — dropping from nearly $150 to $132, did not come as a big surprise. Nvidia has typically been, and continues to be, priced beyond perfection, which is why even “more than perfect numbers” failed to impress these days. However, it is precisely these “more than perfect” fundamentals that make Nvidia a Buy when it approaches a fairer valuation — and it does so from time to time for patient value-seekers.
In this article, I will delve into Nvidia’s recently sharply increased accounts receivables, a.k.a. unpaid customer bills, which have raised concerns among some observers regarding cash flow conversion from revenue. I find no significant cause for concern regarding these issues. To conclude, I will provide my updated valuation for Nvidia, marking its third iteration.
Accounts Receivables Worries Appear Overblown
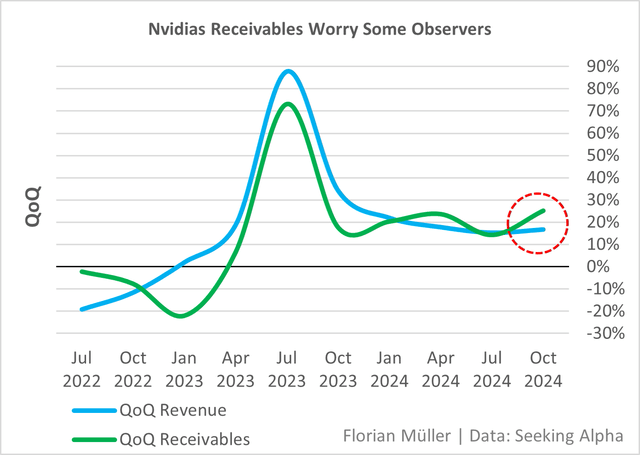
Compared to the previous quarter, some observers have pointed out a disproportionate increase in accounts receivables. These “unpaid customer bills” rose by 25%, outpacing revenue growth, which was only 17%. However, in the July quarter — as well as in the January and October quarters of last year — the opposite was the case. Over the long term, we see only a single noteworthy data point, which does not yet indicate a concerning trend.
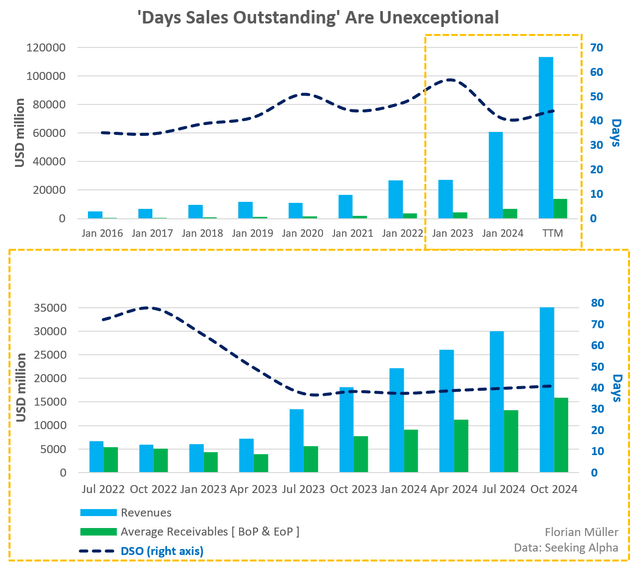
How long does it take Nvidia to receive payment from its customers? I calculate the Days Sales Outstanding (DSO) as the ratio of a period’s revenue to the average accounts receivable balance during that period, based on beginning and ending balances.
It turns out, Nvidia recently had to wait approximately 40 to 45 days to receive payments, with a slightly rising short-term trend. However, in the midterm, this is still significantly below the turnover durations seen in 2023, and in the long term, it aligns with the company’s historical average.
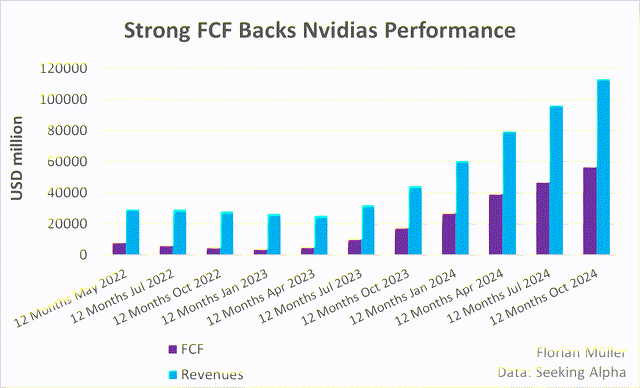
So far, there is no real cause for concern in Nvidia’s accounts receivables. Moreover, when valuing companies, we are far more interested in a metric other than accounting-based ones: free cash flow (FCF). This one is hardly influenced by accounting variables. If the accounts receivables trend were noteworthy, it would show in a free cash flow that fails to keep pace. That is not the case here. FCF growth has recently even outpaced revenue growth. FCF was calculated based on Seeking Alpha data, simplified as operating cash flow minus CAPEX.
A Closer Look At Revenue
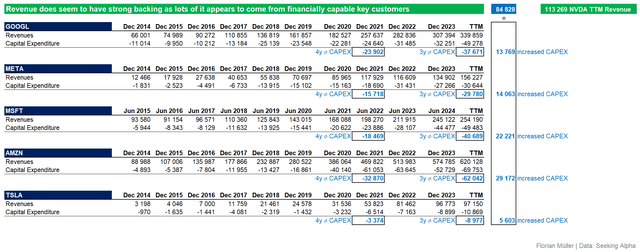
Let us take it a step further and try to analyze Nvidia’s revenue quality from a simplified bottom-up perspective. While we do not know the exact extent to which Nvidia serves specific customers, the latest 10-Q filings indicate three customers accounted for more than one-third of revenue in the last quarter and over the first nine months of the year. Likely, four customers contributed roughly 40-50%. It is assumed these include major players such as Alphabet (GOOGL) (GOOG), Meta (META), Microsoft (MSFT), Amazon (AMZN), and/or Tesla (TSLA). For all of these, we can observe their investment behavior.
Let us mark 2022, with the emergence of ChatGPT, as the major starting point of the AI arms race. Broadly speaking, this year in fact acted as a catalyst for increased CAPEX among the mentioned tech giants, as shown below. Let the average CAPEX of the four years before 2022 serve as the baseline, and then let the CAPEX average over the three years from 2022 to today represent the era of the AI arms race. Comparing these two values, we can roughly estimate the increased CAPEX and simplify by assuming that the lion’s share of this flows to Nvidia. Of course, this is not entirely accurate, but it balances out since Nvidia likely also received a share of CAPEX before this period.
Read the table below as follows: GOOGL had an average annual CAPEX of $23.9 billion from 2018 to 2021 and an annual average of $37.7 billion from 2022 to today. This represents a significant increase of $13.8 billion.
The increased CAPEX of all five companies, calculated this way, amounts to roughly $80 billion annually. Nvidia’s $113 billion in trailing twelve-month revenues does seem to have strong backing from financially capable key customers in this context, even if my estimate is highly simplified and likely overestimates the revenue Nvidia receives from these five companies.
Needless to say, however, having so few customers account for such a large share of revenue – especially such powerful tech giants – poses a significant concentration and bargaining power risk for Nvidia over the long term. Plus, their CAPEX growth rates have decelerated recently.
Valuation Update – Holding, Not Accumulating
See below how my cost of capital spot estimate parameters have changed since the last analysis. Bond yields have risen across the board, slightly increasing the WACC bottom line. Nvidia’s Beta remains high, although I apply the Blume adjustment as usual, which accounts for a reversion toward 1.
Author | Data: Seeking Alpha, Damodaran, dividendstocks.cash
For details, please refer to my previous articles. Essentially, I base my valuation on all available analyst estimates for the next five years (best, consensus, worst) and apply a wide range of WACC and terminal growth rates. Building on this, everyone can form their own opinion on which scenarios and sensitivities to consider.
I typically focus on the range where optimistic sensitivities across all forecast scenarios tend to overlap for Nvidia. Currently, this range lies between $90 and $120, with a clear preference for the double-digit range for additional purchases. At present, Nvidia still trades above this range, at $132, but has already made some progress, dropping a welcome $10 from the $142 level where it was when I started writing. Or in other words, based on my valuation model, to justify the current market price, one would have to rely on the best available analysts’ estimates and apply a combination of an 11% WACC and an 8% terminal growth rate after 2029.
Author | Data: Seeking Alpha, dividendstocks.cash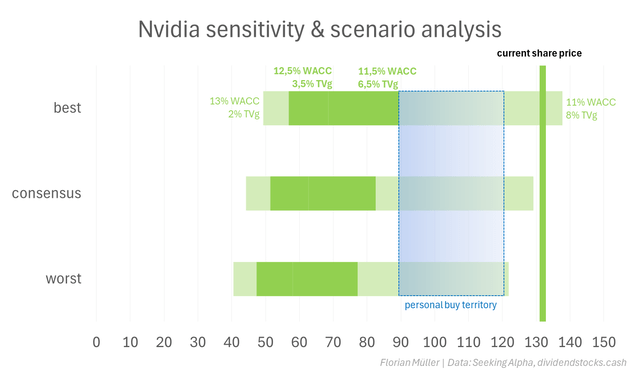
Understand that my own valuation spot estimates have risen over time for two reasons. The first, and most obvious, is increased analysts’ projections for FCF. The second, often overlooked yet essential, is the passage of time. As the higher projected cash flows draw nearer, their value increases as their realization becomes more probable. Simply put, this is the return through the passage of time – exactly the return we anticipate and pre-price in DCF models.
Great Business Continues To Be Priced For Perfection
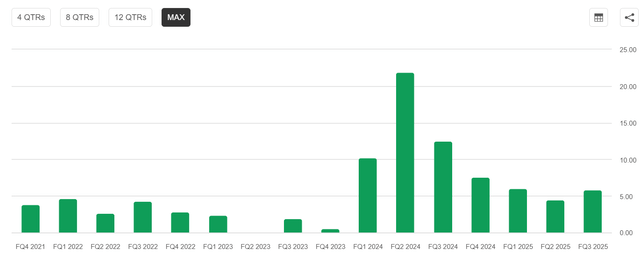
My conclusion for Nvidia’s stock price remains the same as in my first and second articles: it is priced for perfection. The significantly increased expectations are evident in the sharply reduced revenue surprises below. But we are complaining at a high level here. Last week, Nvidia once again solidly beat consensus estimates – delivering a nearly $2 billion beat in just one quarter. Yet, the stock reaction was muted – despite a $2 billion quarterly beat. Let that sink in. This once again highlights how high the frequently mentioned “whisper estimates” must have been. It is the same story as in my first two articles: an outstanding company with great momentum, but also priced accordingly.
Not only were estimates exceeded, but future projections were once again revised upward by analysts. The strength of Nvidia Corporation’s business is undeniable, but the crux going forward lies in the dynamics of expectations. While the 1-month upward revision trend still shows consistent increases for all quarters through mid-2027, the momentum is slowing compared to longer-term upward revision trends. “Beat and raise” is no longer enough, as the stock reaction demonstrated, reinforcing the validity of my valuation approach.
Upward revision trends (Seeking Alpha)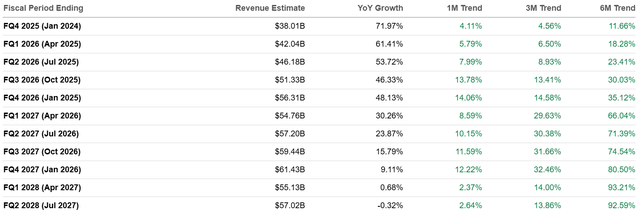
Analyst’s Disclosure: I/we have a beneficial long position in the shares of NVDA, MSFT, GOOGL either through stock ownership, options, or other derivatives. I wrote this article myself, and it expresses my own opinions. I am not receiving compensation for it (other than from Seeking Alpha). I have no business relationship with any company whose stock is mentioned in this article.
Seeking Alpha’s Disclosure: Past performance is no guarantee of future results. No recommendation or advice is being given as to whether any investment is suitable for a particular investor. Any views or opinions expressed above may not reflect those of Seeking Alpha as a whole. Seeking Alpha is not a licensed securities dealer, broker or US investment adviser or investment bank. Our analysts are third party authors that include both professional investors and individual investors who may not be licensed or certified by any institute or regulatory body.
