Summary:
- Nvidia Corporation’s strong growth is driven by key partnerships with major cloud providers and robust product development, projecting a 5-year forward revenue growth of 45%.
- The company’s US revenue surged due to high demand from top cloud companies like Microsoft, Meta, Amazon, and Alphabet, which account for 40% of Nvidia’s revenue.
- Despite trade restrictions, Nvidia continues to dominate the Chinese data center chip market, leveraging modified chips and supply chain redirection to mitigate impacts.
- Nvidia is well-positioned to capitalize on global cloud market growth, especially in Southeast Asia, supported by significant investments from AWS, Google, Microsoft, and Oracle.
JHVEPhoto
In our previous Nvidia Corporation (NASDAQ:NVDA) analysis, we highlighted Nvidia’s strong product development execution, including new releases like Blackwell, and its key partnerships with major cloud providers, which, we believe, will sustain its growth outlook and projected a 5-year forward revenue growth of 44.8%. We also believed Nvidia’s robust profitability could be supported by economies of scale, enhanced gross margins and lower operating expenses driven by its strong sales growth and capitalizing on its robust partner ecosystem.
In this analysis, we revisit the company following its robust performance in H1 2024, where its revenues grew by 171% YoY driven by its Data Center segment which grew 234% YoY and represents 87% of the company’s H1 2024 revenue, highlighting its continued strong performance. We examine whether the company still dominates the global data center chip market across the world, as we previously concluded Nvidia as the global leader in Datacenters and AI.
Firstly, we examine its revenue breakdown by geographic region and analyze the trend of its revenue breakdown. We highlight the trade restrictions imposed on the company for its sales to China and analyze whether Nvidia could mitigate these threats. Moreover, we examine its top customers’ breakdown and identify its major customers in relation to the top cloud service providers and highlight how the company stands to benefit as these companies continue their data center investments. Finally, we examine the trend of Nvidia’s growth outside the US and China, examining the planned expansions of data centers globally and how Nvidia could capitalize on that.
Strong US Growth Driven by Top Cloud Companies and Meta
Firstly, we examine the company’s geographic revenue growth trend below by compiling its geographic revenue breakdown in the past 10 years as well as H1 FY2025.
Nvidia has 2 types of customers, customers such as original device manufacturers (ODM) or original equipment manufacturers (OEM), as well as customers “who purchase through” the company’s direct customers such as “cloud service providers” and “consumer internet companies.” Based on its annual report, Nvidia recognizes its geographic revenues “based upon the billing location of the customer” rather than “end customer location.” Therefore, its customers may be billed in one location (which the company records for its revenue breakdown) and have their purchases shipped to another location.
In terms of geographic breakdown, from FY2014 to FY2021, the company had broken its regional revenues into 6 regions: US, Taiwan, China (including HK), Other APAC, Europe, Other countries. From FY2021 to FY2024, the company only reported 4 regions: the US, Taiwan, China (including HK), Other countries. Notably, the company had recently reported Singapore for FY2025, and the company currently reports 5 regions: US, Taiwan, China (including HK), Singapore and Other countries. Overall, Nvidia’s geographic reporting shifted from six regions (including Other APAC and Europe) to four regions from FY2021 to FY2024, with Singapore added as a separate region in FY2025.
Geographic Breakdown
Company Data, Khaveen Investments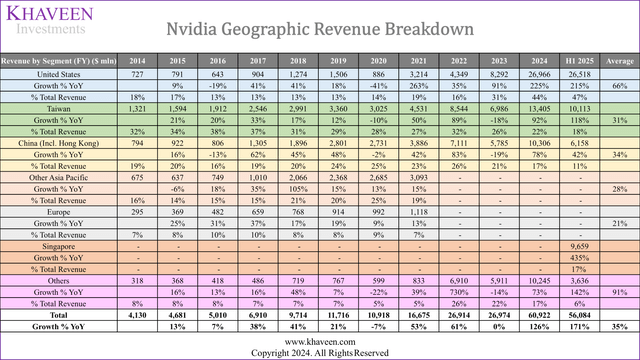
In terms of its geographic revenue breakdown, the US has been the largest geographic region for the company since FY2023 and continued to see explosive growth through H1 2025, with its share of revenue rising from 13.8% in 2020 to 47.3% in H1 2025, driven by sharp increases in 2024 and H1 2025, which “was primarily due to by higher U.S.-based Data Center end demand.” The company’s second-largest geographic region is Taiwan, which represents 18% of revenue in H1 2025. Although its growth had been strong, growing by an average of 31% since 2014, its share of revenues dropped from 32% to 18% in H1 2025 during the same period despite strong growth. China is the fourth-largest geographic region for Nvidia, accounting for 11% of revenues in H1 2025. Despite trade restrictions introduced in 2022 (FY2023), the company’s growth in 2024 and H1 2025 had still been strong but below the company’s total growth. Moreover, its Others segment growth has been particularly strong, growing on average 91% over the last 10 years and accounting for 17% of 2024 revenues.
Furthermore, Singapore’s revenues grew impressively by 435% from $1,804 in H1 2024 to $9,659 mln in H1 2025. However, we note that according to its quarterly report, in Q1 2024, the company noted the shipping location difference in Singapore revenue as “most of the shipments associated with Singapore revenue went to either the United States or Taiwan in the first quarter of fiscal year 2025. Shipments to Singapore were insignificant.” This is because Nvidia records revenues based on customer billing location rather than end location. Therefore, it implies the company’s customers were billed in Singapore, but the shipments were sent to the US and Taiwan. We believe the shipments from Singapore to the US were likely because orders from the top 5 US cloud companies, including AWS (AMZN), Microsoft Azure (MSFT), and Google Cloud (GOOG) account for 78% of the global cloud market share. Moreover, we believe the shipments from Singapore to Taiwan were likely because of Taiwan ODMs and server markers such as Foxconn (OTCPK:FXCOF), Inventec, and Wistron.
We delve deeper into its growth in the US segment, by examining the company’s revenue breakdown of its top customers. From its latest quarterly report in Q2, “four customers that it did not name accounted for 46% of its $30 bln in revenue.” Therefore, we identify who these large customers of Nvidia could be, then examine their spending growth outlook in terms of capex and whether Nvidia could still dominate the US market.
Nvidia Largest Customers
|
Revenue Breakdown by Top Customers |
FY2024 |
FY2024 Revenue ($ bln) |
|
Microsoft |
15% |
9,138 |
|
Meta (META) |
13% |
7,920 |
|
Amazon |
6% |
3,655 |
|
Alphabet |
6% |
3,655 |
|
Total |
40% |
24,369 |
Source: Company Data, UBS, Bloomberg, Khaveen Investments.
While Nvidia does not disclose its revenue breakdown by customers, according to UBS (UBS), its largest customer is believed to be Microsoft. Additionally, based on Bloomberg estimates, Microsoft, Meta, Amazon, and Alphabet as its largest customers account for 40% of the company’s total revenue, highlighting its high revenue concentration. Moreover, the 40% revenue breakdown by its top US customers coincides with the company’s US geographic revenue breakdown of 44% for FY2024.
|
Number of Nvidia GPUs Purchased |
Number of Nvidia GPUs (2023) |
Total Spending on Nvidia GPUs (2023) ($ mln) |
|
Microsoft |
280,621 |
8,419 |
|
Meta |
243,068 |
7,292 |
|
Amazon |
115,649 |
3,469 |
|
Alphabet |
108,549 |
3,256 |
Source: Company Data, Bloomberg, Khaveen Investments.
According to Bloomberg, Microsoft leads with the highest number of GPUs purchased, and total dollar spending, followed by Meta, Amazon, and Alphabet. This also fairly coincides with each company’s revenue contribution from the previous table above. Based on the spending and number of GPUs purchased data, the average pricing per GPU is around $30,000which is the average price of the H100. Additionally, Meta is expected to increase their purchase of Nvidia GPUs for 2024 and has plans to purchase 600,000 GPUs in total for 2024. Moreover, Microsoft is expected to “double its inventory of GPUs to 1.8 million” by purchasing over 900,000 GPUs in 2024.
Top Customers Capex Guidance
We compiled the capex of the largest 4 customers including Microsoft, Amazon and Alphabet, and Meta in the past 2 years and management-guided capex in 2024. We also compiled capex projections based on analysts’ consensus.
|
Capex ($ bln) |
2022 |
2023 |
2024F |
2025F |
|
Microsoft |
23.89 |
28.11 |
44.48 |
62.0 |
|
Growth % |
17.7% |
58.2% |
39.4% |
|
|
Meta |
31.43 |
27.27 |
38.5 |
46.47 |
|
Growth % |
-13.3% |
33.3% |
20.7% |
|
|
Amazon |
63.65 |
52.73 |
52.5 |
70.60 |
|
Growth % |
-17.2% |
-11.9% |
34.5% |
|
|
Alphabet |
31.49 |
32.25 |
48.0 |
54.61 |
|
Growth % |
2.4% |
8.4% |
13.8% |
|
|
Total |
150.45 |
140.35 |
183.48 |
233.67 |
|
Growth % |
-6.7% |
30.7% |
27.4% |
Source: Company Data, Bloomberg, Khaveen Investments, MarketScreener.
Based on the table, it is evident that these companies’ capex growth has accelerated in 2024 and is even projected to continue going into 2025 based on analyst’s consensus with a total capex growth of 30.7% and 27.4% in these 2 years respectively. In 2024, Microsoft leads at 58.2% and Meta rising strongly by 33.3%. Google and Meta are justifying their continuous capital expenditures in AI infrastructure by emphasizing the significant risks associated with underinvestment. During its previous earnings call, Google‘s CEO stated, “the risk of under-investing is dramatically greater than the risk of over-investing for us,” highlighting the company’s strong commitment to data center investments. This view is similar to Meta’s CEO, stating that “the downside of being behind is that you’re out of position for the most important technology for the next 10 to 15 years.”
Adoption of Nvidia’s New Blackwell Chips
Company Data, The Register, Khaveen Investments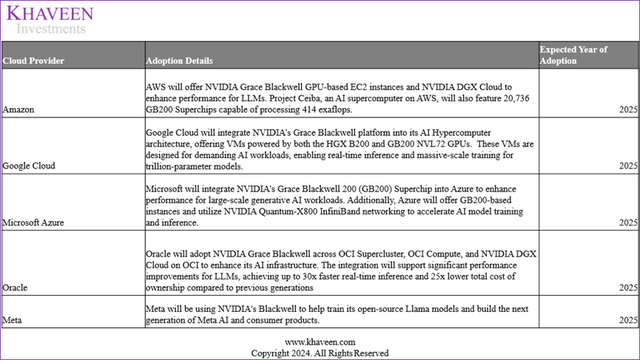
We believe Nvidia stands to gain significantly from the increased capital expenditures by major cloud service providers adopting its Grace Blackwell GPU platform. As AWS, Google, Microsoft, and Oracle (ORCL) plan to integrate this advanced technology into their infrastructures, Nvidia is positioned to capture a substantial portion of their investments. For instance, AWS will offer Nvidia Grace Blackwell GPU-based EC2 instances and Nvidia DGX Cloud to enhance performance for LLMs. Additionally, AWS EC2 G4 instances for deploying machine learning models are available with AMD Radeon Pro V520 GPUs. Google Cloud will incorporate Blackwell into its AI Hypercomputer architecture, providing VMs designed for demanding AI workloads. However, Google Cloud executives highlighted the company is not planning to adopt AMD’s AI chips and is only planning to use Nvidia GPUs as well as Google Cloud’s own TPUs. Microsoft aims to improve its Azure offerings with the GB200 Superchip, while Oracle plans to adopt Nvidia’s Grace Blackwell across OCI services to enhance its AI infrastructure. Notably, Microsoft Azure also offers cloud computing customers access to AMD’s MI300X AI chips, and also Oracle Cloud Infrastructure is utilizing AMD MI300X to offer better AI workload solutions for its customers. Meta will also be using Blackwell for training its “open-source Llama models and build the next generation of Meta AI and consumer products”. However, Meta is also utilizing AMD Instinct MI300X for Meta’s AI interface.
Outlook
Overall, we expect Nvidia, whose revenues have become increasingly concentrated in the US geographic region segment due to the strong growth of US-based cloud companies and Meta, to continue having a strong foothold in the region. This is due to Nvidia’s top customers which include Microsoft, Google, Meta, and Amazon which are the company’s largest customers accounting for 40% of revenues in the last fiscal year are expected to continue increasing their capex with a total growth of 27.4% based on analysts’ consensus as these companies continue to invest to expand their data center capabilities for AI. We believe Nvidia is well-positioned to capitalize on this growth in spending by these companies going into 2025 as Nvidia ramps up its new Blackwell server GPUs, which will be implemented across these companies’ data center expansions. Additionally, we previously highlighted Nvidia’s competitive advantage with the new Blackwell chips in terms of key specifications over competitors such as AMD (AMD) and Intel “which stands out with its 4nm processor, the highest transistor counts at 208 bln, and exceptional FP16 and INT8 peak performance metrics, 10,000 teraflops and 40,000 teraflops, respectively.”
China Outlook Still Robust Despite Restrictions on Data Center
Furthermore, we examine whether Nvidia could still dominate the Chinese data center chip market despite trade restrictions on Data Center products. As mentioned in the first point, China is the fourth-largest geographic region for Nvidia, accounting for 11% of revenues in H1 2025. Despite trade restrictions introduced in 2022 (FY2023), the company’s growth in 2024 and H1 2025 had still been strong but below the company’s total growth.
From its latest earnings briefing, management highlighted that “data center revenue in China grew sequentially in Q2 and is a significant contributor to our data center revenue.” However, management also noted that “as a percentage of total data center revenue, it remains below levels seen before the imposition of export controls.”
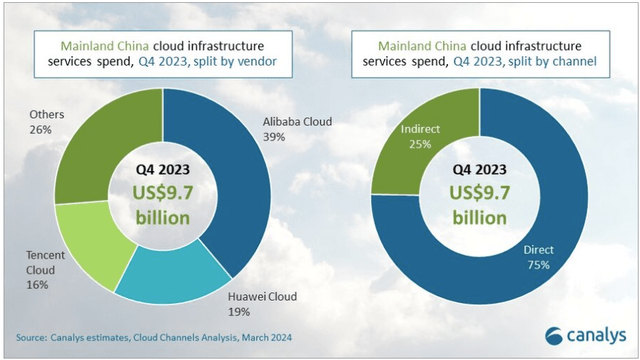
China Cloud Market Share
Based on the chart above, Alibaba Cloud (BABA) holds the largest market share of the Chinese cloud market in Q4 2023 with 39% market share, followed by Huawei Cloud with 19%, and Tencent Cloud with 16%. Furthermore, Alibaba highlighted in their Q1 FY2025 that the company will “continue to invest in R&D and AI CapEx to ensure the growth of our AI-driven cloud business,” highlighting its data center expansion plans. In terms of AI chips, as of September, Huawei has begun shipping its new Ascend 910C samples to companies such as Alibaba, Baidu (BIDU), and Tencent (OTCPK:TCEHY), which could indicate potential AI chips being bought by these companies.
Export Restrictions and Circumvention
In 2023, Nvidia’s customers in China include Baidu, ByteDance (TikTok), Tencent, and Alibaba, whereby the 4 companies have collectively “made orders worth $1 bln to acquire about 100,000 A800” with a “further $4bn worth of the graphics processing units to be delivered in 2024.” However, in October 2023, the US banned the exports of H800 alongside A100, A800, H100, H800, and L40 products. In response to these rules, Nvidia launched its H20, L20, and L2, which are “modified versions of Nvidia’s H100 AI chip” to comply with the Chinese export restrictions. Furthermore, it was projected that H20 sales would reach $12 bln or 1 mln units. Notably, it was reported that ByteDance has ordered $2 bln worth of H20 or 200,000 H20s for “AI model training.”
Comparison of Nvidia Modified Chips with Chinese Competitors
We compared Nvidia’s modified chips in compliance with the Chinese restrictions including the H20, L20 and L2 with local Chinese competitors such as Moore Threadts, Cambricon, BIREN, Enflame, MetaX as well as custom chips by local cloud providers such as Huawei, Alibaba, Baidu and Tencent, to determine if Nvidia’s products are still competitive.
Company Data, Tom’s Hardware, Khaveen Investments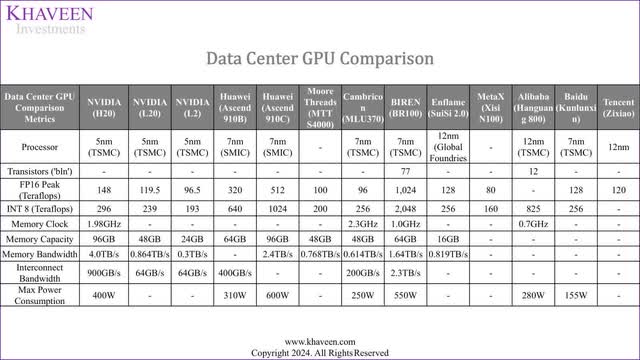
Based on the table above, Nvidia’s H20 GPU performs relatively well against its competition, having one of the lowest processor nodes at 5nm as well as having decent FP16 Peak (Teraflops) performance against competitors such as Moore Threads (MTT S4000) and Cambricon (MLU370). However, its H20 FP16 and INT 8 performance pales in comparison to BIREN (BR100) and Huawei’s Ascend 910B and upcoming Ascend 910C in October. However, while BIREN (BR100) has the highest performance of all chips, BIREN is blacklisted by the US, which made “it impossible for the company to produce its BR100/BR200 GPUs (i.e., these GPUs for AI cannot be made by TSMC),” as of September.
We also compiled Nvidia’s original GPUs (H20, L20 and L2), which are modified versions of the company’s H100, L40 and L4 GPUs respectively, to analyze whether the company demonstrates a performance advantage against its Chinese competitors.
Company Data, Tom’s Hardware, Khaveen Investments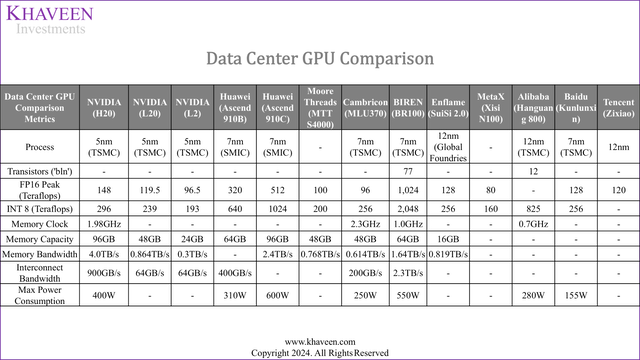
Compared to the modified versions (H20, L20, and L2), the normal unmodified versions (H100, L40, and L4) show a better relative performance overall. Additionally, the company’s H100 GPU chip demonstrates a strong performance advantage against all top Chinese AI chips, as its FP16 and INT8 are almost double that of its closest competitor, BIREN (BR100), and quadruple its second-closest competitor, Huawei’s upcoming 910C, highlighting H100 robust performance. Furthermore, all the company’s chips (H100, L40, and L4) utilize 5nm (TSMC) whereas its competitors’ processors range from 7nm to 12nm, indicating the company’s process node strength.
Supply Redirection
According to Reuters, Chinese companies are bypassing export restrictions by acquiring Dell (DELL), Supermicro (SMCI), Gigabyte servers that have Nvidia GPUs, Moreover, it was further reported that Supermicro servers equipped with 8 H100 chips were being frequently shipped by merchants from Malaysia, Japan, Indonesia and sent to Hong Kong, which servers were further sent to Shenzhen, highlighting a supply chain redirection into China. Based on its 2023 annual report, Supermicro’s main manufacturing facilities are located in the US, as of 2.9 mln of office and manufacturing space owned, 1.3 mln are located in the US, whereas Taiwan was represented 0.95 mln. Furthermore, in terms of long-term property plant and equipment, the US represented $183 mln of PP&E, whereas Asia as a whole represented $104 mln in PP&E, highlighting Supermicro’s concentration in the US. Furthermore, according to The New York Times, Chinese companies are also circumventing export sanctions by creating new entities, whereby “once a company is blacklisted, its executives swiftly establish a new firm to continue acquiring restricted technology.”
Outlook
Overall, we believe that the company could still dominate the Chinese data center chip market despite trade restrictions on Data Center products. Firstly, the company’s H20 chip performs well against its competitors, as the company has one of the lowest processor nodes at 5nm and above-average FP16 Peak (Teraflops) and INT 8 performance. Moreover, Nvidia’s strongest competitor in the Chinese, BIREN (BR 100) is currently blacklisted from producing its BR 100 and is unable to “develop new products (unless the U.S. gov’t grants another export license to companies that produce electronic design automation tools),” which we believe enhances Nvidia’s competitiveness in the near term. Additionally, the company is also planning to release a new export-compliant AI chip (B20) in China, which is a variant of the company’s B200 AI GPU with shipments expected to begin in Q2 2025, we believe the new AI B20 chip could further enhance Nvidia’s competitiveness in China for 2025 despite the current export trade restrictions. Additionally, if Chinese companies can work around the rules by redirecting their orders, such as through buying servers from server makers manufacturing it outside of China, this would also mitigate the impact to Nvidia as its revenues would be recorded in other regions outside of China.
Nvidia Benefits from Top Customers’ Global Data Center Expansions
Finally, we examine Nvidia’s foothold beyond the US and China. We highlighted in the first section the company’s robust growth beyond the US and China, reflected in the Others segment which grew by 142% YoY in H1 2025.
Data Center Market Breakdown
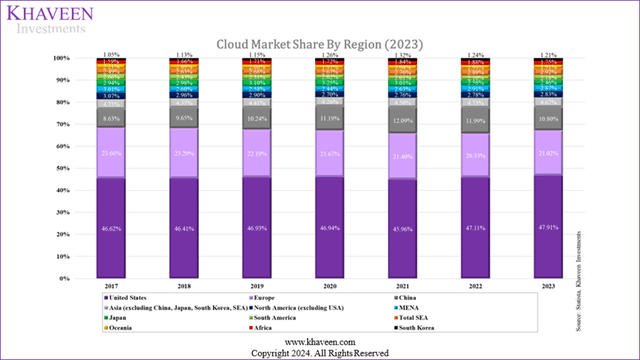
We compiled the global cloud market (IaaS and Paas) market size and breakdown from Statista below including their forecast CAGR for each region.
|
Region |
Market Size in 2023 ($ bln) |
Average Growth Rate (2017-2023) |
Market Size Breakdown % |
Forecast CAGR |
|
United States |
131.70 |
36.39% |
47.91% |
18.37% |
|
North America (excluding USA) |
7.77 |
33.97% |
2.83% |
15.36% |
|
Europe |
57.79 |
33.24% |
21.02% |
18.43% |
|
China |
29.68 |
41.37% |
10.80% |
20.56% |
|
Japan |
6.75 |
32.17% |
2.46% |
18.68% |
|
South Korea |
3.34 |
39.48% |
1.21% |
18.84% |
|
Asia (excluding China, Japan, South Korea, SEA) |
12.83 |
38.32% |
4.67% |
16.85% |
|
MENA |
7.90 |
35.12% |
2.87% |
19.23% |
|
South America |
5.99 |
31.55% |
2.18% |
19.36% |
|
Oceania |
5.25 |
32.61% |
1.91% |
19.29% |
|
Africa |
4.82 |
38.09% |
1.75% |
21.01% |
|
Singapore |
4.13 |
42.34% |
1.50% |
18.96% |
|
Indonesia |
1.08 |
36.12% |
0.39% |
22.74% |
|
Malaysia |
0.88 |
36.03% |
0.32% |
21.24% |
|
Thailand |
0.91 |
42.53% |
0.33% |
20.26% |
|
Philippines |
0.61 |
37.10% |
0.22% |
24.86% |
|
Vietnam |
0.43 |
31.96% |
0.15% |
23.75% |
|
Total |
274.90 |
35.49% |
100.00% |
18.96% |
Source: Statista, Khaveen Investments.
Based on the table, the US holds a dominant position in the cloud market, accounting for 46.73% of the global share. China, holding the second-highest cloud market share at 10.53%, has also shown significant growth, with a 41% growth rate during this period. Southeast Asian nations exhibited high growth in the cloud market, with notable standout performers being Thailand and Singapore, which exhibit the highest growth rates among all countries, at 43% and 42% respectively. Looking forward, the global cloud market forecasts show robust growth across all regions. However, Southeast Asia has a higher relative CAGR with CAGRs ranging from 18.96% to 24.86%.
Planned Investments by Top Cloud Providers
We compiled the table below of the planned investments by various cloud providers such as Google, AWS, Microsoft, and Oracle across various geographic regions to analyze the investment trends of these companies.
|
Cloud Companies Planned Investments By Region ($ bln) |
Oracle Planned Investment |
Microsoft Planned Investment |
Google Planned Investment |
AWS Planned Investment |
Total Planned Investment |
Planned Investment Breakdown |
Cloud Market Share Breakdown |
|
United States |
N/A |
N/A |
N/A |
11.00 |
14.00 |
7.31% |
47.91% |
|
North America (excluding USA) |
N/A |
1.80 |
N/A |
29.80 |
31.60 |
16.49% |
2.83% |
|
Japan |
8.00 |
2.90 |
1.00 |
15.24 |
27.14 |
14.16% |
2.46% |
|
Asia (excluding China, Japan, South Korea, SEA) |
16.70 |
N/A |
3.70 |
N/A |
8.46 |
6.78% |
4.67% |
|
South Korea |
N/A |
1.80 |
N/A |
5.88 |
7.68 |
4.01% |
1.21% |
|
China |
N/A |
N/A |
N/A |
N/A |
N/A |
N/A |
10.80% |
|
Europe |
1.00 |
4.80 |
N/A |
18.92 |
24.72 |
12.90% |
21.02% |
|
Malaysia |
6.50 |
2.20 |
2.00 |
6.20 |
16.90 |
8.82% |
0.32% |
|
Singapore |
N/A |
N/A |
N/A |
9.00 |
9.00 |
4.70% |
1.50% |
|
Thailand |
N/A |
2.82 |
2.82 |
2.82 |
8.46 |
4.41% |
0.33% |
|
Indonesia |
N/A |
1.70 |
N/A |
5.00 |
7.00 |
3.65% |
0.39% |
|
Vietnam |
N/A |
N/A |
N/A |
N/A |
N/A |
N/A |
0.15% |
|
Philippines |
N/A |
N/A |
N/A |
N/A |
N/A |
N/A |
0.22% |
|
Southeast Asia Total |
41.36 |
6.50 |
6.72 |
4.82 |
23.02 |
21.58% |
2.91% |
|
Oceania |
N/A |
3.20 |
N/A |
8.86 |
12.06 |
6.29% |
1.91% |
|
MENA |
1.50 |
1.50 |
N/A |
5.30 |
8.30 |
4.33% |
2.87% |
|
South America |
N/A |
2.70 |
0.85 |
1.80 |
5.35 |
2.79% |
2.18% |
|
Africa |
N/A |
N/A |
1.00 |
1.70 |
2.70 |
1.41% |
1.75% |
|
Total |
191.61 |
17.00 |
29.12 |
10.67 |
134.52 |
100% |
100% |
Source: Company Data, Reuters, Business Standard, Khaveen Investments.
Based on the table, we see that the selected Southeast Asian countries have the highest share of planned investments with a total of 21.58%, highlighting the increased focus of these top cloud companies expanding into the region. This figure marks a contrast with the current region’s share of the cloud market of 2.9%. We previously highlighted in our Marvell analysis that the high data center growth is supported by government support initiatives such as Malaysia’s JENDELA broadband project which “aims to enhance digital infrastructure, supporting the rapid growth of data centers” according to ARC Group. Furthermore, strict “data sovereignty regulations” in the region, “require local data storage and processing, driving investments in local data centers.” From our previous analysis, in Thailand, the establishment of Special Economic Zones (SEZs) and Free Trade Zones (FTZs) offers various government incentives, such as favorable electricity rates and tax privileges. Malaysia can also be seen offering relatively low electricity costs, with only about 5 to 7 cents/kWh, compared to an average electricity cost of 12.5 cents/kWh in the US. Currently, SEZs have been set up in ten provinces across the country. Similarly, Singapore’s investments in AI and data centers have been strong. In 2022, the government introduced the Data Center Carbon Footprint Assessment (DC-CFA) Program to fund energy-efficient and sustainable data centers. Indonesia and Vietnam have both approved their National Data Centers projects, aiming to become fully digital by 2025 and 2030, respectively.
Other key regions with a large and notable share of data center investments by the top cloud companies include North America (excluding the US), due to AWS’ investment in Canada, which we believe may be due to its geographic proximity with the US. Moreover, Asian regions such as Japan and South Korea have a higher share of total planned investments relative to their share of the cloud market, indicating a greater focus on these regions by the top cloud providers as well due to their high-tech capabilities and government support for US-based cloud companies.
FDI of US vs. China In Southeast Asia
|
FDI Into Southeast Asian Countries |
US 2023 ($ bln) |
China 2023 ($ bln) |
|
Singapore |
49.7 |
13.1 |
|
Indonesia |
2.4 |
3.1 |
|
Thailand |
-1.3 |
2.0 |
|
Malaysia |
-1.6 |
1.4 |
|
Philippines |
0.1 |
N/A |
|
Vietnam |
N/A |
2.6 |
|
Cambodia |
N/A |
1.4 |
|
Laos |
N/A |
1.2 |
|
Total SEA FDI |
49.3 |
24.8 |
Source: US Bureau of Economic Analysis (BEA), Ministry of Commerce of the People’s Republic of China, Khaveen Investments.
Based on the table above, the US FDI in Southeast Asia is significantly higher than China’s FDI by $24.5 bln. Moreover, both countries FDI is significantly concentrated in Singapore, as a significant portion of the US’s FDI is being allocated to Singapore compared to other SEA countries, as well as in China, as more than half of China’s FDI is concentrated in Singapore. Overall, this highlights the US as a prominent investor in Southeast Asia and its commitment to investing in Southeast Asia.
Global Expansions To Benefit Nvidia
We believe Nvidia stands to benefit from the expansion of data center infrastructure driven by investments from major cloud providers as many of which utilize Nvidia’s chips in their data centers. For instance, Oracle recently announced a new cloud region in Malaysia will leverage “up to 131,072 Nvidia Blackwell GPUs, integrated with Nvidia ConnectX-7 NICs for RoCEv2 networking and Nvidia GB200 NVL72 rack solutions using liquid cooling and Nvidia Quantum-2 InfiniBand networking”. Additionally, Meta’s CEO, indicated that its compute infrastructure would “include 350,000 H100 graphics cards from Nvidia.” Despite Google developing its own custom silicon, CNBC reports that “Google data centers still rely on general-purpose central processing units or CPUs, and Nvidia’s graphics processing units.” AWS has also stated that it will “offer Nvidia’s newest chips on its cloud service.” Furthermore, Microsoft Azure is collaborating closely with Nvidia on the Grace Blackwell 200 Superchip to provide next-generation AI solutions.
Outlook
All in all, we believe Nvidia stands to capitalize on the global growth of the cloud market which is projected to grow robustly worldwide, particularly in Southeast Asia, where it generally has a higher CAGR than other regions. Additionally, we see the top US cloud companies expanding significantly worldwide outside the US, with notable regions across Southeast Asia and other Asian regions such as Japan and Korea as well as North America (excluding the US). Major cloud providers, including AWS, Google, Microsoft, and Oracle, are investing heavily in Southeast Asia, which we believe benefits from the robust government initiatives put in place to attract these major cloud companies. In turn, we believe Nvidia stands to benefit greatly from this growth, as these companies are among its top customers. For instance, Oracle plans to integrate Nvidia’s L40S GPU into its cloud offerings, while Google continues to rely on Nvidia’s GPUs alongside its custom silicon. Meta has committed to using 350,000 H100 graphics cards, and AWS will offer Nvidia’s latest chips on its cloud service. Additionally, Microsoft Azure is collaborating with Nvidia on the Grace Blackwell 200 Superchip for advanced AI solutions. Overall, we believe Nvidia will maintain a strong foothold in the global data center market.
Risk: Continuous Product Developments from Competitors
Nvidia faces significant competitive risks that could impact its market dominance in the AI chip sector. Key rivals like AMD and Intel are continuously developing new products to challenge Nvidia’s stronghold. For instance, AMD has launched its Instinct MI325X accelerator, while Intel is advancing its Lunar Lake AI chip and the Gaudi 3 accelerator. Additionally, custom chip development by major cloud providers such as Google, Amazon, and Microsoft poses a significant threat. These companies are investing in proprietary silicon solutions to optimize their cloud services, which could reduce their reliance on Nvidia’s GPUs. As these competitors ramp up their efforts, Nvidia’s market share may be pressured. Overall, while Nvidia currently holds a dominant position, the evolving landscape and increasing competition represent substantial risks to its growth trajectory.
Valuation
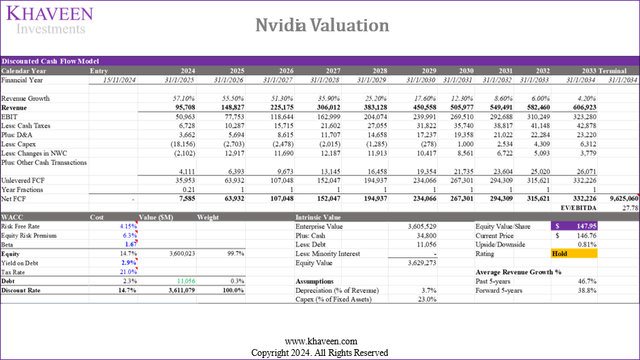
In terms of our valuation, we maintain similar assumptions to our previous analysis. As highlighted previously, our forecasts differ from analyst consensus’ whereby our forecasts are more stable compared to analysts’ consensus as we projected a stable growth outlook underpinned by its AI leadership. Based on a discount rate of 14.7% (company’s WACC), we derived an upside of only 0.81% from its current price.
Verdict
We believe Nvidia will continue to dominate the global data center semiconductor market, driven by rising capex investments from its key US cloud customers, including Microsoft, Google and Amazon, as well as Interactive Media company Meta which contributed 40% of its revenue last fiscal year. We believe these companies’ forecasted 27.4% capex growth in 2025 could fuel demand for Nvidia’s Blackwell GPUs, offering competitive advantages with its exceptional performance metrics. We believe Nvidia is well-positioned to capitalize on expanding cloud markets globally, particularly in Southeast Asia, where strong government initiatives attract significant investments from AWS, Google, Oracle, and Microsoft. We believe these developments, along with partnerships such as Oracle integrating Nvidia’s L40S GPU and Microsoft utilizing the Grace Blackwell 200 Superchip could further solidify Nvidia’s position.
As Nvidia strengthens its presence in these growing markets, we maintain our Hold rating with a price target of $147.95. Moreover, as the company is scheduled to release its upcoming Q3 earnings on November 20th, we will look out for further insights into its geographical revenue growth trend and upcoming details on its Blackwell launch and future product developments to support its Data Center growth outlook.
Analyst’s Disclosure: I/we have a beneficial long position in the shares of NVDA either through stock ownership, options, or other derivatives. I wrote this article myself, and it expresses my own opinions. I am not receiving compensation for it (other than from Seeking Alpha). I have no business relationship with any company whose stock is mentioned in this article.
No information in this publication is intended as investment, tax, accounting, or legal advice, or as an offer/solicitation to sell or buy. Material provided in this publication is for educational purposes only, and was prepared from sources and data believed to be reliable, but we do not guarantee its accuracy or completeness.
Seeking Alpha’s Disclosure: Past performance is no guarantee of future results. No recommendation or advice is being given as to whether any investment is suitable for a particular investor. Any views or opinions expressed above may not reflect those of Seeking Alpha as a whole. Seeking Alpha is not a licensed securities dealer, broker or US investment adviser or investment bank. Our analysts are third party authors that include both professional investors and individual investors who may not be licensed or certified by any institute or regulatory body.

