Summary:
- I know Nvidia Corporation was called overvalued when it was trading at $200, $300, $400, and so on. But today we’re approaching an objective reality that cannot be ignored.
- In today’s DCF model, I actually tried to deliberately inflate the company’s forecast numbers to account for the risk that the current consensus estimates were missing something.
- Even if we include unrealistically positive forecasts in our DCF model, Nvidia stock will be overvalued in most cases. The bull-case overvaluation stands at around 20%.
- Nvidia stands out as the priciest mega-cap stock. However, this wouldn’t concern investors if its long-term growth rates surpassed its peers’, yet they lag even behind Alphabet.
- Despite risks to my thesis, I reiterate my previous “Sell” rating for Nvidia stock today and call for avoiding this growth trap.
Bet_Noire
Introduction
I am well aware that I’m far from in the most advantageous position to call again to avoid NVIDIA Corporation (NASDAQ:NVDA) stock, as two of my recent “sell” calls have aged like milk:
Seeking Alpha, my coverage of NVDA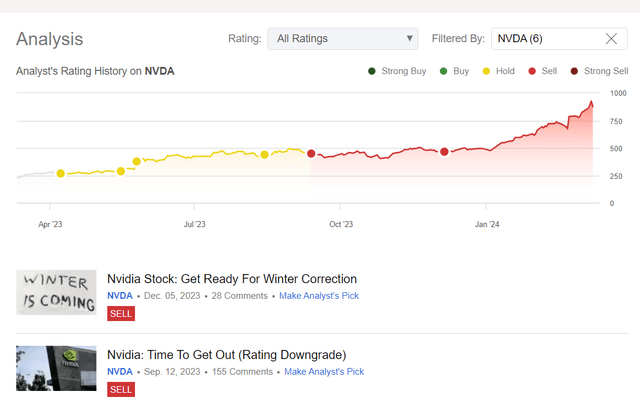
Three months have passed since my last bearish article on the company, and the stock has almost doubled, going against my concerns about growth rates and seasonality. Despite my past bad calls, I’ve decided to update my coverage of NVDA again and give the Bulls some food for thought.
In my line of work, being early is synonymous with being wrong, but I still believe my thesis has a much better chance of coming true now.
Why Do I Think So?
Let me begin with some notes right from the field. As I write these lines, NVDA stock is correcting a little after the massive 75% rise since the beginning of the year, outperforming all the other stocks in the “Magnificent 7” group. We definitely have to look at the whole price action in terms of the company’s impact on the overall market, as Nvidia recently reached a 6.5% share of the NASDAQ Composite Index (COMP:IND), which is represented by the Invesco QQQ Trust ETF (QQQ). Also, according to Jim Bianco, Nvidia accounts for over 60% of the total change in market capitalization of the QQQ this year, while the “NASDAQ 96” is down about 1.1% year to date:
Jim Bianco [@biancoresearch on X]![Jim Bianco [@biancoresearch on X]](https://static.seekingalpha.com/uploads/2024/3/11/49513514-17101800803967342.jpg)
Jim’s mini-study highlights not only how much influence NVDA has on the QQQ, but also the latest warning signs and mood swings. He highlights the role of the “2X Long Nvidia” ETF, GraniteShares 2x Long NVDA Daily ETF (NVDL), a leveraged fund linked to Nvidia’s performance, which has seen a surge in assets and trading volume in recent weeks. The massive red candle on the NVDL chart indicates, in his view, potential exits by leveraged market participants – it could lead to further downward pressure on Nvidia’s stock price (and the broad tech-driven market in general).
Jim Bianco [@biancoresearch on X]![Jim Bianco [@biancoresearch on X]](https://static.seekingalpha.com/uploads/2024/3/11/49513514-1710181473286109.png)
That’s a pretty interesting finding, but in my opinion, it’s just the tip of the iceberg. Such conclusions from the category of behavioral finance and the analysis of possible crowd actions are very important, but by far not the most important tool of financial analysis/forecasting. It’s much more important to look at dry facts and figures.
If you’re an Nvidia bull, you should have no questions about my assumptions below because I’m going to assume the most optimistic ones.
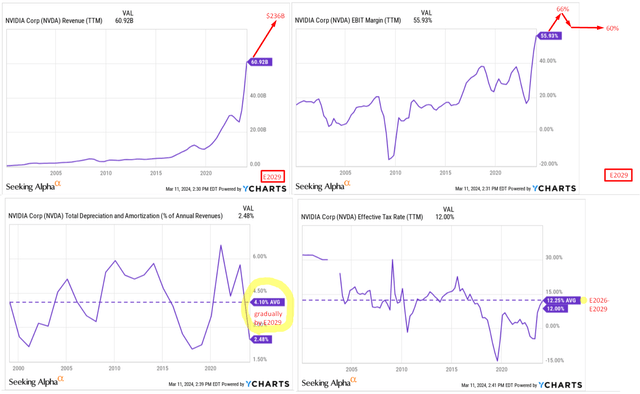
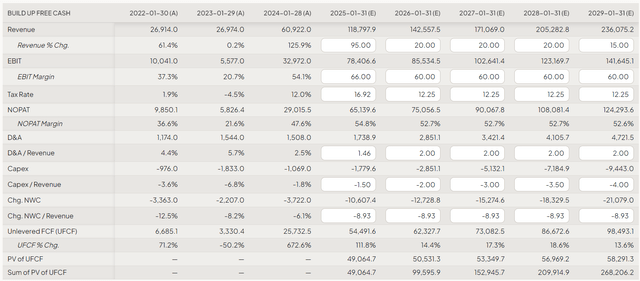
The current consensus assumes that NVDA’s revenue will grow at a CAGR of ~10.9% over the next 5 years (FY2025-29). I assume a CAGR of almost 15% for the same period. In addition, let’s assume that the company’s leading market position will not change and that the EBIT margin will reach 66% this year and 60% on average over the next 4 years. Nvidia operates in a fairly cyclical industry, so my assumption seems very optimistic.
As a value for the ratio of D&A to sales, I take the average of the last few years, which is much higher than the TTM value. I do this on purpose to increase the resulting FCF of the company.
It is logical to assume that the more and more stable a company earns in the future, the less favorable the tax legislation should be for it. However, I assume that the effective tax rate will tend towards the average of only 12.5%.
So, my key assumptions may be summarized below:
I’m going to use FinChat’s template as it seems to be one of the best options available for DCF napkin calculations out there. This is what my inputs look like within the model:
Now let’s take a look at the discount rate. Let’s assume that the current cost of debt for NVDA in the market is 4% – this is unrealistic and overly optimistic, as the current yield on 10-year government bonds is 4.1%. Let’s also assume that the market risk premium (MRP) is also 4% – this is also very optimistic because, by the logic of things, it should be higher. But even with such optimistic assumptions, this results in a WACC of 11%:
After discounting the projected FCFs and the optimistic assumption that the company’s free cash flows will grow in perpetuity at a growth rate of 7% (which is too much), it turns out that the stock is 20.7% overvalued today:
FinChat, the model’s output [author’s notes]![FinChat, the model's output [author's notes]](https://static.seekingalpha.com/uploads/2024/3/12/49513514-1710224756423406.png)
Assuming an exit multiple EV/FCF of 25-30x, this results in an overvaluation of around 19.5%:
FinChat, the model’s output [author’s notes]![FinChat, the model's output [author's notes]](https://static.seekingalpha.com/uploads/2024/3/12/49513514-17102249022679265.png)
So, you saw it yourself: I actually tried to deliberately inflate the company’s forecast numbers to account for the risk that the current consensus estimates were missing something. But even against the backdrop of my bullish input data, NVDA stock turned out to be quite expensive today. So if we adjust my findings to more realistic and probable assumptions, the resulting overvaluation may increase significantly. This is a major reason to stay away from the stock and not buy the current mini price dip, as it’s still not fairly valued.
You can also add the results of a comparative valuation here. I took the chart below from my Seeking Alpha colleague Oakoff Investments, which he recently produced in his amazing work on Amazon.com, Inc. (AMZN) stock.
Seeking Alpha data, taken from Oakoff Investments’ article on AMZN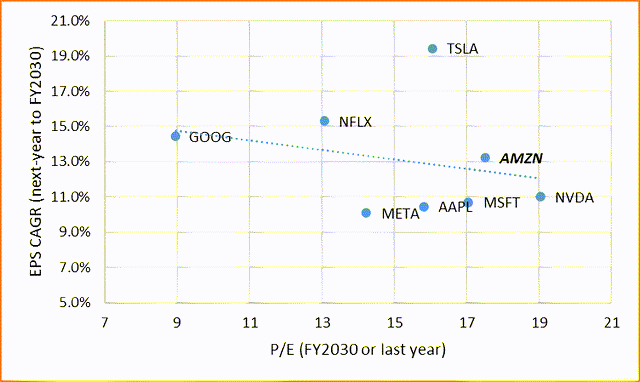
What do we see in this graph? Obviously, NVDA’s dot is at the right end of the chart comparing all the companies in the “Magnificent 7” group in terms of long-term P/E and EPS growth figures. This means that NVDA is the most expensive stock in the sample. And that wouldn’t be too worrying for investors if Nvidia’s long-term growth rates were higher than those of the other companies – but in fact, they are losing out even to Alphabet Inc. (GOOG), (GOOGL).
In my opinion, Nvidia’s ongoing rally is a kind of trap for buyers at current stock prices. Based on most existing valuation methods, the stock is overvalued even in the bull case scenario. At the same time, the competition in the AI chips market is only intensifying. As Marketplace reports, Intel is planning to launch a new AI chip this year, Meta wants to use its own custom chip in its data centers, and Google has developed Cloud Tensor Processing Units that can be used to train AI models. That’s why my optimistic forecasts in the DCF model may turn out to be completely wrong at the end of the day.
Where I Can Be Wrong?
My analysis shows the great influence of NVDA on the broader market. However, this influence can also work in the opposite direction, i.e., market sentiment and broader economic factors could drive NVDA’s stock price beyond my expectations. So, any unexpected positive developments in the market or shifts in investor sentiment could drive NVDA’s stock price higher and undermine my bearish thesis today.
I noted above that any breakthroughs or advancements by competitors, such as Intel, Meta, or Google, could erode NVDA’s market share and disrupt its growth trajectory. But what if competitors’ efforts aren’t innovative enough to challenge NVDA’s leading position? In its recent note dedicated to Nvidia, Argus Research analysts wrote (proprietary source) that:
“Nvidia’s expertise, market leadership, and continued investment in new technology puts it several generations ahead of rivals and gives it a sustainable advantage in its markets.”
Therefore, the valuation premium we are seeing today could persist for much longer than the consensus has priced in today.
Seeking Alpha, NVDA, author’s notes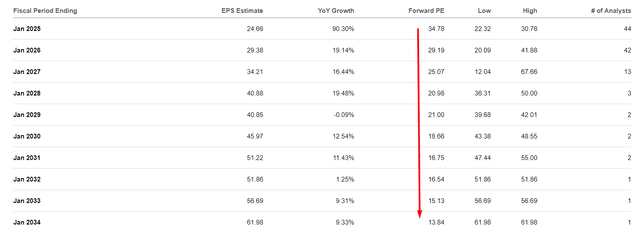
Even though I’ve tried to account for the upside potential by making too-optimistic assumptions in my DCF analysis (in my view), there is a risk that my assumption of a sales growth rate of 15% for the next 5 years, a stable market position and an optimistic EBIT margin may have proved to be actually too low. In addition, the resulting WACC of 11% may be too high. For example, this is the result of the DCF valuation, which is based on a WACC of only 7% and an FCF growth rate of 4% in perpetuity:
FinChat, the model’s output [author’s notes]![FinChat, the model's output [author's notes]](https://static.seekingalpha.com/uploads/2024/3/12/49513514-17102276669627323.png)
The Verdict
Despite the many upside risks to my thesis today, I am inclined to believe that Nvidia Corporation stock is too expensive. I know many of you probably heard those words when the stock was at $200, then $300, $400, and so on. But today there is an objective reality that cannot be ignored. First, this is a parabolic rise in the stock price, which according to market logic should not last forever. At some point, speculators should start to close their positions, and judging by recent market data, that process may have already begun. Secondly, even if we include unrealistically positive forecasts in our DCF model, the stock will be overvalued in most cases. Yes, the model’s final output seems sensitive to adjustments in key assumptions, but even if we look at the COMPs analysis, NVDA’s strong overvaluation is confirmed.
Therefore, I reiterate my previous “Sell” rating on Nvidia Corporation shares today and call for avoiding this growth trap.
Thanks for reading!
Analyst’s Disclosure: I/we have no stock, option or similar derivative position in any of the companies mentioned, and no plans to initiate any such positions within the next 72 hours. I wrote this article myself, and it expresses my own opinions. I am not receiving compensation for it (other than from Seeking Alpha). I have no business relationship with any company whose stock is mentioned in this article.
Seeking Alpha’s Disclosure: Past performance is no guarantee of future results. No recommendation or advice is being given as to whether any investment is suitable for a particular investor. Any views or opinions expressed above may not reflect those of Seeking Alpha as a whole. Seeking Alpha is not a licensed securities dealer, broker or US investment adviser or investment bank. Our analysts are third party authors that include both professional investors and individual investors who may not be licensed or certified by any institute or regulatory body.
Hold On! Can’t find the equity research you’ve been looking for?
Now you can get access to the latest and highest-quality analysis of recent Wall Street buying and selling ideas with just one subscription to Beyond the Wall Investing! There is a free trial and a special discount of 10% for you. Join us today!

