
Summary:
- Nvidia Corporation’s largest segment, Data Center (56% of revenues), has continuously increased its share of cloud infrastructure market capex compared to competitors from 3.4% (2019) to 8.4% (2022).
- We believe this is due to the increasing utilization in data centers compared to CPUs as GPUs are more suited for AI applications which Nvidia is benefitting from.
- We determined Nvidia’s performance advantage in the PC GPU market has allowed it to remain the market leader (82% share) despite relatively higher prices.
- We see their competitive advantage improving as their performance per pricing has consistently increased and is closing the gap with Intel and AMD.
- However, with the price increasing 131% since our previous coverage, we now find the company fairly valued based on DCF valuation, despite the positive outlook.
Justin Sullivan
In this analysis, we present a comprehensive evaluation of Nvidia Corporation (NASDAQ:NVDA), which builds upon our previous coverage of the company. Notably, we observed that its stock price has increased by more than 100% since our last coverage and has exceeded our projected target price of $244.06. Our analysis encompassed an evaluation of Nvidia’s performance in the first half of the current fiscal year, which we compared against our initial forecasts. Additionally, we examined the company’s profitability, which experienced a decline during FY2023. Our investigation aimed to identify the underlying reasons for this trend and assess whether such factors will continue to impact the company’s profitability going forward. Ultimately, we revised our projections and used the discounted cash flow (“DCF”) method to determine whether an upward adjustment to our target price is warranted.
Strong Data Center Competitiveness
|
Nvidia Revenue ($ mln) |
Actual (FY2023) |
Our Forecast (FY2023) |
|
Gaming |
9,067 |
11,324 |
|
Growth % |
-27.2% |
-9.10% |
|
Professional Visualization |
1,544 |
2,236 |
|
Growth % |
-26.9% |
5.90% |
|
Data Center |
15,005 |
12,708 |
|
Growth % |
41.4% |
19.7% |
|
Automotive |
903 |
691 |
|
Growth % |
59.5% |
22.00% |
|
OEM and Other |
455 |
1,162 |
|
Growth % |
-60.8% |
0.00% |
|
Total |
26,974 |
28,120 |
|
Growth % |
0.2% |
4.50% |
Source: Nvidia, Khaveen Investments.
In FY2023, Nvidia’s total revenue had flattish growth of only 0.2% compared to our previous analysis where we forecasted Nvidia’s total growth in FY2023 at 4.5%, thus fairly in line with Nvidia’s actual growth. As expected, we saw Data Center being its key growth driver. However, its actual growth surpassed our estimates by more than double with a growth of 41.4% compared to our forecast of 19.7%.
Despite the stronger-than-expected growth in Data Center, our Gaming segment grew higher than its actual growth, which was -27.2% as Nvidia’s PC GPU revenues declined more than expected. Its smaller segment, Professional Visualization also underperformed compared to our expectations. In contrast, Automotive growth was stronger than expected.
Therefore, despite the weak PC GPU market, Nvidia managed to generate similar revenues to its previous year as its Data Center segment remained a bright spot of growth. We further analyzed below why Nvidia’s DC segment beat our expectations and updated our projections for its Data Center segment growth.
|
Data Center Segment |
Our Forecast |
Actual |
|
Cloud Infrastructure Market Revenues ($ bln) |
248.1 |
227 |
|
Cloud Infrastructure Market Revenue Growth % |
39% |
28% |
|
Data Volume (ZB) |
97 |
110.2 |
|
Data Volume Growth % |
23% |
31% |
|
Cloud Infrastructure Revenue Growth/Data Volume Growth |
1.73 |
0.90 |
|
Total Market Capex (Adjusted) |
209 |
178.5 |
|
Total Market Capex Growth % |
28% |
9% |
|
Market Capex/ Market Revenues |
0.84 |
0.79 |
|
Market Capex/ Market Revenues Growth % |
-8% |
-15% |
|
Nvidia Data Center Share of Capex Spend |
6.5% |
8.4% |
|
Increase |
0% |
1.9% |
|
Nvidia Data Center Revenues |
13.6 |
15.0 |
|
Nvidia Data Center Revenues Growth % |
27.7% |
41.4% |
Source: Company Data, Khaveen Investments.
We compiled our projections for the company’s Data Center segment in the table above. As seen, the cloud infrastructure market’s actual growth in 2022 was below our projections despite higher data volume growth due to a lower Cloud Infrastructure Revenue Growth/Data Volume Growth factor.
Additionally, our estimate of the cloud market capex consisting of the top 4 players such as AWS of Amazon (AMZN), Microsoft (MSFT), Alphabet/Google (GOOG) and Alibaba (BABA) was lower than our forecast in 2022 as the Market Capex/ Market Revenues declined larger than our estimates.
However, Nvidia’s Data Center revenues still outperformed our forecast, as its revenues as a share of data center capex had increased to 8.4% compared to our forecast of 6.5% which we previously assumed based on its prior year’s figure at a constant rate. Thus, this indicates Nvidia’s solid outperformance of our forecast due to its share gains in the data center market. Below, we further examine the possible factors for its share gains.
New Products
|
Data Center Product Release (Calendar Year) |
Count |
|
2021 |
17 |
|
2022 |
13 |
Source: Nvidia, Khaveen Investments
The new product releases for the data center segment saw a slight decline, going from 17 in 2021 to 13 in 2022. Some of the new products that were released in 2022 include IGX platform, Grace CPU Superchip and the H100 GPU.
The IGX platform helps improve performance and safety standards with the use of AI in “sensitive industries such as manufacturing, logistics and healthcare.” The Grace CPU Superchip is an improvement from the Grace Hopper Superchip released in 2021 and it is designed for AI infrastructure with “twice the memory bandwidth and energy-efficiency compared to today’s leading server chips.”
In Q3, Nvidia launched its next-gen data center GPU (H100), its most advanced chip. According to Nvidia, the “H100 revenue was already much higher than that of A100” which the company mentioned highlights its exceptional performance and explained that it is “9x faster than the A100 for training and up 30x faster than [inferencing of] (ph) transformer-based large language models.” In our previous analysis, we determined that the Nvidia H100 chip is superior to that of its top competitor in the data center GPU market which is AMD.
Overall, the decline in the number of product launches indicates that the company’s share gains in the data center market are not due to more product launches compared to the previous year as its product launches declined in 2022. However, we previously determined that the company has a competitive advantage with its superior performance advantage for data center GPUs.
Partnerships
|
Data Center Partnerships (Calendar Year) |
Count |
|
2021 |
4 |
|
2022 |
4 |
Source: Company Data, Khaveen Investments.
The number of new partnerships within the data center segment remained the same, with 4 in 2021 and 4 in 2022. The new partnerships in 2022 were Microsoft, Dell, Deloitte, and Booz Allen Hamilton. Furthermore, the company recently announced this year additional collaborations with top CSP including AWS, Microsoft as well as Oracle (ORCL). According to the company, “on a trailing 4-quarter basis, CSP customers drove about 40% of our Data Center revenue.”
Overall, Nvidia had the same number of data center partnerships in 2022 thus we believe its higher growth than our forecast was not due to it securing additional partnerships.
Increasing Competitiveness Against Data Center Competitors
|
Cloud Providers Capex |
2018 |
2019 |
2020 |
2021 |
2022 |
|
Nvidia Data Center Revenues |
2.9 |
3.0 |
6.7 |
10.6 |
15.0 |
|
Nvidia Data Center Share of Capex Spend |
3.5% |
3.4% |
5.3% |
6.5% |
8.4% |
|
AMD Data Center Revenues |
1.08 |
1.23 |
1.69 |
3.69 |
6.04 |
|
Share of Data Capex Spend |
1.3% |
1.4% |
1.3% |
2.3% |
3.4% |
|
Intel Data Center Revenues |
22.99 |
23.48 |
23.41 |
22.69 |
19.20 |
|
Share of Data Capex Spend |
27.8% |
26.7% |
18.6% |
13.8% |
10.8% |
|
Broadcom Data Center Revenues (Estimate) |
7.19 |
6.60 |
6.56 |
7.75 |
9.81 |
|
Share of Data Capex Spend |
8.7% |
7.5% |
5.2% |
4.7% |
5.5% |
|
Marvell Data Center Revenues |
0.81 |
0.85 |
1.04 |
1.78 |
2.41 |
|
Share of Data Capex Spend |
1.0% |
1.0% |
0.8% |
1.1% |
1.3% |
Source: Company Data, Khaveen Investments.
Based on the table above, we compiled the data center revenues for Nvidia’s top competitors including AMD (AMD), Intel (INTC), Broadcom (AVGO) and Marvell (MRVL), and calculated their revenues as a share of total data center capex.
From the table, Nvidia’s share had increased the most by almost 2% in 2022. The company has been gaining share for the past 5 years. AMD has also increased its share but remains a relatively smaller player compared to Nvidia.
Meanwhile, Broadcom and Marvell both increased through Broadcom’s share had declined until 2021 while Marvell’s share increase was only 0.2% and was relatively stable in the past 4 years before 2022.
On the other hand, Intel’s share had declined continuously and declined the most in 2022 to 10.8%. We believe the reason for the contrasting performance between Nvidia and Intel is that Nvidia focuses on the faster-growing data center GPU market while Intel on CPUs. In our previous analysis, we saw GPUs benefitting from the growth of data centers as we previously concluded “GPUs are better suited than CPUs for handling many of the calculations required by AI and machine learning in enterprise data centers and hyperscaler networks” and thus could provide an opportunity for Nvidia to continue benefiting as the market leader of data center GPUs with a dominating 88% share.
|
Data Center Portfolio |
Nvidia |
AMD |
Intel |
Broadcom |
Marvell |
|
CPU |
Launching FY2024 |
Yes |
Yes |
No |
No |
|
GPU |
Yes |
Yes |
Yes |
No |
No |
|
DPU |
Yes |
Yes |
Yes (‘IPU’) |
Yes |
Yes |
|
Networking Interconnects |
Yes |
No |
Yes |
Yes |
Yes |
|
Software |
Yes |
Yes |
Yes |
Yes |
Yes |
|
Integrated Hardware and Software |
Yes (DGX Cloud) |
N/A |
N/A |
N/A |
N/A |
Source: Company Data, Khaveen Investments.
We summarized the breadth of data center products for Nvidia compared to its competitors. As seen, Nvidia has the most robust portfolio with CPUs launching in 2024, GPUs, DPUs, networking interconnects and software. Furthermore, the company explained that the company remained focused on expanding its software and services.
Moreover, the company also announced its integrated solution for data centers called the Nvidia DGX Cloud which it claims to be “the fastest and easiest way to have your own DGX AI supercomputer.” It highlighted that top CSPs such as Microsoft, Google and Oracle already are adopting its product and expect more CSPs to adopt it in the future. The DXG Cloud is an example of its strong product integration opportunities between its DC portfolios.
Each instance of DGX Cloud features eight NVIDIA H100 or A100 80GB Tensor Core GPUs for a total of 640GB of GPU memory per node. A high-performance, low-latency fabric built with NVIDIA Networking ensures workloads can scale across clusters of interconnected systems, allowing multiple instances to act as one massive GPU to meet the performance requirements of advanced AI training. High-performance storage is integrated into DGX Cloud to provide a complete solution for AI supercomputing. – Nvidia.
Updated Outlook
|
Cloud Providers Capex ($ mln) |
2022 |
2023F |
2024F |
2025F |
2026F |
|
Total Market Capex (Adjusted) |
178.5 |
210 |
256 |
313 |
381 |
|
Total Market Capex Growth % |
9% |
18% |
22% |
22% |
22% |
|
Cloud Infrastructure Services Revenue |
227 |
301 |
413 |
567 |
779 |
|
Cloud Infrastructure Services Revenue Growth % |
28% |
32% |
37% |
37% |
37% |
|
Market Capex/ Market Revenues |
0.8 |
0.70 |
0.62 |
0.55 |
0.49 |
|
Market Capex/ Market Revenues Growth % |
-15% |
-11% |
-11% |
-11% |
-11% |
Source: Company Data, Khaveen Investments.
We updated our revenue projections for Nvidia by first updating our cloud market projections from our previous analysis where we forecasted it to grow by 32% in 2023 based on a Cloud Infrastructure Revenue Growth/Data Volume Growth factor of 1.06x before increasing to 1.22x based on its 5-year average with a growth rate of 37% through 2026.
Additionally, we updated our cloud market capex consisting of AWS, Microsoft, Google and Alibaba based on an updated Market Capex/ Market Revenues factor of 0.7x in 2023 declining by 11% per year based on its 10-year average for a total growth of 22%.
|
Cloud Providers Capex |
2019 |
2020 |
2021 |
2022 |
2023F |
2024F |
2025F |
2026F |
|
Total Market Capex (Adjusted) |
88 |
126 |
164 |
179 |
210 |
256 |
313 |
381 |
|
Total Market Capex Growth % |
6% |
43% |
30% |
9% |
18% |
22% |
22% |
22% |
|
Nvidia Data Center Share of Capex Spend |
3.4% |
5.3% |
6.5% |
8.4% |
10.1% |
11.7% |
13.4% |
15.1% |
|
Increase |
-0.1% |
1.9% |
1.1% |
1.9% |
1.7% |
1.7% |
1.7% |
1.7% |
|
Nvidia Data Center Revenues |
3.0 |
6.7 |
10.6 |
15.0 |
21.2 |
30.1 |
41.9 |
57.5 |
|
Nvidia Data Center Revenues Growth % |
1.8% |
124.5% |
58.5% |
41.4% |
41.0% |
42.2% |
39.3% |
37.2% |
Source: Company Data, Khaveen Investments.
Based on our updated model of Nvidia’s revenue projection for its DC segment, the company’s share of the top cloud capex continued to increase in 2022. We forecast it to continue increasing based on a 3-year average increase of 1.7%. We obtained an updated DC segment growth of 41% for Nvidia which is more in line with its 2022 growth rate. Thus, we revised our growth forecast higher by assuming the company continues to increase its competitiveness in the data center market and gain share resulting in a higher average growth of 40% which is more in line with its 2022 performance.
All in all, we determined Nvidia’s data center growth outperformed our forecast due to its increasing competitiveness in the data center market with its higher share of the total market which we believe was supported by the company’s robust competitive data center portfolio and performance advantage in GPUs. We see Nvidia continuing to gain share with its portfolio breadth and performance advantage as it secures more partnerships and continues had continued to expand its portfolio and forecasted its data center segment to grow by 41% in 2023.
Gaming and Other Revenue Segments
Besides its data center segment, we also examined Nvidia’s Gaming segment, which is significant as it accounted for 33% of revenue. Additionally, we reviewed its Professional Visualization and Automotive segments.
Gaming
|
Nvidia Revenue |
Actual (FY2023) |
Our Forecast (FY2023) |
|
Gaming |
9,067 |
11,324 |
|
Growth % |
-27.2% |
-9.10% |
Source: Nvidia, Khaveen Investments.
In FY2023, Nvidia’s Gaming segment underperformed our forecasts and declined by 27.2% which is below our forecast based on prorated quarterly revenues. However, the company provided positive guidance for its Gaming segment in Q1 FY2023.
Let me look at the outlook for the first quarter of fiscal ’24. We expect sequential growth to be driven by each of our 4 major market platforms led by strong growth in data center and gaming. Revenue is expected to be $6.5 billion, plus or minus 2%. – Colette Kress, EVP & CFO.
GPU Market Share
JPR, Khaveen Investments
Based on the GPU market share chart, Nvidia had strengthened its dominating lead in the GPU market against AMD and Intel with an average share of 82% in 2022. However, in Q4 2022, Nvidia lost share while Intel gained share following the release of its new mid-range GPUs whereas AMD’s share remained stable. Compared to 2021, Nvidia’s average market share in 2022 is roughly in line with the previous year at 81.3%. Thus, the company’s firm dominance over the GPU market had been maintained and was not the factor for its poor performance in 2022.
Shipments and Pricing
|
Nvidia Gaming GPU Forecast |
2021 |
2022 |
|
Total PC Discrete GPU Market Shipments (‘mln’) |
138.0 |
71.3 |
|
Growth % |
-48.33% |
|
|
Nvidia Market Share |
81.3% |
82.0% |
|
Nvidia Shipments (‘mln’) |
112.1 |
58.5 |
|
Growth % |
-48% |
|
|
Nvidia Average PC GPU Price ($) |
111.14 |
155.07 |
|
Growth % |
40% |
|
|
Nvidia PC GPU Revenue ($ mln) |
12,462 |
9,067 |
|
Growth % |
-27.2% |
Source: JPR, Khaveen Investments.
We further examine the company’s GPU segment by compiling the market share, unit shipments and average pricing to determine which factor led to its decline. Based on the table, the company’s shipments declined heavily at -48% in 2022 which is in line with the overall market shipment growth rate of -48.33%. However, its average pricing was positive and provided some cushion to the decline in revenues as it increased by 40%. Thus, the decline in its GPU revenues in 2022 was mainly due to the poor GPU market which contracted significantly. Compared to our forecast, the larger-than-expected decline is due to the worse-than-anticipated performance in H2 2022. According to JPR, the GPU market declined by 40.1% in H2 compared to H1 in terms of shipments. This is as the PC market sales continued to decline in H2 2022.
PassMark, Company Data, Khaveen Investments PassMark, Company Data, Khaveen Investments PassMark, Company Data, Khaveen Investments

|
AMD Desktop GPU Performance |
2020 Gen |
2022 Gen |
Average |
|
AMD Growth % |
52.4% |
52.8% |
52.6% |
|
Nvidia Desktop GPU Performance |
2020 Gen |
2022 Gen |
|
|
Nvidia Growth % |
27.0% |
53.9% |
40.5% |
|
AMD Desktop GPU Price |
2020 Gen |
2022 Gen |
Average |
|
AMD Growth % |
90.5% |
79.5% |
85.0% |
|
Nvidia Desktop GPU Price |
2020 Gen |
2022 Gen |
|
|
Nvidia Growth % |
4.5% |
42.5% |
23.5% |
|
AMD Desktop Performance Per Price |
2020 Gen |
2022 Gen |
Average |
|
AMD Growth % |
-20.0% |
-14.9% |
-17.4% |
|
Nvidia Desktop Performance Per Price |
2020 Gen |
2022 Gen |
|
|
Nvidia Growth % |
21.5% |
8.0% |
14.8% |
Source: PassMark, Company Data, Khaveen Investments.
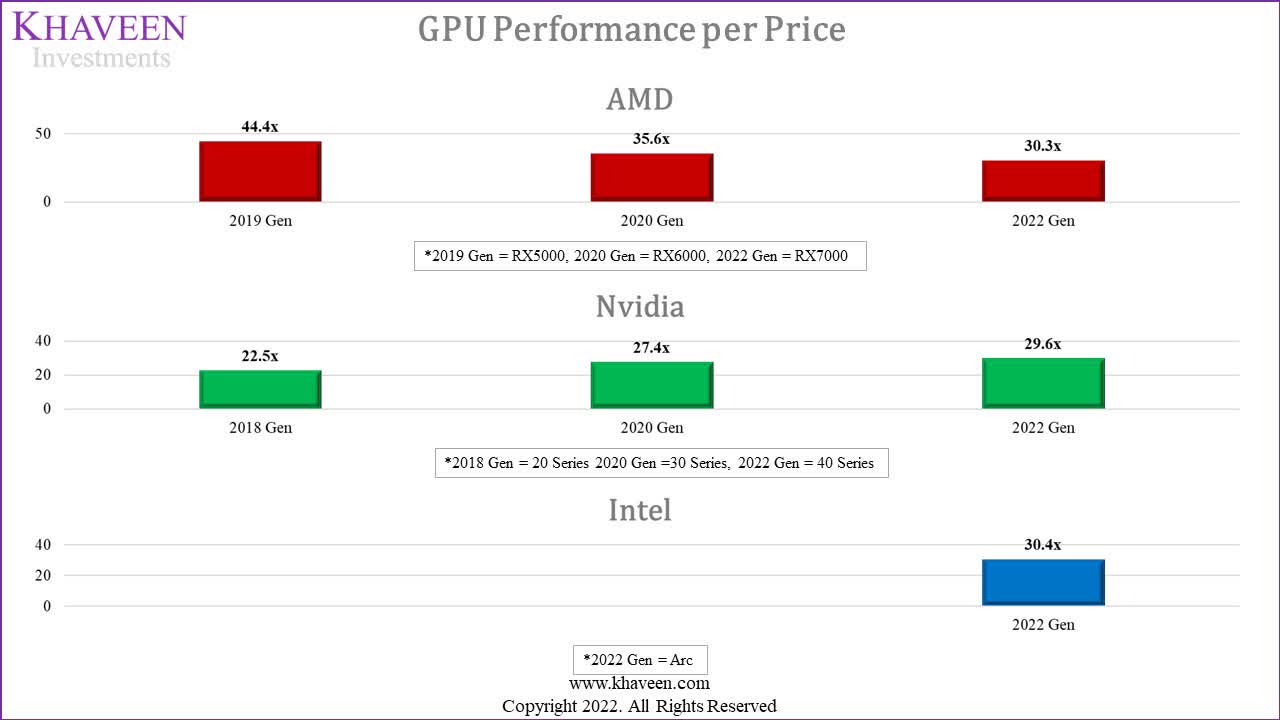
We updated our analysis of the company’s GPU products against competitors such as AMD and Intel from our previous analysis following the launch of its RTX40 series. According to the company, “gamers are responding enthusiastically to the new RTX4090, 4080, 4070 Ti desktop GPUs, with many retail and online outlets quickly selling out of stock.”
Based on the table, Nvidia’s average performance growth for its latest-gen GPUs is a high 54% while its average pricing is higher by 43%. Its value as measured by performance per pricing increased as a result of lower pricing growth to performance growth at 8%. Overall, the company maintained its position with a superior performance advantage over AMD and Intel. However, AMD and Intel’s performance per pricing for its latest gen is slightly higher compared to Nvidia. That said, AMD’s performance per pricing had declined for each generation by 17% on average which is in contrast to Nvidia at a growth of 15%. Thus, we believe this highlights another advantage for Nvidia by increasing its value.
Projections
We projected the company’s Gaming segment assuming Nvidia to gain share of the GPU market with its increasing value advantage over competitors based on an average factor of 1.22x. In terms of pricing, we based it on its past 2-generation average in 2023 of 23% but tapered down by 5% per year as a conservative estimate. We assumed market shipments to continue declining as we forecast the PC market shipments to further contract in 2023 by -11.7% which we derived from our analysis on Intel.
|
Nvidia Gaming GPU Forecast |
2021 |
2022 |
2023F |
2024F |
2025F |
2026F |
|
Total PC Discrete GPU Market Shipments (‘mln’) |
138.0 |
71.3 |
63.0 |
65.4 |
67.8 |
70.4 |
|
Growth % |
-48.33% |
-11.70% |
3.80% |
3.80% |
3.80% |
|
|
Nvidia Market Share |
81.3% |
82.0% |
83.9% |
84.6% |
85.3% |
86.0% |
|
Nvidia Shipments (‘mln’) |
112.1 |
58.5 |
52.85 |
55.29 |
57.85 |
60.53 |
|
Growth % |
-48% |
-9.6% |
4.6% |
4.6% |
4.6% |
|
|
Nvidia Average PC GPU Price |
111.14 |
155.07 |
191.5 |
226.9 |
257.6 |
285.1 |
|
Growth % |
40% |
23% |
18% |
13% |
11% |
|
|
Nvidia PC GPU Revenue ($ mln) |
12,462 |
9,067 |
10,121 |
12,548 |
14,901 |
17,258 |
|
Growth % |
-27.2% |
11.6% |
24.0% |
18.7% |
15.8% |
Source: JPR, Khaveen Investments.
Overall, we expect its growth at 11.6% but mainly supported by pricing growth as we conservatively assume the GPU market to remain impacted in 2023 with the poor PC market outlook. Still, this is better than its performance in 2022 and in line with management’s guidance of positive growth for GPUs for the next quarter.
Professional Visualization
Based on its annual report, the company’s Professional Visualization revenue growth was down at -27% “reflecting a lower sell-in to partners to help reduce channel inventory levels.” This segment includes NVIDIA Omniverse which is “a virtual world simulation and collaboration platform for 3D workflows.” In Q3 2022, the company launched its first NVIDIA Omniverse Cloud which is a “suite of cloud services for artists, developers and enterprise teams to design, publish, operate and experience metaverse applications anywhere.” Overall, although the company’s lower sales in FY2023 reflected lower channel inventory levels, we expect the segment to face headwinds as we see the GPU market shipments continue to decline this year before recovering in FY2025 and beyond. Notwithstanding, we expect the segment’s growth to be supported by drivers such as its new Omniverse services for metaverse applications which have a market forecast CAGR of 47% by MarketsandMarkets.
Automotive
Moreover, its automotive revenue increased by 60%,
reflecting growth in sales of self-driving solutions, computing solutions for electric vehicle makers and strength in sales of AI cockpit solutions. The increase also included growth in automotive development arrangements.
In 2022, Nvidia introduced its next-gen NVIDIA DRIVE Thor ADAS chip. The company claims it
achieves up to 2,000 teraflops of performance, unifies intelligent functions — including automated and assisted driving, parking, driver and occupant monitoring, digital instrument cluster, in-vehicle infotainment (IVI) and rear-seat entertainment.
The advantage of the “Multi-Domain Computing” is highlighted by Nvidia as the chip is a centralized compute system which handles multiple ADAS functionalities concurrently rather than traditionally relying on multiple ECUs. Thus, we believe the integration capabilities of the new chip provide improved efficiency for ADAS manufacturers and enable Nvidia to benefit from the AV market which was projected at 31.3% in our analysis on Mobileye (MBLY).
Outlook
All in all, while we see the company’s Gaming segment continue to face headwinds in the GPU market which slumped in 2022, we expect a recovery for the segment to a positive rate of 11.6% supported by pricing increase. This is significant as Gaming is 33% of revenue. Moreover, we see its Professional Visualization segment also faces headwinds in the GPU market but expect a better outlook in FY2024 for its GPU sales as well as drivers such as its metaverse. Finally, we see its Automotive segment’s rapid growth outlook supported by high ADAS market growth and increased efficiency of its next-gen chips.
Impact on Profitability of Nvidia Likely Limited
Lower Gross Profit Margins Due to Inventory Impact
|
Nvidia Profitability |
Actual (FY2023) |
Our Forecast (FY2023) |
|
Gross Margins |
56.93% |
64.91% |
|
Operating Margins |
20.68% |
41.80% |
|
Net Margins |
16.19% |
41.85% |
|
FCF Margins |
48.26% |
44.99% |
|
Capex ($ bln) |
0.976 |
1.23 |
Source: Nvidia, Khaveen Investments.
In FY 2023, Nvidia, gross margins declined to 56.93% compared to our forecasted gross margin of 64.9%. According to the company’s annual report, the decrease in gross margins was due to inventory provisions of $2.17 bln ($1.04 bln inventory on hand and $1.13 bln inventory purchase obligations).
The company highlighted that the inventory provisions impacted its gross margins by 7.5% in FY2023. Inventory provisions as explained by the company’s annual report occur when supply commitments are mismatched with its demand, as its…
…supply, which includes inventory on hand, purchase obligations and prepaid supply agreements, has grown significantly due to current supply chain conditions, complexity of our products, and recent reductions in demand. – Nvidia Annual Report.
Thus, as the company’s inventory provisions are due to misalignment with demand, we believe the high impact of the inventory provision on its gross margins of 7.5% was due to the slump in the GPU market as its shipments fell by 48% in FY2023. Looking ahead, we do not expect the impact from inventory provision on the company’s gross margins to be recurring every year as we do not expect the GPU market to decline significantly to the scale of FY2023 but could see some impact in FY2024 if the market deteriorates worse than expected. Overall, we see its margins improving going forward and projected it to increase to 65.2% based on its 3-year average COGS % of sales (excluding the 7.5% impact in FY2023) for FY2024. This is also in line with management guidance for gross margins to be between 64.1% and 66.5%. Beyond FY2024, we forecasted the company’s gross margins to increase to 69% by FY2028 based on its 10-year average (excluding FY2023) decrease in COGS % of revenue of 2.9%.
Financial Analysis
Additionally, the company’s operating profits were significantly lower than our forecast. Thus, we conducted a financial analysis to identify the operating expenses for Nvidia and whether they have increased, which contributed to its lower margins.
Nvidia, Khaveen Investments
Based on our expense analysis, the company’s R&D expenses had risen since 2018 following a decreasing trend and stabilized above 20% and represented its largest operating expense.
|
Nvidia Profitability (% of Revenue) |
Actual (FY2023) |
Our Forecast (FY2023) |
|
Depreciation & Amortization |
5.72% |
8.03% |
|
Research and development |
27.21% |
15.06% |
|
Selling, general and administrative |
9.05% |
8.05% |
|
Other Expenses (Income) |
0.00% |
0.00% |
|
Interest |
0.02% |
-0.59% |
Source: Nvidia, Khaveen Investments.
Based on the table, the company’s operating expenses show its R&D increased more than our forecast. However, SG&A expenses were in line with our forecasts. According to Nvidia’s annual report…
…the increase in research and development expense for fiscal year 2023 was primarily driven by increased compensation, employee growth, engineering development costs, and data center infrastructure” – Nvidia Annual Report.
|
R&D Expense |
Increase |
|
Stock-Based Compensation (Compensation) |
46% |
|
Headcount (Employee Growth) |
16.5% |
|
Patent Publications (Engineering development costs) |
63% |
|
PPE Capex (Data center infrastructure) |
100% |
Source: Nvidia, Global Data, MacroTrends, Khaveen Investments.
To identify the exact factors that caused its increase in R&D, we compiled the % increase for each of the components as seen in the table above.
Its stock-based compensation related to R&D had increased by 46% in FY2023 and represented 26% of its total R&D expense, which we believe makes it one of the primary contributors to its expense growth in FY2023. However, we believe the growth in the company’s stock-based compensation is not unusual as the company’s total stock-based compensation has grown at a 5-year average of 47%.
The company’s number of employees increased by 16.5% in the past year which was actually lower compared to the previous year when it increased its employee headcount by 18.4%. Thus, this indicates it is not the primary factor. While we expect the company to continue increasing its headcount to support its growth, we assume its employee growth not to be a significant factor in its R&D growth.
In terms of patents, the company’s number of total patent publications had increased substantially by 63% in the past year and had reached its highest ever which reflects the company’s commitment to product development to expand its portfolio. Thus, we believe this could indicate its higher engineering development costs, which could have resulted in higher R&D expenses, and we believe is one of the primary factors for its large increase in R&D expenses in FY2023. However, we expect the company’s engineering development costs not to increase significantly this year as the company’s annualized number of patent publications from GlobalData until March is lower than last year’s total by 8%.
Moreover, the company’s capex increased by 100% to $1.8 bln from $0.9 bln in the prior year, which could indicate an expansion of its data center infrastructure and contribute to higher operating costs for the company. Thus, we believe this could also be a primary factor for the increase in R&D expenses in FY2023. Going forward, we do not the company’s data center infrastructure costs to increase significantly as we projected the company’s capex to decrease to $1.2 bln in FY2024 based on the midpoint of management guidance and at a constant assumption of $1.5 bln per year beyond FY2024.
Overall, we believe the primary factors which led to the strong growth of Nvidia’s R&D expenses were its compensation, engineering development costs and data center infrastructure. However, we believe the company’s strong rise in R&D growth in FY2023 to not continue in FY2024 as its stock-based compensation is below its 5-year average, we expect its number of patent publications to decline in FY2023 based on annualized figures and we projected its capex this year to be below FY2023. We then updated our model to project the company’s R&D expenses based on an R&D % Revenue Growth/Revenue Growth Factor.
|
Nvidia R&D % of Revenue Forecasts ($ mln) |
2021 |
2022 |
2023F |
2024F |
2025F |
2026F |
2027F |
|
Revenue |
26,914 |
26,974 |
34,708 |
46,958 |
62,209 |
78,373 |
94,663 |
|
Revenue Growth |
61.4% |
0.2% |
28.7% |
35.3% |
32.5% |
26.0% |
20.8% |
|
R&D % of revenue |
19.6% |
27.2% |
24.9% |
22.4% |
20.3% |
18.7% |
17.6% |
|
R&D % of revenue Growth |
-16.8% |
39.0% |
-8.35% |
-10.28% |
-9.46% |
-7.57% |
-6.06% |
|
R&D % revenue Growth/Revenue Growth Factor |
-0.27 |
174.95 |
-0.29 |
-0.29 |
-0.29 |
-0.29 |
-0.29 |
Source: Nvidia, Khaveen Investments.
We obtained an average R&D % Revenue Growth/Revenue Growth Factor excluding periods of negative and flattish growth by dividing the average R&D % of revenue growth by the revenue growth during the periods which is a factor of -0.29x. Based on our revenue forecasts, we derived our R&D % of revenue estimates in 2023 at 24.9% and decrease to 17.6% by 2027.
Moreover, we updated our forecasts of the company’s SG&A % of revenue to decrease based on its average decline of -0.2% in the past 10 years, thus we forecasted its SG&A % revenue at 9.05% in FY2024 and decrease to 8.96% by FY2028.
Nvidia, Khaveen Investments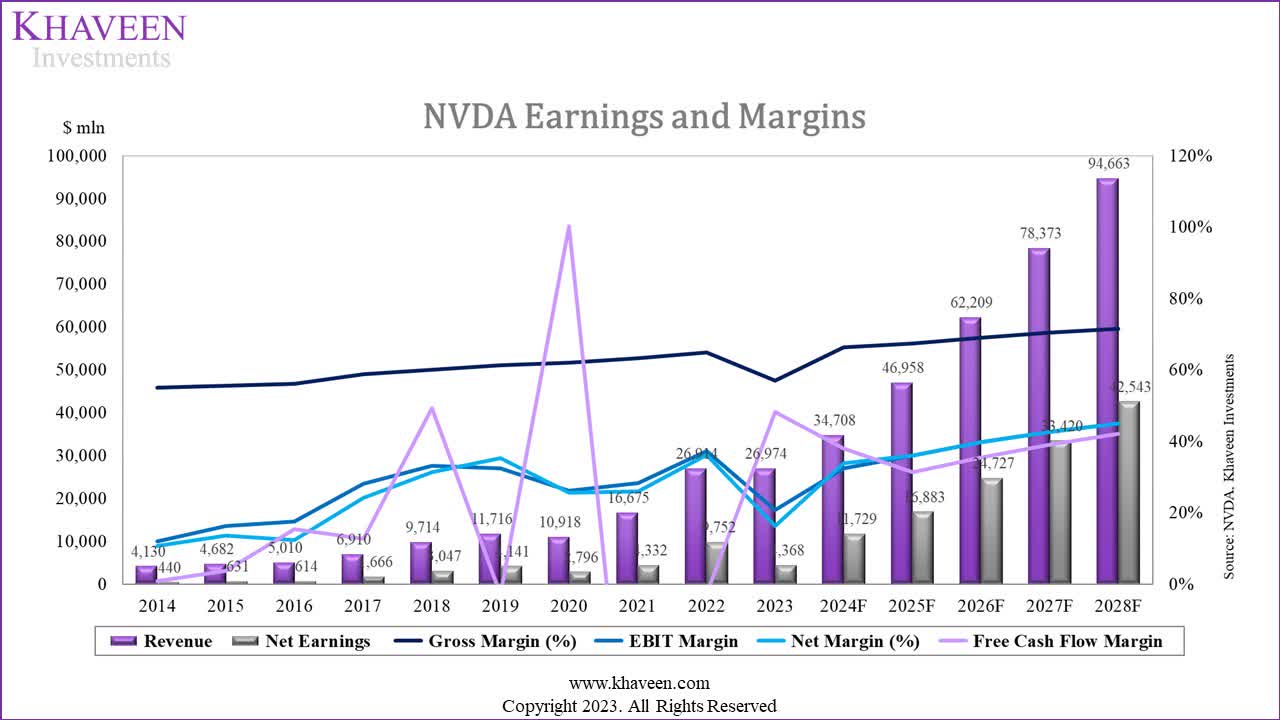
Overall, we forecasted its net margins to continue increasing through 2028 from 33.8% to 44.94% by FY2028. Compared to our previous analysis, our updated margins are more conservative as they are lower than our previous forecasts as we previously assumed more aggressive margin growth assumptions for the company through lower R&D expenses % of revenue.
FCF Margins
|
Nvidia Profitability |
Actual (FY2023) |
Our Forecast (FY2023) |
|
FCF Margins |
48.26% |
44.99% |
|
Capex ($ bln) |
1.8 |
1.23 |
|
Capex as % of Revenue |
6.8% |
4.4% |
|
Capex as % of Fixed Assets |
10.1% |
8% |
|
Investing Cash Flow ($ bln) |
-7.375 |
1.23 |
Source: Nvidia, Khaveen Investments.
Despite the lower margins, the company’s FCF margins increased in FY2023 and surpassed our forecast. In terms of PPE capex, the company’s actual capex was $1.8 bln, which is fairly in line with our forecast of $1.23 bln. However, the company recorded proceeds from the sale of investible market securities valued at $9,257 mln in FY2023, contributing to an inflow of investing cash flow, thus leading to higher FCFs for the year. Excluding the proceeds, the company’s FCF margins would have been lower (14.1%), impacted by lower profit margins from inventory adjustments and higher R&D costs.
Nvidia, Khaveen Investments
We updated our capex forecast based on management guidance at a midpoint of $1.2 bln in FY2024. Beyond that, we forecast its capex based on its 3-year average capex as % of fixed assets of 8.4%. We chose to use capex % of fixed assets to forecast Nvidia’s capex as the company is a fabless chipmaker and does not incur capex to increase its production capacity to support its revenue growth as it outsources production to foundries instead. Therefore, as seen from the chart, the company’s operating cash flows increased consistently and rapidly except in FY2023, but its capex had not risen as much.
All in all, we modeled the company’s FCF margins to increase to 42% by FY2028 supported by rising gross margins as we the impact from inventory provisions limited to only FY2023 and we forecasted its operating expenses lower as we do not expect its R&D % of revenue to gradually decline following the anomalous increase in FY2023.
Risk: Weaker Than Expected GPU Market
One of the risks that could affect the company is if the GPU market is weaker than we anticipated in 2023. In our second point, we based our forecast of the GPU shipments to decline on our projections for the PC market at -11.7%. In 2022, the PC declined by 11% but the GPU market was impacted to a greater extent with a total market shipment decline of 48%. Within PCs, Nvidia focuses on dedicated GPUs which are not always included within the PC systems. This is because PCs can operate fine without dedicated GPUs. Cost-conscious consumers might opt for lower-end PCs without expensive and powerful dedicated GPUs but instead rely on integrated GPUs for lower-end models which affects Nvidia as the company only serves the dedicated GPU market. Thus, a weaker-than-expected GPU market would affect Nvidia’s growth outlook as its Gaming segment is the second largest and represented 34% of revenue.
Valuation
We updated our revenue projections from previous analyses with our updated segment growth forecasts with our projections for its Data Center and Gaming segments below. For its Professional Visualization segment, we based our forecast on our Gaming segment growth rate. Moreover, we based its automotive segment on the ADAS chip market forecast CAGR of 38.1%.
|
Nvidia Revenue Forecasts ($ mln) |
2020 |
2021 |
2022 |
2023F |
2024F |
2025F |
|
Gaming |
7,759 |
12,462 |
9,067 |
10,121 |
12,548 |
14,901 |
|
Growth % |
40.6% |
60.6% |
-27.2% |
11.6% |
24.0% |
18.7% |
|
Professional Visualization |
1,053 |
2,111 |
1,544 |
1,724 |
2,137 |
2,537 |
|
Growth % |
-13.1% |
100.5% |
-26.9% |
11.6% |
24.0% |
18.7% |
|
Data Center |
6,696 |
10,613 |
15,005 |
21,161 |
30,096 |
41,938 |
|
Growth % |
124.5% |
58.5% |
41.4% |
41.0% |
42.2% |
39.3% |
|
Automotive |
536 |
566 |
903 |
1,247 |
1,722 |
2,378 |
|
Growth % |
-23.4% |
5.6% |
59.5% |
38.1% |
38.1% |
38.1% |
|
OEM and Other |
631 |
1,162 |
455 |
455 |
455 |
455 |
|
Growth % |
25.0% |
84.2% |
-60.8% |
0.0% |
0.0% |
0.0% |
|
Total |
16,675 |
26,914 |
26,974 |
34,708 |
46,958 |
62,209 |
|
Growth % |
53% |
61.4% |
0.2% |
28.7% |
35.3% |
32.5% |
Source: Nvidia, Khaveen Investments.
Seeking Alpha, Khaveen Investments
For the terminal value for the valuation, we used the average U.S. chipmaker EV/EBITDA of 23.68x. Based on the chart, Nvidia has the highest multiple at 99.1x, well above the average chipmakers.
Khaveen Investments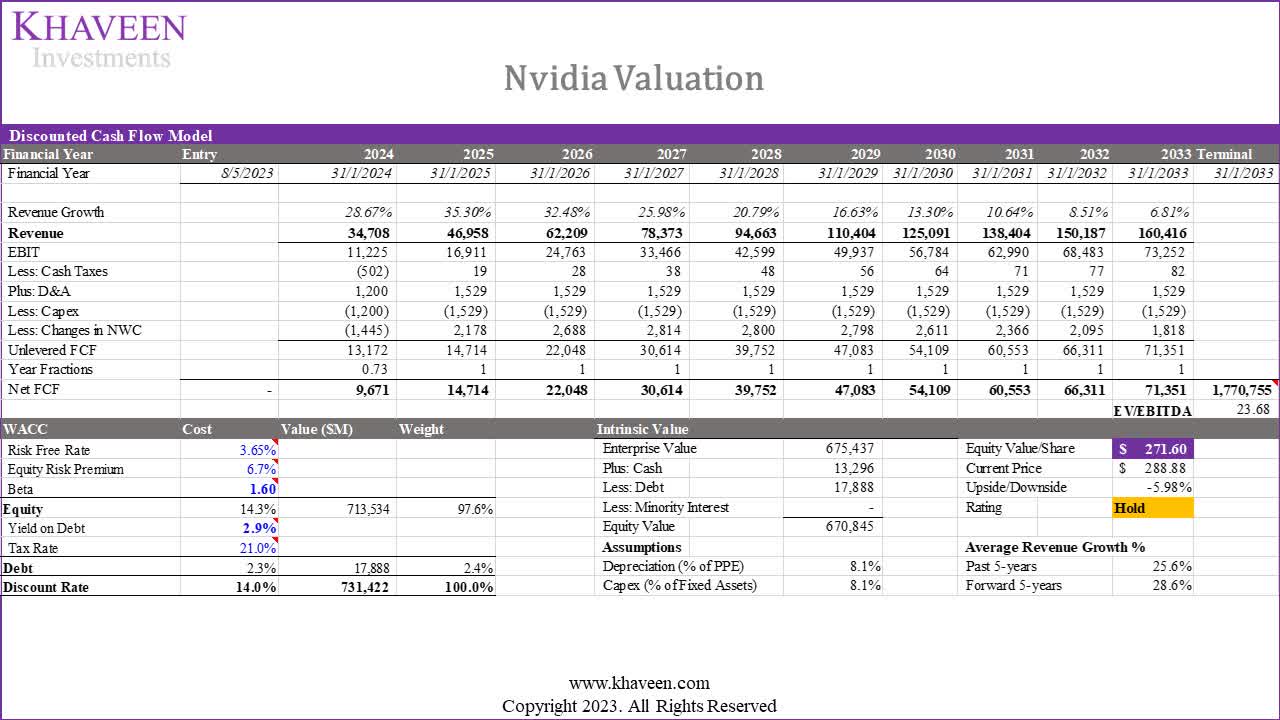
We obtained a higher valuation despite a higher discount rate (14% compared to 12.2% previously) with a higher EV/EBITDA average for the terminal value of 23.68x compared to 12x previously. Also, our previous valuation factored in more aggressive margin growth compared to our updated model with 42% by FY 2028.
Verdict
Nvidia Corporation’s data center segment has surpassed our initial forecast due to its competitiveness and growing market share, driven by its robust data center portfolio and superior GPU performance. Based on these factors, we anticipate that Nvidia will continue to expand its share and project a 41% growth rate for its data center segment in 2023. Although the Gaming and Professional Visualization segments are facing challenges in the GPU market, we anticipate a positive recovery for Gaming and a better outlook for Professional Visualization in FY2024. Furthermore, the Automotive segment demonstrates rapid growth potential, driven by the high growth rate of the ADAS market and increased efficiency of its next-generation chips.
Our free cash flow (“FCF”) margin model predicts a rise to 42% by FY2028, supported by growing gross margins and lower operating expenses, as we expect a gradual decline in R&D expenses after the anomalous increase observed in FY2023. Following a reassessment of Nvidia Corporation’s outlook, we have a higher target price of $271.60. Given that Nvidia Corporation has reached our target price, having increased by 131.33% since our previous coverage, we have revised our rating for the company to Hold, and believe that Nvidia Corporation stock is currently fairly valued at its prevailing price.
Editor’s Note: This article discusses one or more securities that do not trade on a major U.S. exchange. Please be aware of the risks associated with these stocks.
Analyst’s Disclosure: I/we have a beneficial long position in the shares of NVDA either through stock ownership, options, or other derivatives. I wrote this article myself, and it expresses my own opinions. I am not receiving compensation for it (other than from Seeking Alpha). I have no business relationship with any company whose stock is mentioned in this article.
No information in this publication is intended as investment, tax, accounting, or legal advice, or as an offer/solicitation to sell or buy. Material provided in this publication is for educational purposes only, and was prepared from sources and data believed to be reliable, but we do not guarantee its accuracy or completeness.
Seeking Alpha’s Disclosure: Past performance is no guarantee of future results. No recommendation or advice is being given as to whether any investment is suitable for a particular investor. Any views or opinions expressed above may not reflect those of Seeking Alpha as a whole. Seeking Alpha is not a licensed securities dealer, broker or US investment adviser or investment bank. Our analysts are third party authors that include both professional investors and individual investors who may not be licensed or certified by any institute or regulatory body.