Summary:
- I’m even more convinced that the optimism around the Nvidia Corporation stock is overdone right now.
- The combination of RSI and stochastic moves on the weekly chart suggests that NVDA’s buyers have most likely started selling into strength.
- There are 2 options for Nvidia stock to close the gap between the moving averages – both imply losses for those who wanted to buy the stock at its current prices.
- On the daily chart, there’s an RSI divergence, which should theoretically set the stage for an imminent correction.
- Despite the likely correction in the short-term, the catalyst in the form of GPT mania that Nvidia received in 2023 is quite impressive. So, I reiterate my previous Hold rating on Nvidia Corporation stock.
zsv3207/iStock via Getty Images
My Thesis
I wrote earlier last month that despite all the positive news surrounding the company regarding revolutionary GPT, Nvidia Corporation (NASDAQ:NVDA) stock was too hot to touch. Although NVDA stock is up 5.6% since my article was published, I’m even more convinced that the optimism around the stock is overdone right now and that NVDA may suddenly sell off as its technical picture looks quite fragile.
Why Do I Think So?
Right at the beginning, I want to warn you: I’m not an expert in technical analysis. Without a CMT certification, I’m just trying to describe what I see on the chart in the context of similar constellations in the past that have meant trouble for NVDA stock in both uptrends and downtrends.
In my perspective, it’s abundantly clear that the NVDA stock has regained its robust upward momentum, thereby propelling the stock price to greater local heights despite its lofty valuation ratios. It follows a logical course of action – amid the prevailing GPT craze, the company’s prospective growth expansion seems to justify its lush valuation. However, looking at the classic technical indicators such as stochastics and RSI, we can see that the optimistic sentiment has peaked. This traditionally indicates a potential for profit-taking activity, regardless of the current trend’s direction:
TrendSpider Software, author’s notes
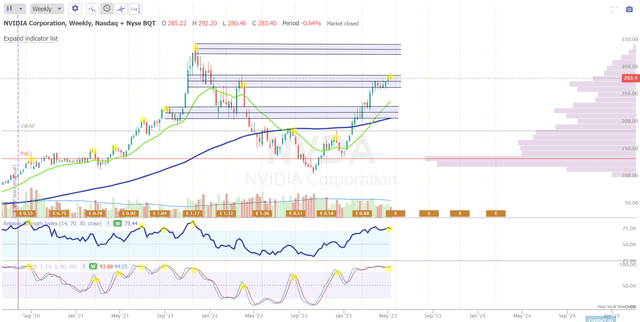
In the weekly chart above, I’ve marked 3 resistance zones that are likely to attract NVDA stock going forward – the company’s upcoming quarterly report, scheduled for May 24 [after-hours], may act as a catalyst for this attraction.
The combination of RSI and stochastic spikes against this backdrop suggests that NVDA buyers have most likely started selling on rips [the opposite of buying on dips], or as it’s also called, selling into strength.
Another point you should pay attention to is the growing risk of a mean reversion. As you can see on the weekly chart, NVDA stock is far off its 100-week simple moving average [blue line] – even the 20-week exponential moving average [green line] is ~15% below the last close. To close this gap, there are theoretically only 2 scenarios: 1) entering a consolidation and 2) a steep decline. Moreover, in the context of weekly changes, both options imply losses for those who wanted to buy NVDA stock at its current levels:
- NVDA enters consolidation on the weekly chart, as in August 2020: the price remains unchanged for 7 months, while volatility increases throughout the period;
- NVDA starts a correction directly to the 100-week line MA like in February 2020: the price falls by 30% in 4 weeks and only after that it bounces and starts to recover.
I’m specifically using February/ August of 2020 as analogy times when NVDA stock was in an uptrend and the RSI and stochastics had conditions similar to today. This is especially true for the stochastics indicator, which has refused to go down for almost 3 months.
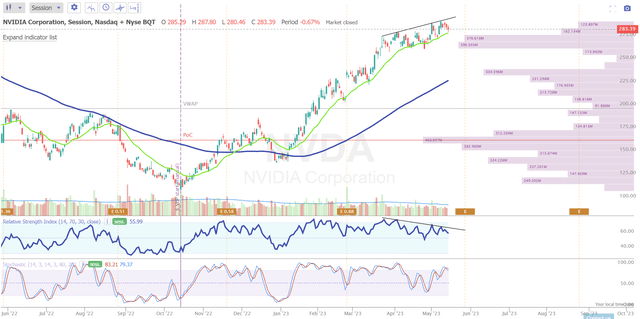
Let’s now take a look at a shorter time frame – the daily chart:
TrendSpider Software, author’s notes
As I see here, the rather alarming technical picture for NVDA doesn’t change – there’s an RSI divergence, while the NVDA stock price continues to rise and reach new local highs on falling RSI, which should theoretically set the stage for an imminent correction.
In the same time frame, you can see how NVDA has already managed to break through the support of its uptrend line – this happened against the backdrop of a rather large volume, which could mean a massive downward movement afterward.
TrendSpider Software [May 12, 2023]![TrendSpider Software [May 12, 2023]](https://static.seekingalpha.com/uploads/2023/5/15/49513514-16841329243449576.png)
Unlike standard volume bar charts, the Raindrop Charts you see above provide insights into where the trading activity occurred during a candle. In NVDA’s case, much of the total trading volume on May 12 fell right on the trendline’s exit zone – a bad sign for those looking to pick up the stock on its slight dip.
Why It’s Not A Sell Then?
As you may have noticed, despite the bearish sentiment, this article is rated as a “Hold,” as in my previous article, and not a “Sell.” Why is that?
There are two main reasons:
1) This article is based on the findings of my technical analysis, which may be interpreted differently by different people. Since I’m not an expert in this field, I can be wrong with my conclusions and misinterpret what I see;
2) The catalyst in the form of GPT mania that NVDA received in 2023 is quite impressive. I’m positive about the impact on chip demand in the foreseeable future – NVDA could easily grow out of its 62.5x price-to-earnings ratio [non-GAAP one].
However, it’ll take some time for my second reason to come to fruition. In my opinion, Nvidia Corporation stock has already priced in way more than it should have done – corrections and consolidations are necessary for supply and demand in the market to come into balance. Currently, the buyers dominate [the demand side is super-strong], but there are already some signs – which I described in today’s article – that point to a very likely shift toward supply-side strength.
Thank you for reading! Please, let me know what you think in the comment section below!
Analyst’s Disclosure: I/we have no stock, option or similar derivative position in any of the companies mentioned, and no plans to initiate any such positions within the next 72 hours. I wrote this article myself, and it expresses my own opinions. I am not receiving compensation for it (other than from Seeking Alpha). I have no business relationship with any company whose stock is mentioned in this article.
Seeking Alpha’s Disclosure: Past performance is no guarantee of future results. No recommendation or advice is being given as to whether any investment is suitable for a particular investor. Any views or opinions expressed above may not reflect those of Seeking Alpha as a whole. Seeking Alpha is not a licensed securities dealer, broker or US investment adviser or investment bank. Our analysts are third party authors that include both professional investors and individual investors who may not be licensed or certified by any institute or regulatory body.
Struggle to navigate the stock market environment?
Keep your finger on the pulse and have access to the latest and highest-quality analysis of what Wall Street is buying/selling with just one subscription to Beyond the Wall Investing! Now there is a free trial and a special discount of 10% – hurry up!
