Summary:
- Nvidia Corporation currently leads in market capitalization, followed by Microsoft and Apple.
- Nvidia has the highest potential for growth over the next five years, potentially doubling in value and surpassing Microsoft and Apple in market cap.
- Using a conservative multiple of 25X, I am setting Nvidia’s five-year target price to $262.
Sportlibrary/iStock via Getty Images
Apple (AAPL) has been around for 44 years.
Microsoft (MSFT) has been around for 38 years.
Nvidia Corporation (NASDAQ:NVDA) has been around for “just” 25 years.
We’re witnessing a real horse race in the Silicon Valley Derby these days as to who is the biggest by market capitalization. On any given day, it is one of the following mega-cap stocks: Microsoft, Apple, or Nvidia.
Performance History
Microsoft began trading on March 13, 1986, at a split adjusted price of $0.06 per share. It closed Monday, June 17th at $448.37 per share. That works out to a total gain of 747,283%. The compound annual return for Microsoft over those 38 years has been 26.5% per year.
Apple began trading on December 12, 1980, at a split adjusted price of $0.10 per share. As of June 18, 2024, it is trading at $212.49 per share. That works out to a total gain of 216,670%. Its compound annual rate of return has been 19.01% per year. Apple has had six more years as a publicly traded company than Microsoft, but still falls well short of Microsoft’s overall gain.
By contrast, Nvidia is a relatively young company with a beginning date of January 22, 1999. Nineteen years younger than Apple and 13 younger than Microsoft. Nvidia began trading at a split adjusted $0.04 per share. As of June 18, 2024, it is trading at $131.88 per share.
That works out to an overall gain of 329,700.00%. This is about one-half of Microsoft’s overall gain, but more than 50% better than Apple. This works out to an annual average return of 38.2% per year. Keep in mind that Nvidia has only been public for 25 years, vs. Apple’s 44 years.
In August 2023, I named Nvidia the best stock in the market in an article titled, “Nvidia Remains The Best Stock in the Market Now.” Again in February 2024, I reiterated that call in the second article I wrote titled, “Is Nvidia Still The Best Stock In The Market Now?“
Now we are in the middle of June 2024. Where does Nvidia stand? Is it still a Best Stock Now?
Before we dive in, let’s go back to my comparison. Which of the three companies, previously mentioned, is the biggest by market capitalization? It depends on the day, making it a compelling three-horse race.
Current Standings
Here are the current standings as of Tuesday’s (June 18, 2024) close:
#1: Nvidia ($3.335 trillion)
#2 Microsoft ($3.317 trillion)
#3: Apple ($3.286 trillion)
Source: Yahoo Finance.
You might want to box your trifecta for now, as the order keeps changing.
Now let’s look at the alpha that these stocks have delivered over the last one, three, five, and 10 years.
Performance Grades
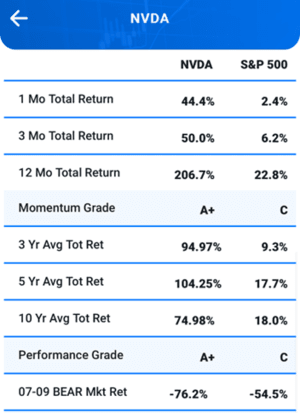
Nvidia is currently the top alpha deliverer in the entire market. Just look at those one, three, five, and 10 year returns vs. the S&P 500 (SP500)! It sits at the top of the class with an overall performance grade of A+. It also has a momentum grade of A+.
Best Stocks Now App
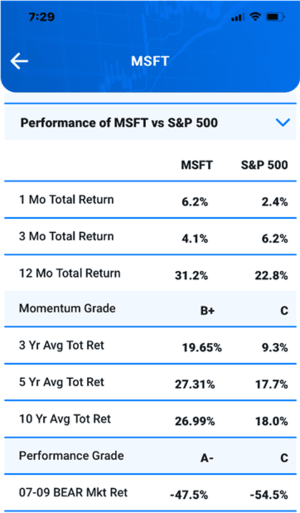
As illustrated by the graphic below, Microsoft has delivered significant alpha over the last one, three, five, and 10 years. When comparing the returns of Microsoft against all 5,388 stocks in my database, it earns an overall performance grade of A-.
Best Stocks Now App
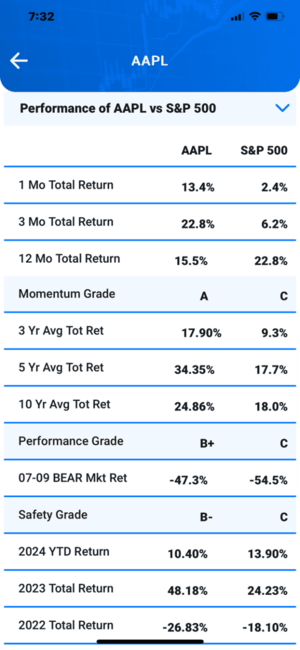
Apple has also delivered significant alpha to investors over the last three, five, and 10 years, but has stumbled over the last twelve months. In my opinion, this is a result of the iPhone 15 lacking the same buzz and sales results as the previous iPhone models that touted new and exciting never before seen features. With all this considered, Apple earns an overall performance grade of B+, with its momentum grade earning an A as the stock is breaking out to new, all-time highs.
Perhaps Apple will counteract these results as it introduces and integrates AI into its products. The stock has certainly perked up following Apple’s recent announcements, but now the company has to deliver.
Best Stocks Now App
But performance is all about the past, what is the best way to help us try and predict the future for these three behemoths?
That’s where valuations come in.
Five-Year Valuations
During my 25 years in the business as both an analyst and a professional money manager, I have used five-year valuations. If we calculate five-year growth rates, why not also calculate five-year target prices? This helps take a lot of the emotion out of the equation, and we can obviously tweak target prices as the numbers change along the way.
Let’s begin with the current valuation of Microsoft.
The company is expected to earn $11.81 per share in 2024 and $13.35 per share in 2025. In addition to this, the current consensus five-year growth rate is expected to be 15% per year. Using a multiple of 33X on those earnings yields a five-year target price of $771 per share.
Microsoft earns an overall value grade of B-.
This gives the stock’s 77.6% upside potential over the next five years. I generally like to buy stocks that first meet my performance criteria and then have 75% or more upside. Microsoft currently meets both of these criteria. This would put Microsoft’s market-cap at $5.9 trillion by 2029.
I currently have Microsoft as a Weak Buy (for new money) and it is currently ranked at No.104 overall out of 5,388 stocks, ETFs and Mutual Funds in my database. It is one of our largest positions at my firm.
Now let’s look at Apple’s current five-year valuation.
Apple is expected to earn $6.58 per share in 2024 and $7.19 per share in 2025. In addition to this, the current consensus five-year growth rate is expected to be between 9-10% per year. Using a multiple of 30X on those earnings yields a five-year target price of $310 per share.
This gives the stock’s 48.29% upside potential over the next five years. Apple earns an overall value grade of F. As I mentioned previously, I generally like to buy stocks that first meet my performance criteria and then have 75% or more upside. Apple currently meets just one of these criteria.
If my valuation is in the ballpark, this would put Apple’s market-cap at $4.9 trillion by 2029. It would also fall behind Microsoft by $1 trillion. Apple would have to increase its earnings estimates or growth rate to change this trajectory.
I also rank Apple as a Weak Buy. It is currently ranked No. 155 overall. Due to valuation concerns, I do not currently have any position in Apple.
Now let’s look at Nvidia’s current 5-year valuation.
Nvidia is expected to make $2.54 in earnings this year and $3.32 next year. Nvidia’s consensus five-year growth rate is 43.2%. I am toning it down to 25% per year going forward. I feel like this is a more reasonable number. Using a conservative multiple of 25X gets you to a five-year target price of $262.
This gives Nvidia the chance to double again over the next five years. This would take Nvidia’s market cap to $6.5 trillion by 2029, which would easily place it in first place over Microsoft and Apple.
If the consensus analyst growth rate of 43% per year as right and the stock traded at the same multiple as Microsoft (33X), this would put the stock at $675 by 2029. This is an outrageous number. This indicates that there are plenty of unknowns over the next five years for Nvidia. I choose to take the conservative view.
I still rank Nvidia as one of the best stocks in the market now. It is currently our second-biggest holding at my firm, with considerable gains in the stocks. Our largest holding is a stock that I wrote about two weeks ago, Eli Lilly.
Disclaimer
Future valuations are all conjecture. There is no guarantee that these companies’ valuations will occur in the way indicated in this article.
The securities identified and described do not represent all the securities purchased, sold or recommended for client accounts. The reader should not assume that an investment in the securities identified was or will be profitable.
Analyst’s Disclosure: I/we have a beneficial long position in the shares of MSFT, NVDA either through stock ownership, options, or other derivatives. I wrote this article myself, and it expresses my own opinions. I am not receiving compensation for it (other than from Seeking Alpha). I have no business relationship with any company whose stock is mentioned in this article.
Seeking Alpha’s Disclosure: Past performance is no guarantee of future results. No recommendation or advice is being given as to whether any investment is suitable for a particular investor. Any views or opinions expressed above may not reflect those of Seeking Alpha as a whole. Seeking Alpha is not a licensed securities dealer, broker or US investment adviser or investment bank. Our analysts are third party authors that include both professional investors and individual investors who may not be licensed or certified by any institute or regulatory body.
Best Stocks Now Premium gives you access to Bill Gunderson, professional money manager & analyst with 23 years of experience.
You get Bill’s daily “live” buys and sells in his four portfolios: Emerging Growth, Ultra-Growth, Premier Growth, and Dividend & Growth. Our Ultra-Growth portfolio has tripled the returns of the S&P 500 since its 1/1/2019 inception, while our Premier Growth portfolio has doubled the returns of the market during that same time-period.
JOIN NOW to get daily “live” buys and sells, weekly in-depth market-timing newsletter, access to Bill’s proprietary database with daily rankings on over 5,300 securities, and a daily live radio show!
