Summary:
- I believe that the iBuyer business model is inherently broken and that it is incapable of producing a sustainable profit.
- Opendoor’s capital base has been decimated by losses on home sales, severely constraining the company’s ability to scale back to a higher home inventory balance and growth.
- Losses are expected to continue through 2024 and beyond, further eroding the remaining tangible equity. I expect more than 75% in downside over the next twelve months.

mpruitt/E+ via Getty Images
Company Overview
Opendoor (NASDAQ:OPEN) is the U.S.A.’s largest iBuyer, or “instant buyer”, of residential real estate. An iBuyer uses proprietary technology to quickly value a home and make an initial cash offer to a prospective selling homeowner with an accelerated closing timeline if desired.
For these services, Opendoor charges a service fee that is typically around 5% of the sale price, which is comparable to what a home seller would pay in brokerage fees on a traditional home sale. They also earn revenues from closing fees (estimated around 2.5% of sales price) and from the “spread” or resale margin, which is essentially the difference between Opendoor’s purchase price versus the sales price. Opendoor defines spread as the “total discount to our home valuation at time of offer less the Opendoor service fee of 5%”. An article by Tony Mariotti on iBuyer’s describes the spread as follows:
The resale margin is the primary source of revenue for iBuyer’s. Unfortunately, when the residential real estate market slows and home prices drop, resale margins decrease, impacting profitability.
For sellers, the resale margin is their opportunity cost. With only one offer from an iBuyer — a single opinion of value – home sellers miss their chance to attract as many interested buyers as possible. Essentially, by working with an iBuyer, home sellers trade convenience for price discovery on the open market.
Does This Business Model Work?
Despite emerging as a concept in the mid 2010’s (Opendoor itself was founded in 2014), the wide consensus is that the business model remains “unproven”. Notably, online residential heavyweights Zillow and Redfin both exited the business in 2021 and 2022 respectively while collectively reported hundreds of millions in losses from their recent iBuyer foray. As a result of Zillow and Redfin’s exit, Opendoor and competitor Offerpad (OPAD) are the only remaining significant competitors within the iBuyer space which are still trying to make the model “work”, not that they really have any other options given it is their only lines of business.
Testing the model has not come cheap. Opendoor has not had positive annual net income during any of their publicly reported fiscal years from 2017 through YTD 2023. Opendoor even failed to report a positive net income during 2020 and 2021 when home prices grew by 11.4% and 18.0% respectively (source).
A Review of Opendoor’s P&L
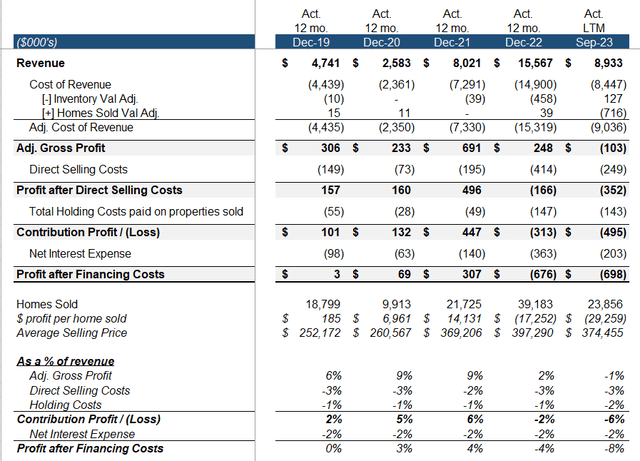
One of Opendoor’s primary KPIs is “contribution profit”, which is calculated as proceeds from home sales, less purchase price, less direct selling costs (e.g. buyer commissions), and less holding costs (e.g. utilities, taxes, insurance, etc.). This is essentially the profit an iBuyer generates before overhead expenses, purely from buying and selling homes.
At an absolute minimum an iBuyer must earn a consistently positive contribution margin so that the business can scale with volume and cover operating and overhead expenses. I have recreated the company’s historical contribution profits in the below table while also including net interest expense given Opendoor funds its home inventory with asset backed debt.
Compiled by author
We see that while Opendoor had a positive contribution profit through 2021, margins were razor thin and they did not cover the rest of Opendoor’s operating and overhead expenses.
Then the iBuyer model completely fell apart as the federal reserve began rapidly raising interest rates, resulting in higher mortgage rates, home price declines, and a pronounced drop in existing housing sale volumes. Opendoor was forced to re-sell its housing stock deeply below purchase price right as the company had ramped up its housing acquisitions. This brings us to the first fatal flaw of the iBuyer business model.
Why the iBuyer model doesn’t “work” at the macro level
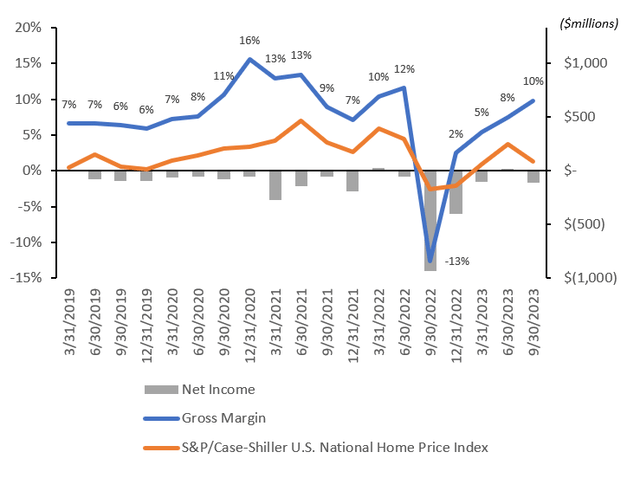
Even during a favorable backdrop in the housing market when home prices are appreciating, gross margins are very thin and highly correlated with U.S. housing prices.
The chart below compares Opendoor’s gross margin and net income against the quarterly change in the S&P/Case-Shiller U.S. National Home Price Index. Despite strong gross margins on the back of appreciating home prices through 2020 and 2021, Opendoor could not produce a positive net income and at best approached break-even on an operating cash flow basis (after accounting for all of the stock-based employee compensation). Therefore the business chugs along during good times, but creates no actual value for shareholders. Then inevitably when we have a slight correction in housing prices as witnessed in 2022, the iBuyer sees significant losses on their levered housing inventory holdings. These losses eat up the company’s capital base and further erodes their ability to turn a profit.
Compiled by author
Why the iBuyer model doesn’t “work” at the micro level
Housing cycle aside, why can’t Opendoor turn a profit during a favorable backdrop? I believe the answer to this question lies within a catch-22 like conundrum embedded within the company’s spread.
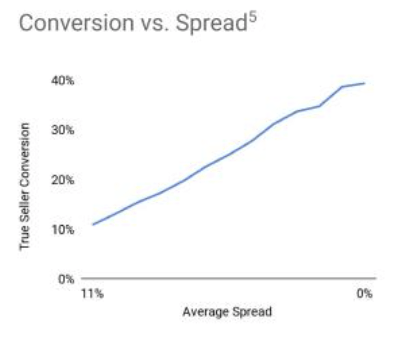
Direct selling costs, holding costs, and financing costs typically consume 6% to 7% of gross profits, which exceeds Opendoor’s 5% fee, leaving them dependent upon the spread in order to achieve a positive contribution margin. And the spread is inversely correlated with Opendoor’s “conversion”, or the percentage of homeowners who accept Opendoor’s purchase offer. Below is the relationship between spread and conversion per Opendoor’s data.
Opendoor
As a result, an iBuyer is left with something of a conundrum where they could have a profitable contribution margin per property with high spreads and low volumes, but in order to scale and cover overhead, the spread must be narrowed and contribution margins must shrink. Is it possible for an iBuyer to balance this trade-off and offer competitive enough bids which allows it to both be profitable on round-trip home transactions while also winning enough business to cover overhead? If it is, we have yet to see anyone in the industry do it, even in a year when housing prices appreciated by 18%. I believe the market of homeowners who are willing to accept a meaningful haircut on their homes (the average person’s largest asset by far) in exchange for the convenience of an instant offer is simply too limited.
A Hypothetical Break-even
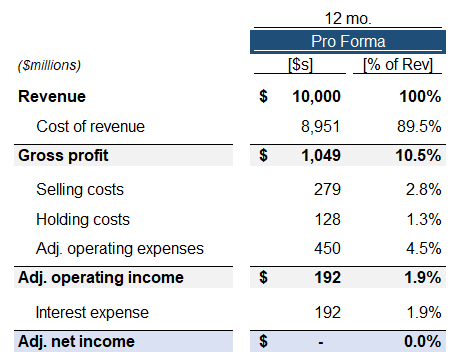
But for the sake of argument, we should try to understand how Opendoor could at least break-even if they indeed were able to overcome the inherent challenges posed by the iBuyer model. Management has commented that they believe the business can operate at a break-even adjusted net income (adding back share based compensation) if they can return to $10 billion in annual revenues.
You know, for ANI [adjusted net income] breakeven, we expect that to happen at $10 billion steady state revenue, meaning acquisitions are roughly equal to resales. And so at $10 billion with 4% to 5% adjusted OpEx, that’s what we’re marching towards.
Source: Q3 2023 Earnings Transcript
Based on these comments, I created the below hypothetical annualized break-even P&L.
Compiled by author
Two elements of this hypothetical P&L seem to pose a challenge. I estimate Opendoor’s LTM adjusted operating expenses to be ~$460mm, so this P&L would assume that the company can ramp operations back up with little in the way of additional marketing, G&A, etc.
But more importantly, it would imply a 10.5% gross profit margin. From 2017 through LTM 2023, Opendoor’s best reported annual profit margin was 9.1% in 2021 during the boom in housing prices while the three years prior to 2021 averaged 7.4%. Opendoor has been reporting gross profit margins of 12% lately on their newest vintages of property sales, but this has been achieved by intentionally maintaining a particularly high spread on very limited new acquisitions. I am skeptical with respect to the company’s ability to maintain margins at this current level if acquisitions are ramped back up.
Opendoor is Essentially Already Impaired
Now that we have reviewed the iBuyer business model and the failures of the past, we can turn to Opendoor’s go-forward prospects. I believe that the company has already suffered irreparable damage which would prevent it from reaching sustainable profitability even under ideal circumstances.
The capital base has been decimated
Opendoor’s losses have significantly impaired its business. During Q1 2021, Opendoor raised $886 million through a stock sale and used these proceeds to start ramping up their inventory acquisitions. Since then, Opendoor’s net losses have resulted in a 57% decline in shareholder equity, lowering the balance from $2.3 billion at Q3 2021 to $1.0 billion as of Q3 2023.
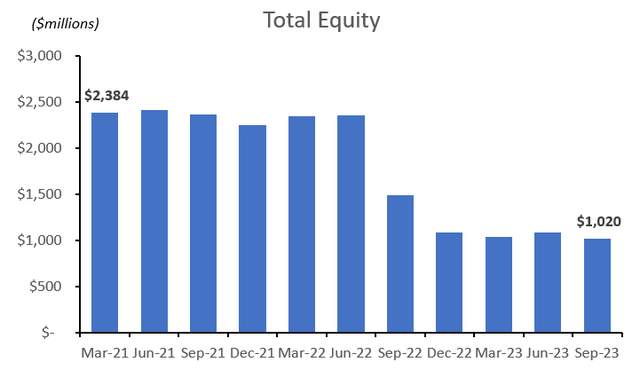
Compiled by author
Q4 2023 guidance
Management has guided for between $800 to $850 million in Q4 revenues, which would be a new recent quarterly low. This is obviously a far cry from the run-rate needed to achieve $10 billion in annualized revenues. Based on this top-line, the average sell-side Q4 GAAP earnings per share estimate currently stands at $(0.22).
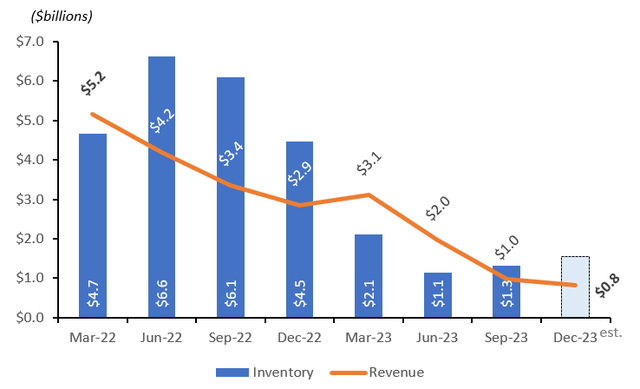
Compiled by author
The chart above also highlights Opendoor’s declining balance of homes within their inventory, which stood at $1.3 billion as of Q3 2023. If the company is to get back to $10 billion in annual revenues, they will need to resume a ramp-up in property acquisitions and begin turning over the higher level of inventory.
Management has commented that their normalized inventory turnover is between 3.0x to 3.5x, however the company has never done better than 3.3x annually since 2019 and averaged around 2.7x per year. And again, faster turns of inventory would mean narrower spreads and lower margins.

S&P Cap IQ
A conservative inventory turnover of 2.8x would imply that Opendoor needs to build inventory back to ~$3.3 billion from Q3 2023’s $1.3 billion balance in order to approach $10 billion in annualized revenues.
I believe that capital constraints will limit Opendoor’s ability to rebuild inventory
While management referred to billions in “borrowing capacity” on their latest earnings call, this is largely debt which has already been funded. Furthermore, their financial filings note that not all of the presented borrowing capacity is “committed”.
Borrowing capacity amounts under non-recourse asset-backed debt as reflected in the table above are in some cases not fully committed and any borrowings above the committed amounts are subject to the applicable lender’s discretion.
Source: Q3 2023 SEC Filing
Opendoor’s creditors have actively moved to reduce their exposure to the company. KKR led Opendoor’s October 2021 mezzanine refinancing which at the time was heralded as part of a “$9 billion debt war chest“. KKR retained a portion of the mezzanine debt within the BDC, FS KKR Capital Corp (FSK). During their Q4 2022 earnings call, they specific mentioned Opendoor while discussing their holdings “which were impacted by credit performance-related issues” and the steps they had taken to minimize exposure.
I’d also like to comment on another investment, Open Door. The company is an online real estate platform, facilitating the purchase and sale of single-family homes. In October of 2021, we led an investment in a $2.2 billion asset-secured mezzanine debt facility, which has since been reduced to $1 billion through a combination of undrawn commitment amount cancellations and debt repayments at par plus the related prepayment premiums which has meaningfully reduced our exposure.
Source: Q4 2022 Earnings Transcript
Also telling is a change in language between Opendoor’s Q2 2022’s 10-Q and Q3 2022’s concerning debt and financing arrangements.
Q2 2022:
Our business is capital intensive and maintaining adequate liquidity and capital resources is needed as we continue to scale and accumulate additional inventory. While there can be no assurance that these trends will continue, we have observed increased availability and engagement for this lending product across a variety of financial institutions and we have been able to improve terms and increase our borrowing capacity in recent years. We actively manage our relationships with multiple financial institutions and seek to optimize duration, flexibility, efficiency and cost of funds.
Source: Q2 2022 SEC Filing
Q3 2022:
Our business is capital intensive and maintaining adequate liquidity and capital resources is needed as we continue to scale and accumulate additional inventory. We intend to actively manage our relationships with multiple financial institutions and seek to optimize duration, flexibility, efficiency and cost of funds, but there can be no assurance that we will be able to obtain sufficient capital for our business or to do so on acceptable financial and other terms.
Source: Q3 2022 SEC Filing
Opendoor’s Q3 2023 10-Q notes that they had $1.4 billion in term loan commitments and $950 million in mezzanine commitments, which would imply that these facilities are fully funded unless creditors agree to allow further capacity. This would leave only $650 million in available revolver commitments.
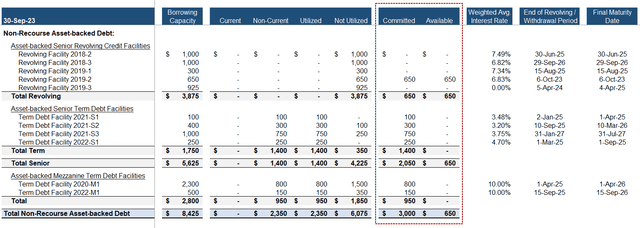
Compiled by author
Below is a further look at Opendoor’s declining debt balance and committed availability over time since the war chest hit its peak.
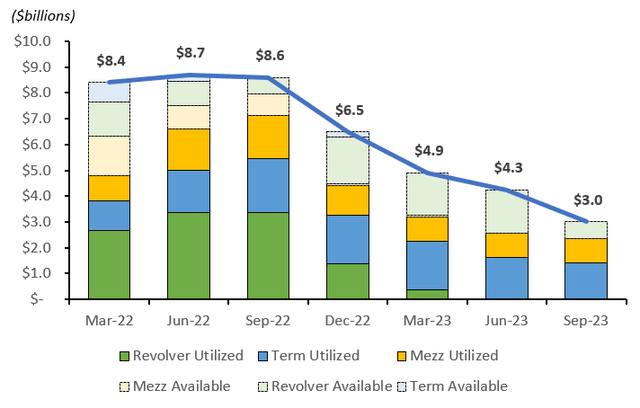
Compiled by author
One reason existing creditors may be reluctant to approve additional commitments is the fact that these legacy commitments carry below market rates. During late 2022, Opendoor briefly carried the loan facility “Term Debt Facility 2022-S2” which carried an average interest rate of 8.48% as opposed to an average interest rate of ~3.5% on their 2021 facilities. If they do obtain new commitments, I believe it would be safe to assume they would come at much higher interest rates which is a further blow to the iBuyer model and begs the question if the proliferation of the entire industry wasn’t just another offspring of ZIRP monetary policy.
Aside from the $650mm in available debt commitments, Opendoor’s other existing capital available for inventory purchases is $1.2 billion worth of restricted cash on the balance sheet, though it is difficult to say what portion of this could be allocated to inventory at any point in time. As the company notes, they have specific advance rates and often need to carry some amount of restricted cash against their debt balances.
We may be required to keep amounts in restricted cash accounts to collateralize our asset-backed term debt facilities if the property borrowing base is insufficient to satisfy the borrowing base requirements.
Source: Q3 2023 SEC Filing
If we assume Opendoor can use 90% of their restricted cash plus the $650mm committed debt availability, then we would get to a potential inventory balance of $3.0 billion, which likely would not be enough to achieve $10 billion in annualized revenues.
Opendoor does not appear to have an easy solution on the capital front. It will be critical to monitor how much debt availability they disclose over the coming quarters and if they obtain new financing at higher interest rates. And it’s worth remembering that we’re talking about simply trying to achieve a break-even adjusted net income, much less a break-even GAAP net income or results which would provide an appropriate risk adjusted return to shareholders.
Projections for 2024
Moving to the year ahead, we should not expect a strong rebound in sales right out of the gate in 2024. Opendoor acquired 2,680 properties in Q2 2023, 3,136 properties in Q3 2023 and has guided for an additional 3,000 properties in Q4 2023. This is the pipeline which will be converted into revenue in Q1 and Q2 of 2024 and would imply ~$1 billion in quarterly revenues. Below are my projections for fiscal year 2024.
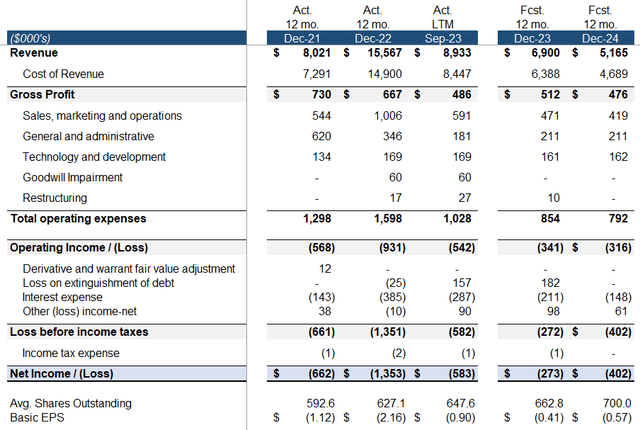
Compiled by author
My projections would imply $(0.57) cents in earnings per share in 2024. For what it’s worth, the average sell side estimate is even more bearish and currently stands at ~$(0.72).
Opendoor’s implied annual cash losses would be less than my projected $(402)mm net income due to the company’s sizable amount of stock based compensation which is a non-cash expense. Over the next 5 quarters, I expect ~$(335)mm in negative cash flows from operations.
If Opendoor does indeed incur a loss of this magnitude in 2024, the capital position would further tighten considerably. Below is an illustrative balance sheet projection.
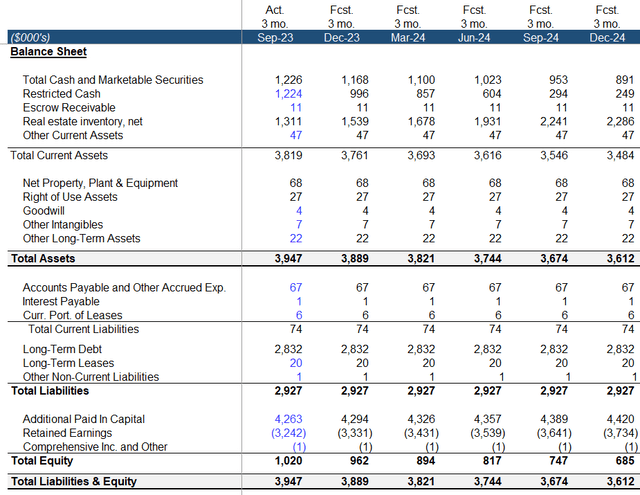
Compiled by author
If losses continue, shareholder equity would further decline while unrestricted cash would be consumed. This could quickly become problematic given Opendoor’s outstanding $502 million in (busted) convertible notes which mature in August 2026.
Ongoing Dilution and Insider Sales
Outside of operating losses, another factor which weighs on Opendoor’s share price is ongoing dilutive share based compensation (SBC) and insider sales. A relatively high amount of SBC has become routine at younger unprofitable tech companies. It is a non-cash expense that helps preserve liquidity while also flattering adjusted earnings metrics.
While 2021 was distorted by Opendoor’s entry into public markets, quarterly SBC regularly accounts for more than 10% of quarterly gross profits. YTD 2023 SBC through Q3 totals $94 million, amounting to more than 20% of YTD gross profits of $415 million. Dilution has become even more pronounced as Opendoor’s share price has declined, with total shares outstanding having increased by more than 1.5% over each of the past two quarters. Furthermore, this compensation is regularly monetized and sold into the open market by insiders.
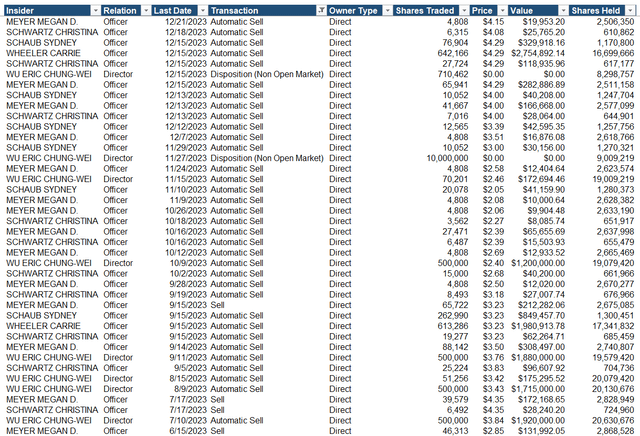
NASDAQ
According to NASDAQ’s data, insiders disposed of more than 26 million shares during 2023 (representing nearly 4% of the current shares outstanding) while having completed no open market purchases over the past two years (the end of the data set). Opendoor co-founder and former CEO, Eric Wu’s, latest Form 4 shows his remaining shares owned to be 18.3 million as of 11/27/23, down nearly 50% in 1.5 years from 35.6 million shares as of 5/17/22. Mr. Wu announced his resignation from his position at Opendoor and from the board on December 14th and appears to be formally exiting the company.
Concluding Summary and Price Target
I believe Opendoor is stuck between a rock and a hard place and that the door is rapidly closing. If the company continues to generate quarterly cash losses, I believe it will ultimately become insolvent.
In order to return to cash profitability, they must at a minimum increase run-rate quarterly revenues by more than 2.5x from ~$900 million to $2.5 billion. This will be no easy feat as existing home sales volumes remain depressed. Opendoor would need to ramp up marketing (increase opex), deploy more than $1 billion in balance sheet cash (reduce interest income), increase funded debt (increase interest expense), and reduce their bid-offer spreads (reduce gross profit), all of which will weigh on profitability in the near-term.
In light of these challenges and the uncertainty on if the company can ever sustain profitability, I believe that Opendoor’s common shares should trade at a discount to tangible book value per share, which currently stands at $1.51 as of Q3 2023, as indeed it did from September 2022 through April 2023 where it traded at an average P/TBV of 0.84x during the period.
I project that in 12 months, Opendoor’s Q3 2024 tangible book value per share will be further reduced to ~$1.00 through a combination of losses and continued SBC dilution. Therefore, my price target per share stands at $1.00 and would imply 77% in downside from today’s price of ~$4.50 per share.
Analyst’s Disclosure: I/we have a beneficial short position in the shares of OPEN either through stock ownership, options, or other derivatives. I wrote this article myself, and it expresses my own opinions. I am not receiving compensation for it (other than from Seeking Alpha). I have no business relationship with any company whose stock is mentioned in this article.
Seeking Alpha’s Disclosure: Past performance is no guarantee of future results. No recommendation or advice is being given as to whether any investment is suitable for a particular investor. Any views or opinions expressed above may not reflect those of Seeking Alpha as a whole. Seeking Alpha is not a licensed securities dealer, broker or US investment adviser or investment bank. Our analysts are third party authors that include both professional investors and individual investors who may not be licensed or certified by any institute or regulatory body.
