Summary:
- Opendoor is at an inflection point.
- 99% of its loss-making Q2 Cohort has already been sold.
- In other words, profitability is set to improve from here.
- Despite the improving outlook, Opendoor stock sold off by 25%.
- Perhaps, this is one last drop before the stock marches to new highs.

Dorin Puha
Introduction
Opendoor Technologies (NASDAQ:OPEN) provides an end-to-end platform that gives consumers the power to buy and sell homes at the tap of a button, which is a much simpler, faster, and more certain solution than the traditional process of buying and selling homes.
The company recently released Q2 results which sent the stock crashing 25% the following day — if you’ve been a follower (or investor) of Opendoor stock, you’ll probably get used to this kind of volatility.
With that being said, we’ll investigate the reason for the sell-off in this article.
But here’s the main takeaway from this article:
Although Opendoor is facing a challenging macro environment, the company is at an inflection point as it begins to predominantly sell its higher-margin fresh Inventory.
As such, Opendoor’s return to profitability is inevitable, and with a much leaner, efficient, and disciplined growth strategy in place, Opendoor is well-positioned to rescale its business heading into 2024.
Growth
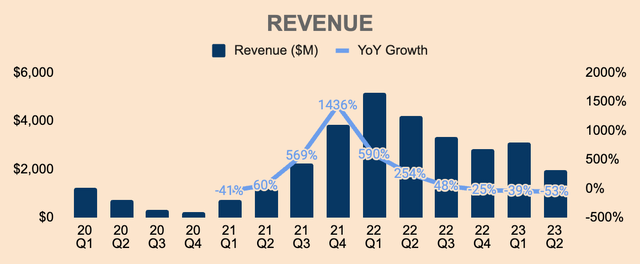
Q2 Revenue was $2.0B, which is down a staggering 53% YoY, due to lower sales volumes and home prices.
Despite the slowdown, Q2 Revenue exceeded the high end of Opendoor’s revenue guidance by 7% as well as beat analyst estimates by $140M. The better-than-expected performance was due to strong market clearance rates and the sell-through of its old book of Inventory.
Author’s Analysis
As you can see, Revenue growth went through the roof in 2021, where growth peaked at 1,400%+ in Q4 of 2021. This massive growth was due to much lower Inventory levels in FY2020 as the company paused home purchases in the wake of the pandemic.
Since then, Revenue decelerated significantly as the housing market cools down, and growth went negative in the last three quarters as high inflation caused the FED to hike interest rates at a record pace, causing mortgage rates to spike as well.
Revenue growth and acquisition volumes go hand in hand — in order to sell more homes, Opendoor needs to buy more homes first. That is what Opendoor has done in 2021 and early 2022 — Opendoor went berserk in terms of home acquisitions. Consequently, Opendoor was able to sell more homes, thus contributing to a surge in Revenue in the better part of 2021 and 2022.
However, the Fed began raising interest rates in Q2 of 2022, which negatively impacted housing affordability, causing many home buyers to stay on the sidelines, and thus decreasing overall transaction volume.
The problem was that Opendoor had acquired way too many homes and with demand drying up, Opendoor had no choice but to slam on the brakes and slow down the pace of home acquisitions.
And to make matters worse, the housing correction meant that Opendoor had to sell homes at prices lower than what they have bought them for.
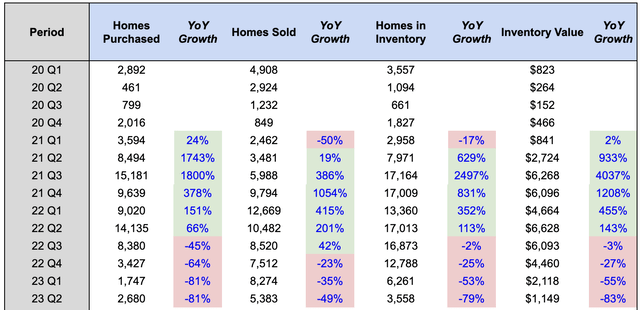
As you can see, Homes Purchased in the last four quarters were down significantly compared to the previous year. In Q2, Opendoor purchased 2,680 homes, which is down 81% YoY. This drop is due to sellers staying on the sidelines, lower marketing spend, and higher spreads embedded in Opendoor’s offers, resulting in lower conversions.
Author’s Analysis
As a result of fewer homes purchased, Opendoor sold fewer homes as well. In Q2, Opendoor sold 5,383 homes in Q2, which is down 49% YoY. The decrease in sales volume was due to the slowdown in home acquisitions over the last few quarters, which resulted in fewer Homes in Inventory that can be sold.
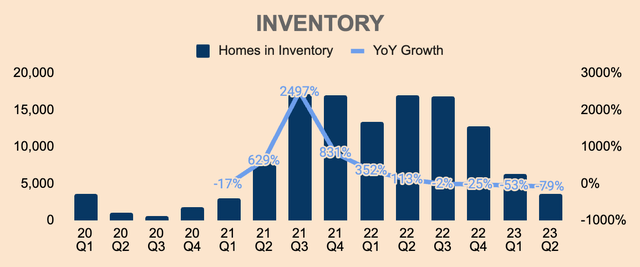
As shown above, as of Q2, Opendoor had 3,558 Homes in Inventory, which is down 79% YoY, which also meant that Opendoor has very few homes that they can sell, thus leading to weak Q3 Revenue guidance.
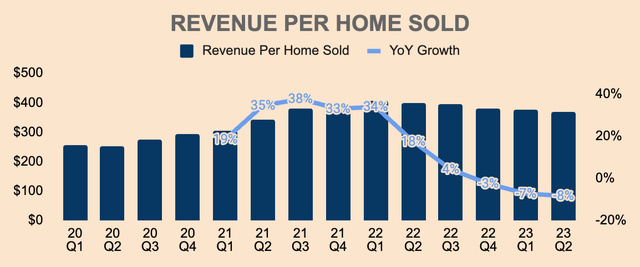
The housing correction put some pressure on Opendoor’s topline as well. In Q2, Revenue Per Home Sold was $377K, which was down 7% YoY. For context, that figure was $397K in FY2022.
Author’s Analysis
With that said, the slowdown in 2022 and 2023 is due to cyclical reasons — there’s going to be a period of expansion and recession in the housing industry and it seems that we’re in a housing recession currently.
That, of course, is going to be a headwind for Opendoor, which is why the stock is down so much.
However, as I’ll discuss more later, Opendoor’s growth story remains intact. The recovery is well underway, and before you know it, Opendoor will be back in growth mode.
Profitability
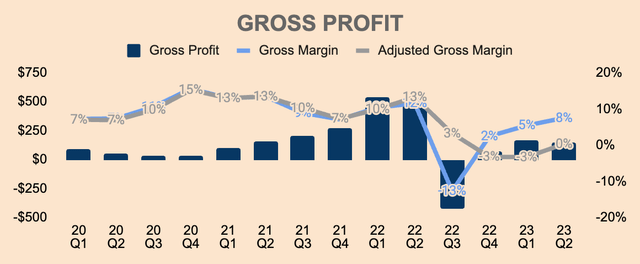
Turning to profitability, GAAP Gross Profit for the quarter was $149M, representing a GAAP Gross Margin of 7.5%.
Gross Margins are in a downtrend and this is due to management’s decision to prioritize risk management and resale clearance of old Inventory as a result of the housing market decline. The weakness in the housing market also led to negative Inventory Valuation Adjustments, which are embedded in Gross Margins.
Author’s Analysis
That said, it’s better to look at Adjusted Gross Profit, which aligns the timing of Inventory Valuation Adjustments recorded under GAAP to the period in which the home is sold.
For example, GAAP Gross Profit is positive in Q1 and Q4, when in fact, the company made losses on the houses sold as seen by the negative Adjusted Gross Margins. This is because most of the Inventory Valuation Adjustments were recorded in Q3 of 2022 during the large housing correction, which is why we saw a very negative GAAP Gross Profit in Q3 last year.
In other words, Adjusted Gross Profit tells us how much profit or loss Opendoor made for the homes that are sold in the quarter, regardless of when they are purchased.
With that in mind, Adjusted Gross Profit turned profitable once again, at just $7M in Q2, representing an Adjusted Gross Margin of 0.4%.
However, this pales in comparison to last year’s Q2 results, which was $556M at an Adjusted Gross Margin of about 13%, meaning, Opendoor is not out of the woods yet and the return to slight profitability is definitely not something to cheer about.
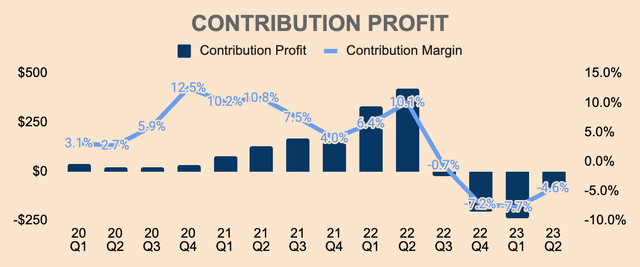
Moving on, Contribution Loss, which accounts for direct selling costs and holding costs, was $(90)M in Q2, which represents a (4.6)% Contribution Margin.
Author’s Analysis
The drop in Contribution Margin YoY was due to lower Adjusted Gross Margins, higher holding costs, as well as the company selling old Inventory at losses.
Management has been laser-focused on selling its old Inventory, more specifically, the homes that Opendoor acquired at peak prices between March and June of last year, just before the housing market reset.
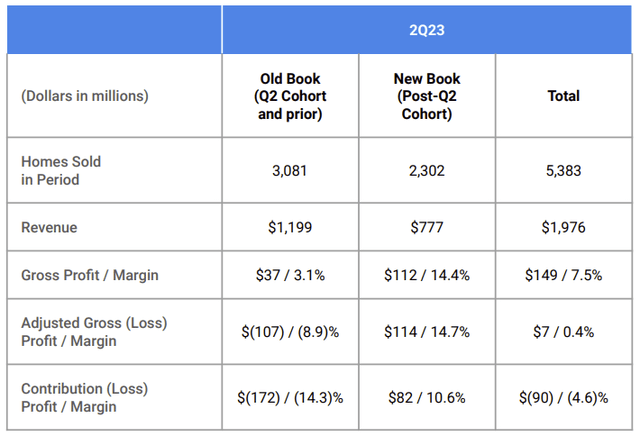
Fortunately, Opendoor has sold 99% of its old book, or its loss-making Q2 Cohort, leaving only 1% left to be dumped.
The reason why overall Contribution Margins are still negative in Q2 is due to the fact that the old book of Inventory make up 57% of Opendoor’s resale mix in Q2.
As you can see, Opendoor sold more homes from its old book, which has a Contribution Margin of (14.3)%.
Opendoor FY2023 Q2 Shareholder Letter
However, as shown above, Opendoor’s new book of homes showed strong margin performance, with Gross Margins of 14.4%% and Contribution Margins of 10.6% in Q2, but since they only make up 43% of Revenue, the profits made from the new book was not able to offset the losses made from the old book.
But moving forward, we should see margins improving as Opendoor unloads the remaining 1% of its Q2 cohort and the higher-margin new book of Inventory make up the majority of Revenue.
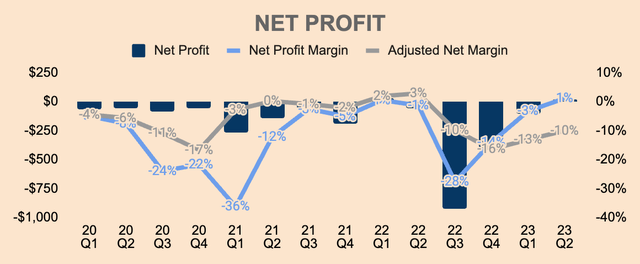
Moving down the income statement, Q2 GAAP Net Profit was $23M, which is a 1.2% GAAP Net Margin.
As you can see, Opendoor returned to positive GAAP Net Profit, but keep in mind that this is due to:
- $104M Gain on Extinguishment of Debt
- $36M YoY decrease in Interest Expense
- $37M YoY increase in Other Income
Without item 1, Opendoor would still be unprofitable on a GAAP basis.
That’s why we look at Adjusted Net Margin, which was (10.0)% in Q2. As a reminder, Adjusted Net (Loss) Profit also aligns the timing of Inventory Valuation Adjustments to the period in which the related revenue is recorded.
Author’s Analysis
However, Adjusted Net Margin is at an inflection point as it continues to improve QoQ as Opendoor disposes of its lower-margin old book and continues selling more of its higher-margin new Inventory.
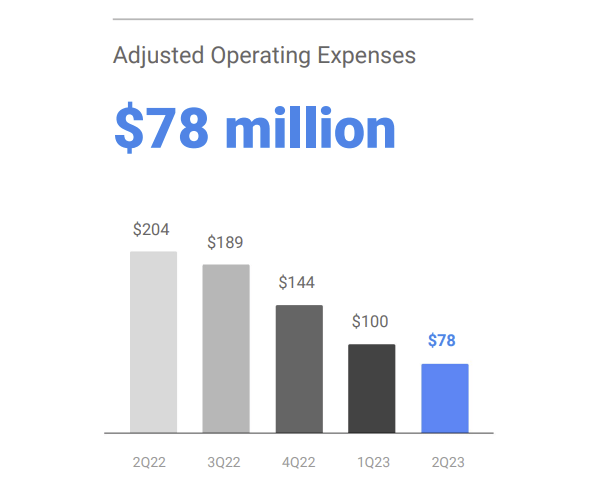
In addition, Opendoor has also been taking proactive measures to reduce spending, with Adjusted Operating Expenses decreasing from $204M in Q2 last year to just $78M million in Q2 this year.
Opendoor FY2023 Q2 Shareholder Letter
Opendoor’s evolving marketing strategy will boost its bottom line as well. In particular, Opendoor’s partnership channels with homebuilders, agents, and online real estate platforms (like Zillow, Redfin, and Realtor.com) are driving massive brand exposure for Opendoor, at relatively low customer acquisition costs.
In 2Q23, our partnership channels represented 40% of total acquisition contracts (with direct-to-consumer providing the other 60%). Notably, acquisition contracts from our partnership channels saw 78% sequential growth in 2Q23.
(Source: Opendoor FY2023 Q2 Shareholder Letter)
The company also announced another round of layoffs in April, which reduces its workforce by 22% or 560 employees. With the layoffs, management expects another $50M reduction in annualized expenses, so this should improve margins moving forward.
All in all, Opendoor has really awful profitability metrics.
But the good news is, they seem to be improving as the company looks past its old Inventory.
The problem with Opendoor’s business model is that it needs to scale in order to cover its variable and fixed cost structure. Only then would Opendoor be able to turn profitable and sustain that profitability through economies of scale and operating leverage.
That said, I think the worst is already behind us and I see the potential for Opendoor to improve margins as the housing market stabilizes, as the company transitions to selling its new book, and as the company rolls out its 3P marketplace product, Exclusives.
Financial Health
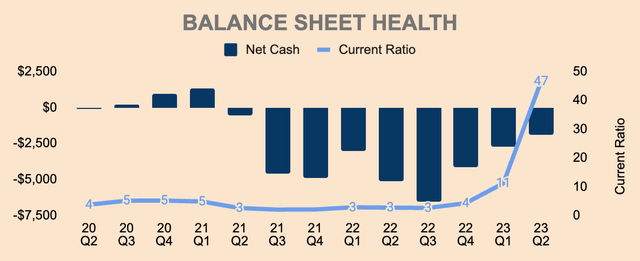
Opendoor’s business model is considered capital intensive as the company needs to tap into the debt markets to buy homes and ultimately fund growth. As such, we can see that Opendoor has a negative Net Cash position.
As of Q2, Opendoor has $1.2B of Cash and Short-term Investments with $3.1B of Total Debt, which puts its Net Cash position to be about $(1.9)B.
Author’s Analysis
However, the company is taking measures to reduce its Debt balance. More specifically, Opendoor invested $169M to repurchase $279M of its outstanding 2026 convertible notes at a massive discount to par value.
In addition, the company wound down the last of its two Q2 Cohort financing facilities.
Altogether, Opendoor reduced $0.9B of Debt on a QoQ basis, which I think is really clever of management, given the current macro environment.
In terms of Inventory, Opendoor ended the quarter with 3,558 Homes in Inventory, valued at $1.1B. This figure is down 46% from the prior quarter or 79% from a year ago, so Opendoor has very few homes to sell.
Author’s Analysis
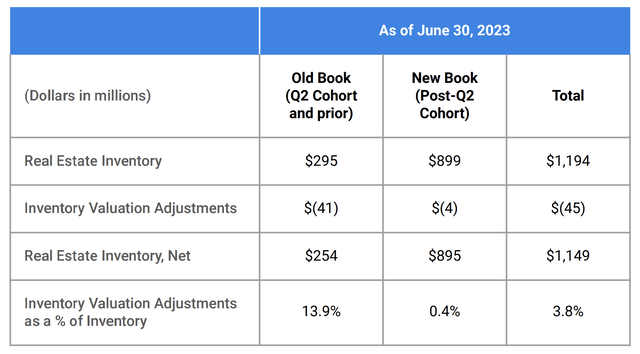
On the other hand, approximately 22% of the Inventory balance consists of the old book, which is down from 66% in Q1, which reflects the company’s incredible progress to offload these older homes.
Opendoor FY2023 Q2 Shareholder Letter
Opendoor also ended the quarter with $(45)M of Inventory Valuation Adjustments against its gross Inventory balance of $1.2B. This adjustment is management’s estimate of future losses that Opendoor may realize on these homes.
Even so, notice that Opendoor’s new book Inventory Valuation Adjustments represent only 0.4% of Inventory, which management claimed to be consistent with historical performance. This means that the housing market has pretty much stabilized.
It is also worth mentioning that only 9% of Opendoor’s new book of Inventory had been listed on the market for more than 120 days, versus 16% of homes on the market. The lower the number, the faster the Inventory turnover rate, which is what we want to see. In this case, Opendoor’s new book is being sold faster than the general market, which is great to see.
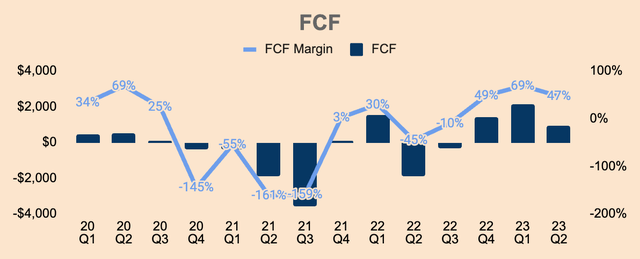
As mentioned earlier, Opendoor’s business model is capital-intensive and it is quite hard to predict its cash flow. But it is safe to assume that:
- if FCF is negative, the company is a net buyer of homes
- if FCF is positive, the company is a net seller of homes
As it turns out, Opendoor has been a net seller of homes in the last three quarters. In Q2 alone, the company generated $931M of FCF, which is a 47% FCF Margin.
When the housing market stabilizes or when interest rates fall, I expect the company to be a net buyer of homes once again.
Author’s Analysis
All in all, I believe Opendoor has a strong balance sheet. As an Opendoor investor, I’m happy with how management is allocating capital, managing debt balances, and lowering Inventory exposure.
Outlook
Management provided the following Q3 guidance:
-
Revenue: between $950M and $1.0B. This is a ~50% sequential decline or a 71% drop YoY, and this is also well below consensus estimates of $1.36B, which is a major reason why the stock sold off following Q2 results.
-
Adjusted EBITDA: between $(60)M and $(70)M. Because of the lower volume, Adjusted EBITDA is still expected to be negative. Again, Opendoor needs to scale to achieve profitability.
-
Stock-based compensation expense: ~$35M.
-
Adjusted operating expenses: ~$100M. The sequential increase from $78M this quarter reflects management’s expectation to begin rebuilding Inventory in Q3.
During the earnings call, management also left a few positive remarks (emphasis added):
We expect the second quarter to mark the last quarter of negative contribution margin with positive contribution margin levels beginning in Q3 when our fresh book of Inventory comprises the majority of our resales.
We expect to perform within our 5% to 7% contribution margin target beginning in Q4 of 2023. We are managing our business to return to positive adjusted net income, which is our best proxy for operating cash flow and we believe we have the cost structure and balance sheet in place to do so. We expect to reach ANI (Adjusted Net Income) breakeven at steady state annual revenue of $10B or approximately 2200 acquisitions and resales per month at our target contribution margin range of 5% to 7%.
(Source: CFO Christina Schwartz — Opendoor FY2023 Q2 Earnings Call)
In other words, profitability is set to improve from here.
But to achieve Adjusted Net Income breakeven, Opendoor needs to scale and generate an annual Revenue run rate of at least $10 billion, with a Contribution Margin range of 5% to 7%.
It won’t happen this year — but next year is possible.
Here’s how the company is setting up for a banner FY2024.
We plan to continue to operate with elevated spreads and for acquisition volumes to pace at roughly 3,000 homes per quarter through the end of the year. Our expanded partnership channels should mitigate typical seasonal market volume declines in the second half of the year. In the fourth quarter, we expect to be able to reduce spreads due to typical home price seasonality, which would accelerate acquisitions in the first quarter of 2024, coinciding with improving market volumes. This will allow us to increase cost-effective investments in paid marketing. These factors, combined with the accruing benefits of our partnership channels, will drive higher volumes and ultimately allow us to rescale the business.
(Source: Opendoor FY2023 Q2 Shareholder Letter)
Put simply, Opendoor aims to rescale the business by reducing spreads in Q4 to take advantage of lower home prices during the winter seasons — this should drive higher acquisition volumes. When demand picks up again during the hotter seasons, prices should appreciate once again, allowing Opendoor to generate significant Revenue at healthy margins.
Nevertheless, given the performance and outlook today, I expect Opendoor to achieve at least $10B of Revenue as well as positive Adjusted Net Income by the end of next year.
With that being said, I think the growth potential for Opendoor is absolutely massive.
Residential real estate is the largest undisrupted industry in the United States, with more than six million homes sold annually, representing over $1.9T in 2022. Additionally, 66% of Americans are homeowners, and housing is the single largest consumer expenditure, ahead of transportation, food, insurance, and healthcare.
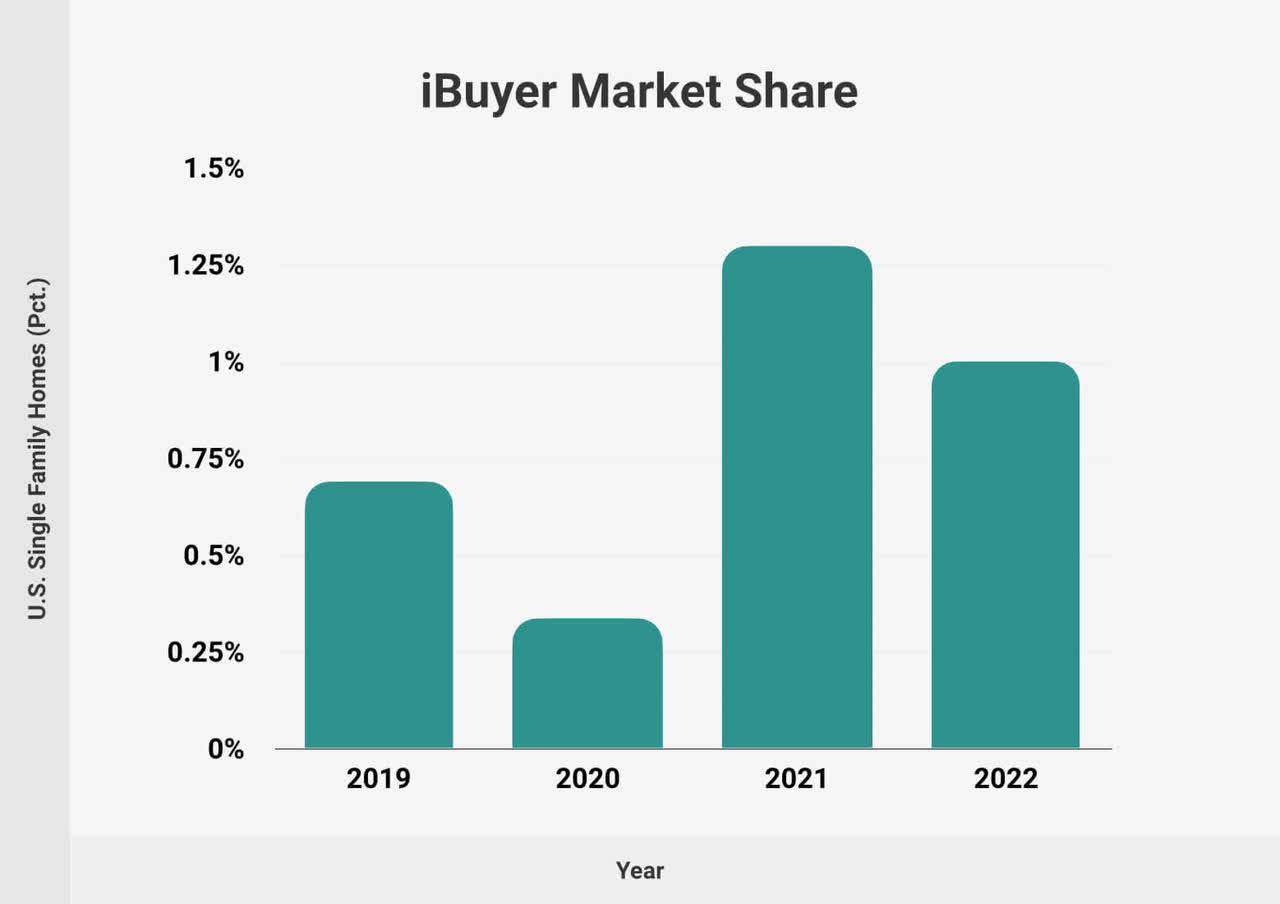
While Residential real estate is a massive market, it is still largely offline. As you can see here, iBuyers only make up 1% of total transactions in 2022, and the drop from 2021 is due to Zillow exiting the iBuying business.
RubyHome
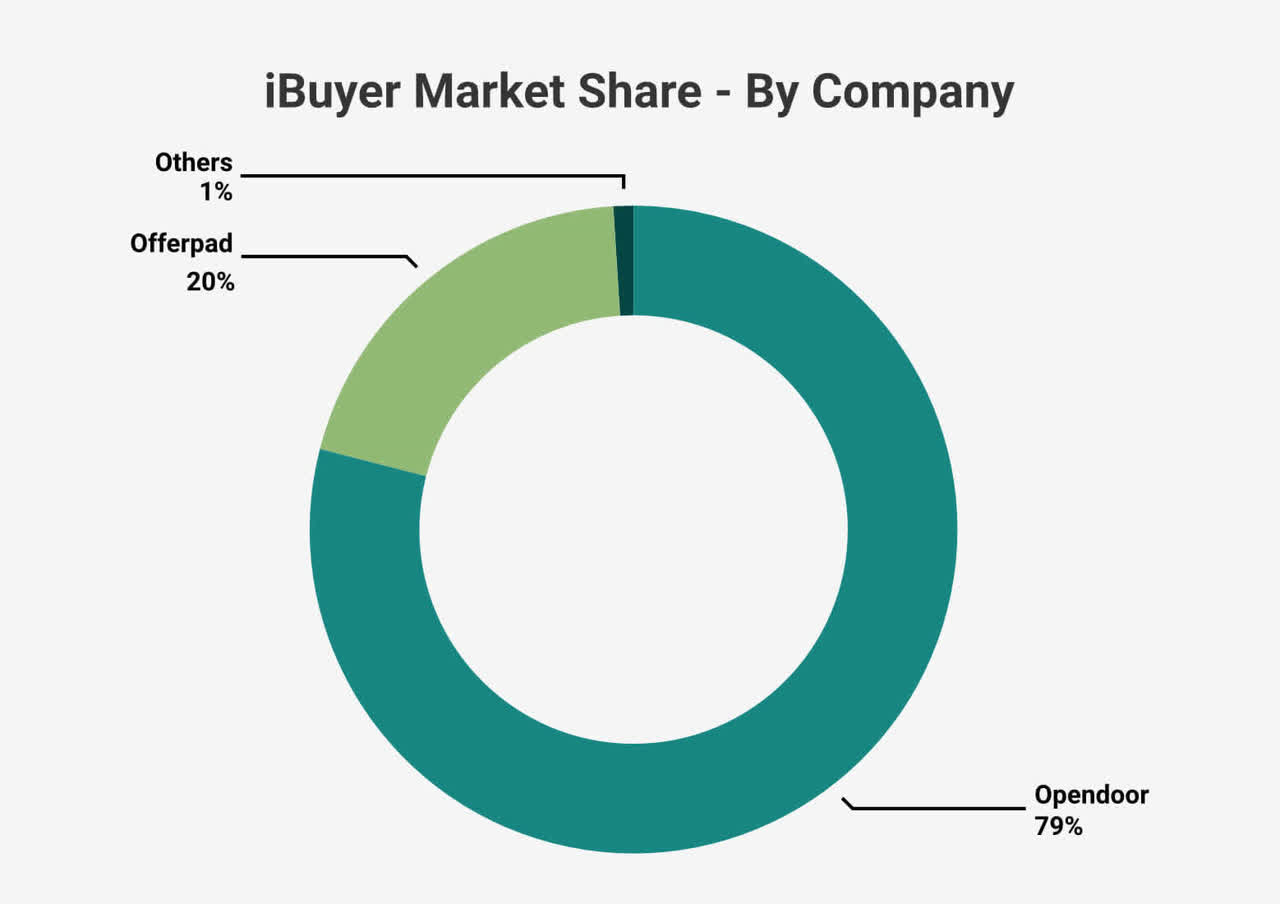
Opendoor now makes up almost 80% of the iBuyer market share, which is by definition, a virtual monopoly, and this should give Opendoor a substantial competitive advantage over competitors like Offerpad and Redifn.
RubyHome
That aside, iBuyer market share is growing rapidly, and with 99% of residential real estate transactions still happening offline, there lies a massive opportunity for Opendoor to gain market share over the next decade or so.
At the same time, I think an uncertain macro environment could actually help Opendoor gain market share as people want speed, transparency, and certainty.
Valuation
Looking at Opendoor stock, we can see that the stock is up almost 200% YTD, and at one point, it was up more than 300%. The rally started back in May, immediately after the company released strong Q1 results, which saw the stock surging 25%+ the following day.
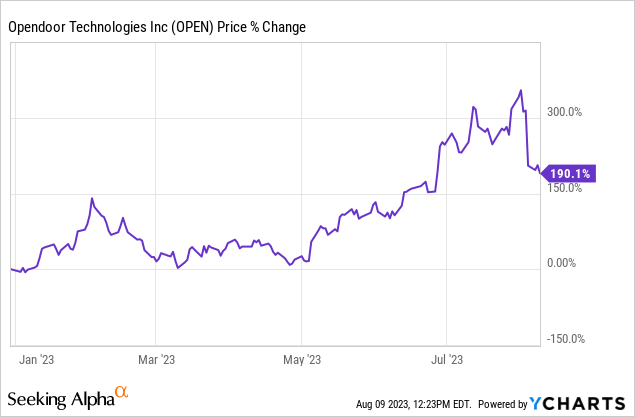
However, after releasing Q2 results, Opendoor crashed by more than 25%, most likely due to weak Q3 Revenue guidance. In addition, I think there’s a lot of profit-taking given the recent rally that we’ve seen.
In my opinion, Opendoor could drop one last time towards its 200-day moving average — maybe around the $2.50 level — before resuming its rally.
Looking at valuation multiples, we can see that Opendoor still trades at depressed levels.
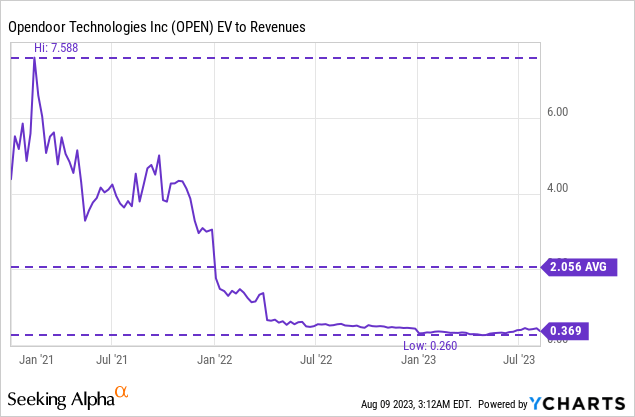
Currently, Opendoor trades at an EV/Revenue multiple of just 0.4x, which is far below its peak of 7.6x and its average of 2.1x. So from a historical standpoint, Opendoor looks very cheap.
Wall Street is pretty neutral on Opendoor stock, with 4 Buy, 4 Hold, and 4 Sell recommendations. As you can see, the average analyst price target is $3.31, which is close to where the stock is currently trading.

Seeking Alpha
On the other hand, institutions lowered their exposure in Opendoor over the last few quarters, again, probably due to profit-taking. That said, institutional ownership remains higher than 2020 and 2021 levels so that’s a vote of confidence for investors.
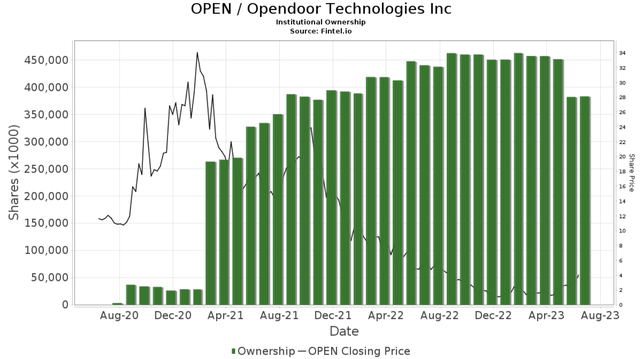
Fintel
The bad news is that insiders have been selling their shares. Most notably, Opendoor founder Eric Wu filed to sell $20M worth of Opendoor stock. Although he still owns 20M+ shares (worth ~$60M+), a major owner selling shares is never a good sign.
But the bigger concern, in my opinion, is that, despite the depressed share price, insiders have yet to purchase shares, which doesn’t really give the confidence that long-term investors need.
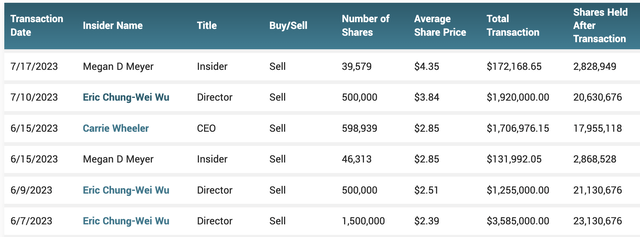
MarketBeat
As a sanity check, I’ve also done a DCF analysis on Opendoor. Although this might be a futile exercise — Opendoor’s financials are as volatile as a pendulum — it might be helpful for some of you to visualize what Opendoor’s financial performance may look like in the future.
That said, here are my key assumptions:
- Revenue: I followed analyst estimates for the first three years and then gradually dropped growth rates to 18% growth in 2032.
- Gross Margin: I think management will tread carefully in terms of growth so I expect them to maintain higher spreads in their offers, which will lead to higher Gross Margins. As such, I expect Opendoor to achieve a long-term Gross Margin of 10% as the company gains economies of scale as well as introduces higher-margin products such as its 3P marketplace, Exclusives.
- Operating Expenses: I expect the company to gain operating leverage. As such, Operating Expenses as a % of Revenue should improve over time from 10% currently, to just 8% by 2032.

Author’s Analysis
Based on all these assumptions, I expect Opendoor to achieve an annual Revenue run rate of about $45B by 2032. Assuming a $2T residential real estate industry, this is only a ~2.3% market share for Opendoor, which is feasible in my opinion.
In addition, I expect a FCF margin of about 3.1% by 2032, which is at the upper end of management’s long-term target.

Author’s Analysis
Assuming a discount rate of 12% and a perpetual growth rate of 2%, I arrive at an intrinsic value per share of about $7.88 for Opendoor, which is way higher than the average analyst price target of $3.31.
Nevertheless, this represents a 100%+ upside potential based on the current price of $3.50.
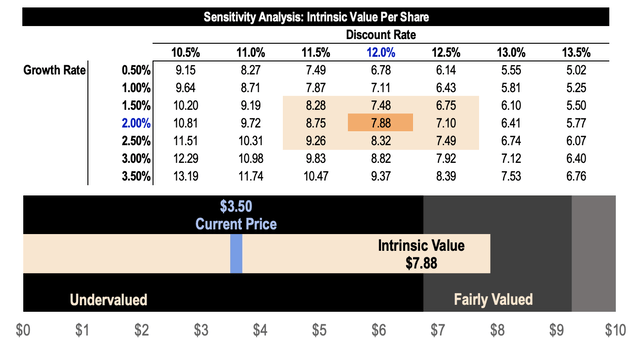
Author’s Analysis
Risks
Banks Collapsing
In 2023, four banks collapsed and although this number pales in comparison to the hundreds of banks that failed during the GFC, the total assets held by these four banks were much larger than the assets held by the hundreds of banks that failed during the GFC.
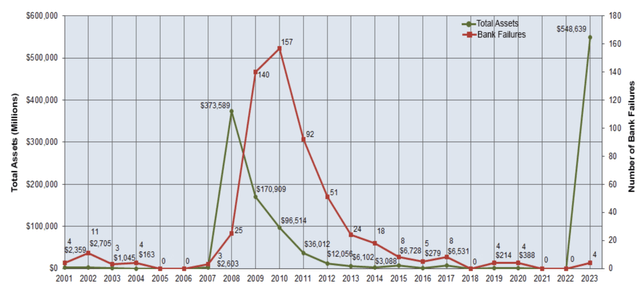
FDIC
In addition, lots of mid-sized regional banks loaded on commercial real estate when interest rates were near zero. With the higher CRE loans in their balance sheets, these banks are under a lot of pressure as a significant portion of these loans will have to be refinanced at higher rates, making these banks vulnerable to defaults.
So if we see more banks failing due to CRE defaults, Opendoor could see downward selling pressure as investors sell anything related to real estate.
Interest Rate Hikes
A high-interest rate environment is not good for most businesses, let alone a capital-intensive, unprofitable real estate business like Opendoor.
For consumers, mortgage payment costs will be higher, thus decreasing affordability and demand for homes.
For Opendoor, it means a higher cost of capital to fund home acquisitions. As the cost of debt rises, margins are likely to be compressed as well.
But I want to show you this chart. As you can see, home prices continue to trend upward regardless of how high or how low interest rates are. That said, the growth of the real estate industry and continued home price appreciation should be a long-term tailwind for Opendoor.
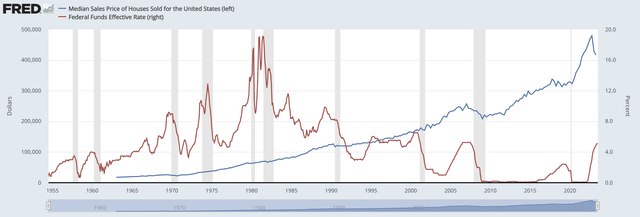
FRED
Housing Crash Part 2
The collapse in Contribution Profit Margin over the last few quarters tells me that Opendoor’s pricing algorithm is not agile or advanced enough to respond to rapid changes in the housing market.
I understand that the housing shock that we’ve seen in the past few quarters seemed to be a once-in-a-half-century event that no one, including Opendoor, saw coming. But there’s one thing we can’t deny: Opendoor’s pricing algorithm fails to take into account a selloff of this magnitude.
That said, another housing crash could leave Opendoor in a really bad spot once again. Another crash means that Opendoor has to liquidate Inventory at prices below what it paid for, thus producing negative margins, which could add pressure to Opendoor stock.
Thesis
I can sum up Opendoor’s Investment thesis in just one sentence:
Opendoor operates as a virtual monopoly in the iBuying business and with less than 1% market share in the massive residential real estate industry, Opendoor has a long growth runway ahead as the company builds an end-to-end platform for people to buy and sell homes with simplicity and certainty.
Although the company is facing a challenging macro environment characterized by rising interest rates and volatile home prices, management is doing everything they can to balance growth, profitability, and risk.
And as seen in Q2 results, Opendoor is at an inflection point as it sells off its old book of Inventory, giving the much-needed stage for the new book of Inventory to shine.
Opendoor now has a much leaner, more efficient, and more disciplined growth strategy, which should help the company to rescale without sacrificing profitability.
As such, Contribution Margins are set to improve in Q3 and Q4, and it won’t be long before the company achieves the $10B Revenue run rate that it needs to achieve Adjusted Net Income profitability.
Despite the improving outlook and turnaround of the business, Opendoor stock took a beating after Q2 results, due to weak Q3 Revenue guidance.
Perhaps, this is one last drop before the stock marches to new highs.
Analyst’s Disclosure: I/we have a beneficial long position in the shares of OPEN either through stock ownership, options, or other derivatives. I wrote this article myself, and it expresses my own opinions. I am not receiving compensation for it (other than from Seeking Alpha). I have no business relationship with any company whose stock is mentioned in this article.
Seeking Alpha’s Disclosure: Past performance is no guarantee of future results. No recommendation or advice is being given as to whether any investment is suitable for a particular investor. Any views or opinions expressed above may not reflect those of Seeking Alpha as a whole. Seeking Alpha is not a licensed securities dealer, broker or US investment adviser or investment bank. Our analysts are third party authors that include both professional investors and individual investors who may not be licensed or certified by any institute or regulatory body.
