Summary:
- The co-founders of OPEN have significantly reduced their holdings, signaling a potential lack of confidence in the company’s future.
- The iBuyer business model, as implemented by OPEN, in my view, is fundamentally flawed and makes profitability highly unlikely.
- iBuyer have proven to be money losers even in a bull real estate market.
- The current unfavorable macroeconomic environment is likely to exacerbate the negative cashflows.
- Investment recommendation of purchasing Put Options shows a 130% return in the upside scenario and a solid 15% in the base case.
PM Images
Investment Thesis
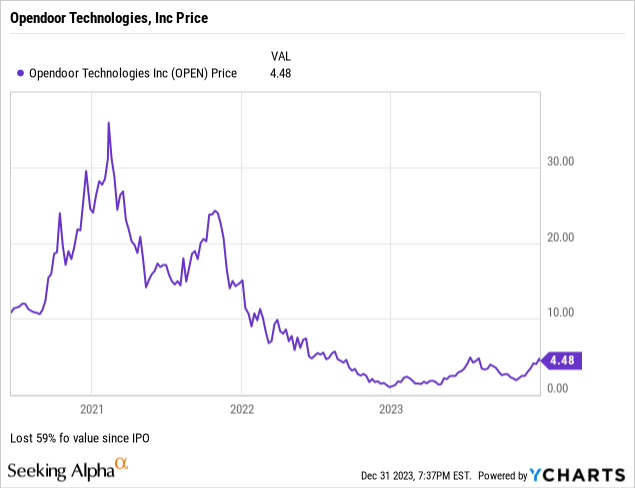
Opendoor Technologies Inc. (NASDAQ:OPEN) and Offerpad Solutions Inc. (OPAD) are the last remaining iBuyers in the market after the exit of Zillow and Redfin. Despite their share prices falling, since their IPOs, 59% and 93% respectively, they are still not cheap enough. The market has not accounted for the subtle flaw in the iBuyer business model that makes profitability highly unlikely. For this article, I will focus on OPEN (used synonymously with iBuyers). I previously conducted on a detailed analysis on OPAD found here.
No Added Value
The iBuyer business model fundamentally hinges on providing ‘quick liquidity’. The core of their approach relies on Automated Valuation Models (AVMs) to make quick cash offers. However, AVMs often suffer from inaccuracies due to limited data, constraining iBuyers to operate primarily in highly liquid markets to minimize these errors. This reveals a critical flaw that in such markets, the value proposition of iBuyers diminishes. In highly liquid markets, the unique selling point of iBuyers – offering quick cash, often at a discount – becomes less appealing, as the need for rapid liquidity is already met.
A Stanford publication , one of the few academic studies on iBuyers, made the following comment on the iBuyer business model:
iBuyers’ technology allows them to supply liquidity, but only in pockets where it is relatively least valuable.
iBuyers Add Inefficiency to the Market
iBuyers, despite their claims of streamlining home buying and selling, actually appear to introduce inefficiency into the market. The traditional process for buying and selling homes is relatively straightforward, involving the seller, listing realtor, buyer’s realtor, and the buyer. However, with iBuyers, the process becomes more complex, adding another layer of transactions.
- From Seller to iBuyer: This involves the seller, the seller’s realtor, and the iBuyer.
- From iBuyer to End Buyer: The chain here includes the iBuyer, the buyer’s realtor, and the final buyer.
This iBuyer model effectively doubles the number of transactions for a single home sale, as there is a transaction from the seller to the iBuyer and another from the iBuyer to the buyer. In contrast, the traditional method involves just one transaction.
In conclusion, while iBuyers offer rapid liquidity, they do not enhance the overall efficiency of the buying and selling process. Instead, they appear to add an additional layer of complexity to an already inefficient system.
Inflated Revenues
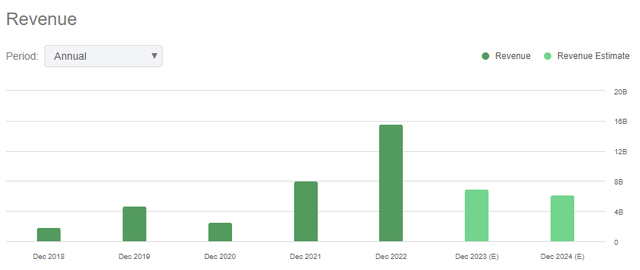
The reported revenue and growth rates (Figure 1 and Figure 2) of iBuyers can be misleading due to the method of revenue recognition. Typically, these companies recognize revenue based on the total selling price of homes. However, this doesn’t accurately reflect their core business revenue streams, which are primarily revenues from Service Fee and home price appreciation during the holding period.
Figure 1: Revenues of Opendoor Technologies Inc. (Source: Seeking Alpha)
Figure 2: Revenue and Revenue Growth of Opendoor Technologies Inc. (Created by Author from Company SEC Filings)
A more accurate measure of revenue for iBuyers would focus on these key operations. When revenue figures are recalculated to include only the earnings from service fee and the buying-selling spread, a significant change in financial performance becomes evident. The median revenue growth rate for iBuyers is actually much lower than reported, dropping from an average of 126% to a more modest 87% over the past 5 years (Figure 3 below) This adjusted figure offers a more realistic view of the financial performance of iBuyers.
Figure 3: Adjusted Revenues for Opendoor Technologies Inc. based on Service Fee and Home Price Appreciation (Created by Author from Company SEC Filings)
Earnings Lagging Behind
The iBuyer business model, while exhibiting substantial revenue growth, fails to achieve profitability (Figure 4). An analysis of Opendoor Technologies Inc.’s financial data from 2018 to 2022 illustrates this point.
Figure 4: Opendoor Technologies Profitability Ratios per Unit from 2018 to 2022 (Source: Opendoor Technologies SEC filings, Investor Presentations)
The crux of the issue is the “spread,” which is the difference between the cost to purchase a home and its selling price. For Opendoor, the average spread over the last five years was $21,000 per home (Figure 5). The spread is the margin the company has to cover their operating expenses and make a profit.
Figure 5: Opendoor Technologies Spread per Unit from 2018 to 2022 (Source: Opendoor Technologies SEC filings, Investor Presentations)
Considering the company’s average operating expenses were $42,000 per home (Figure 6), the spread falls short of covering costs, resulting in consistent losses.
Figure 6: Opendoor Technologies Operating Expenses per Unit from 2018 to 2022 (Source: Opendoor Technologies SEC filings, Investor Presentations)
No Road to Profitability
Due to the flawed business model, not only is becoming profitable impossible, negative earnings are likely to worsen due to macroeconomic conditions in addition to recent management’s decision as well.
Blaming Macroeconomics
The notion that macroeconomic conditions are responsible for the company’s negative cash flows is wrong considering that iBuyers (Opendoor and Offerpad) have been in operation for a combined 19 years in a mostly bull real estate market (Figure 7) and favorable macroeconomic conditions. If the business model were viable, it would have shown profitability by now.
Data provided by Redfin, a national real estate brokerage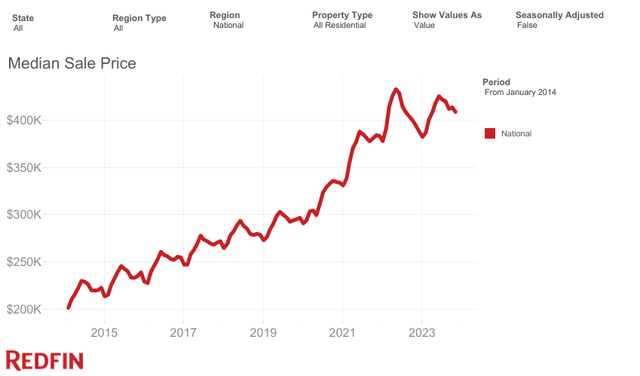
Figure 7: Steady Rise in U.S. Median Home Prices from 2014 to 2023, Reflecting a Prolonged Bull Market in Residential Real Estate (Data provided by Redfin, a national real estate brokerage.)
Unit Economics are the Problem
At the core of its consistent negative earnings is their inability to generate a large enough ‘Spread’ to cover operating expenses, let alone generate a profit. This ties back to the flawed business model. iBuyers must operate in liquid markets and thus are unable to buy homes at a discount or sell them at a premium, leading to narrow margins and consistent negative earnings.
Added Expenses
The company’s reliance on traditional methods for selling inventory and debt financing for cash offers adds substantial costs that quickly erode any margin for profit. They incur holding expenses on inventory, marketing expenses when selling inventory and additional interest expenses due to the use of debt to fund cash offers.
Lack of Economies of Scale
The iBuyer business model lacks economies of scale, Meaning that scaling up operations does not lead to cost savings on a per unit basis. Despite a significant scale, from purchasing 7,410 homes in 2018 to about 40,000 in 2022 (Figure 8), the company’s profitability ratios have not improved.
Figure 8: Home Sales and Profitability Ratios for Opendoor Technologies Inc. from 2018 to 2022 (Created by the Author)
Low Demand for iBuyer Service
The demand for iBuyers’ services is low evidenced by the $62 million FTC fine for deceptive marketing. This ties back to the Business Model which is limited to highly liquid real estate markets.
AVM “Tech” Accuracy Won’t help you
Even if iBuyers reach 100% accuracy in pricing homes using their Automated Valuation Models (AVMs), they would still struggle to achieve profitability. AVMs cannot predict future home prices and market trends.
Zillow and Redfin’s Market Exit
The exit of Zillow and Redfin from the iBuyer market is a significant indicator of a flawed business model. Both companies, which had entered this space with sub-brands Zillow Offers and RedfinNow, had stronger potential for profitability given their positions as leading marketplaces for home buyers and sellers.
To sum up, I believe the company’s inability to achieve profitability stems from fundamental flaws in its business model. To reach a profitable state, it would need to significantly increase its margins, either by buying homes at steep discounts or selling them at premium prices, both of which seem unlikely. This inherent problem has resulted in consistent losses throughout the company’s history.
Insiders Selling Out
A notable trend with iBuyer companies is the liquidation of positions by insiders. This pattern of insiders, including the initial SPAC investors, selling their shares raises a red flag concerning the company’s future.
- Opendoor Co-founder Ian Wong liquidated his entire position in the company earlier this year.
- Opendoor Co-founder and President Eric Wu liquidated ~47% of his position over the last 12 months.
Figure 9: Opendoor Insider liquidation of position (Source: Financial data and analytics provider FactSet)
Valuation
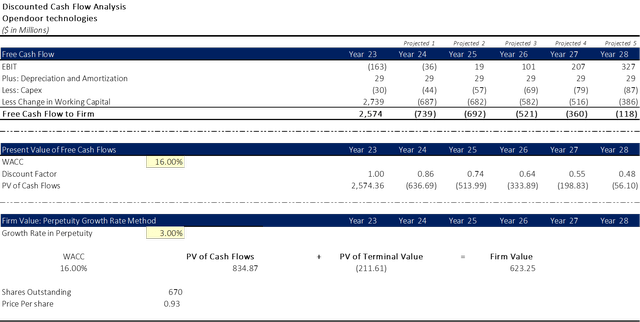
My base case analysis used a discount rate (WACC) of 16% and a Terminal FCF growth rate of 3%, leading to an implied share price of $0.93/share (Figure 10). With a current share price $4.50/share, OPEN seems to be significantly overpriced.
Figure 10: Discounted Cash Flow Analysis of Opendoor Technologies (Created by Author)
My analysis shows an implied share price for Opendoor of around $1, which is substantially lower than the consensus target of $3.06. I believe the market hasn’t fully accounted for the company’s flawed business model. However, this has begun to change, with analysts downgrading their positions to ‘sell’ or ‘hold’ ratings. The reason for this delay is the company’s initial perception as a Tech Company and thus as a growth stock, expected to generate increasing positive cash flows as it scaled, which made consistent negative cash flows more tolerable. A closer look would show that OPEN does not have a lot of levers to pull to fine-tune its operations and reach profitability.
Assumptions
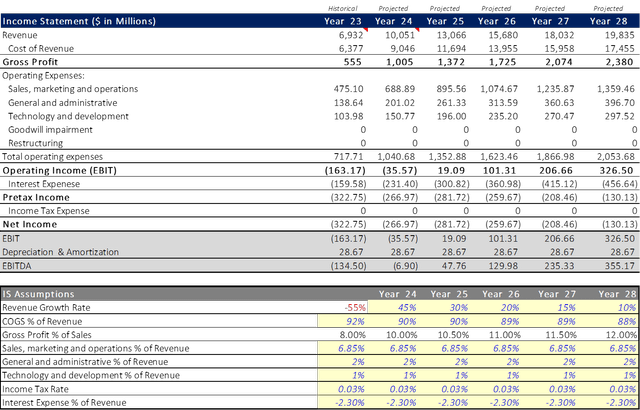
- Revenue Growth for 2023: Based on consensus forecasts and company guidelines.
- Revenue Growth from 2024 to 2028: Set at 45% in 2024, decreasing to 10% in FY28.
- Cost of Revenue: Initially set at 92% for FY23, gradually reducing to 88% by FY28, aligning with the company’s goal to control costs.
- Operating Expenses: Projected based on historical averages from 2019 to 2023.
Figure 11: Income Statement Projections and Assumptions (Created by Author)
Weighted average Cost of Capital (WACC)
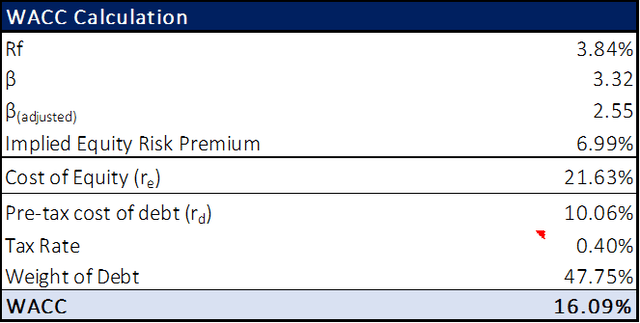
In calculating the Weighted Average Cost of Capital (WACC) for Opendoor Technologies, I determined a WACC of 16.00% (Figure 12) based on the following inputs:
- Risk-Free Rate (3.90%): This was based on the yield of 5-Year Treasury Bonds.
- Beta (2.55): The 24M raw beta was 3.32, adjusted due to the high volatility to better represent future beta.
- Implied Equity Risk Premium (7.00%) and Cost of Equity (21.63%): Captures the additional risk of investing in the company’s equity over a risk-free investment, indicating a high-risk profile. Calculated using the Capital Asset Pricing Model (CAPM)
- Pre-tax Cost of Debt (10.06%): based on YTM for company bonds.
- Tax Rate (0.40%): Based on the company’s average tax rate over the past five years
Figure 12: Calculation of WACC for Opendoor Technologies Inc. (Created by Author)
Catalysts
The current market valuation fails to reflect the intrinsic flaws with Opendoor’s business model. This mispricing is poised for correction with the upcoming release of the Q4 2022 and annual FY2022 financial results, which are expected to show worsening profitability. Further compounding this situation could be impending regulatory changes targeting institutional investors.
Worsening Earnings Ahead
Management is moving in a direction that will most certainly worsen earnings. In Opendoor’s most recent earnings call, CEO, Carrie Wheeler stated the following concerning costs and Spread:
Throughout 2023, we made cost structure and pricing accuracy improvements and passed those through to spread reductions, which in turn enabled us to increase acquisitions quarter-over-quarter.
These changes have not done anything and the company’s profitability ratios seem to be in line with historical values.
Figure 13: Quarterly Profitability Ratios for Opendoor Technologies Inc. (Created by Author)
The company’s strategy to narrow the spread in exchange for higher volume doesn’t address the core issue of profitability. It will actually worsen profitability if home prices plateau or depreciate. Worsening earnings are likely to be evident in the Q4 results and the annual 10K report, anticipated in February of 2024.
Legislation Regarding Institutional Investors/Buyers
Recently, congress introduced two separate bills that aim to “Take Wall Street Out of the Housing Market.” Institutional buyers represent a very important customer for iBuyers as they are significant buyers of single-family units. According to CoreLogic, “In March 2023, investors accounted for 27% of all single-family home purchases; by June, that number was almost unchanged at 26%.”
Another interesting article by Bloomberg shows how Wall Street is using tech companies to buy up homes. Interestingly enough, Institutional Investors (BlackRock, Vanguard, SSgA Management) all hold stakes in both iBuyers (Opendoor and Offerpad) and Institutional Buyers such as Invitation Homes (INVH), American Homes 4 Rent (AMH), and Tricon Residential (TCN). BlackRock is an early investor for both Opendoor (S-1 Form) and Offerpad (S-1 Form), which could be a strategic move to help accelerate the home acquisition process. Whatever the case may be regulations against Institutional Investors is sure to have a negative effect on iBuyers.
Risk to the Thesis:
My thesis on the declining value of the stock could be challenged if favorable macroeconomic conditions emerge, characterized by a shift in Federal Reserve policy. The consensus among economists is that the Fed’s interest rate hikes have reached their peak, and the current 5.25% rate set in 2022-23 is anticipated to begin reversing in the latter half of 2024. Despite this, any potential interest rate cuts are expected to be modest and unlikely to significantly improve profit margins. Therefore, any resultant increase in the stock’s share price should be relatively contained, thus limiting the downside risk.
An additional concern is the potential increase in aggressive institutional buyers. These buyers are crucial for iBuyers as they facilitate quick inventory turnover, improving margins. In June, institutional buyers accounted for 27% of single-family home purchases and are thus significant players in the market. However, given the current macroeconomic conditions, this percentage is unlikely to rise.
Conclusion and Investment Strategy:
I recommend a Strong SELL for the two remaining iBuyers Opendoor Technologies Inc. (OPEN) and reaffirm by previous strong cell position for Offerpad Solutions Inc. (OPAD). The market is not adequately pricing in the fundamental flaws of the iBuyer model which makes reaching profitability highly unlikely. The imminent re-pricing of these securities is anticipated due worsening earning that will show in Q4 results and annual 10K anticipated in February of 2024.
Investment Strategy:
I project Opendoor’s stock will hit a target price of $1 per share in first half of 2024, undercutting the consensus estimate of $3/share due to a flawed business model with limited profitability. To avoid the significant risks of short selling in a volatile market, I suggest the following strategies:
- A portfolio of put options is a secure strategy that caps potential losses.
- Alternatively, combining short positions with call options to hedge against increase risk, ensuring a break-even outcome in the base case and a 20% gain if the stock price falls.
- For those willing to accept more risk for higher potential returns, shorting the stock with leveraged put options yields even greater returns, especially if the price drops to $2.
The May expiration (Figure 15) options are preferable, offering higher returns than the August ones (Figure 16), albeit with increased risk. The strategy assumes the stock price will start to decline in February reaching a nadir sometime in mid-April.
Figure 15: Short Sell Strategy of Opendoor Technologies Inc. (Created by Author)
Figure 16: Short Sell Strategy of Opendoor Technologies Inc. (Created by Author)
I rarely have this much conviction regarding equities, however, the evidence against iBuyers in general and more specifically, Opendoor, is overwhelming. I encourage readers and investors to engage in “Reductio ad absurdum” by exploring contrary scenarios to derive their own insights and conclusions.
Editor’s Note: This article was submitted as part of Seeking Alpha’s Top 2024 Long/Short Pick investment competition.
Analyst’s Disclosure: I/we have no stock, option or similar derivative position in any of the companies mentioned, and no plans to initiate any such positions within the next 72 hours. I wrote this article myself, and it expresses my own opinions. I am not receiving compensation for it (other than from Seeking Alpha). I have no business relationship with any company whose stock is mentioned in this article.
Seeking Alpha’s Disclosure: Past performance is no guarantee of future results. No recommendation or advice is being given as to whether any investment is suitable for a particular investor. Any views or opinions expressed above may not reflect those of Seeking Alpha as a whole. Seeking Alpha is not a licensed securities dealer, broker or US investment adviser or investment bank. Our analysts are third party authors that include both professional investors and individual investors who may not be licensed or certified by any institute or regulatory body.

