Summary:
- The management team has proven our OPEN investment thesis, attributed to the moderation of its acquisition pace and highly liquid balance sheet.
- Thanks to the sustained R&D efforts, we are already seeing notable improvements in its operating efficiency and spreads between offer/ selling prices.
- OPEN’s new inventories have recorded excellent gross margins of 14.4% and contribution margin of 10.6% in FQ2’23, compared to the overall contribution margins of -4.6%.
- The market sentiments appear to have bottomed here, with the existing home sales in July 2023 already nearing the historical bottom during the 2008 recession and March 2020 pandemic period.
- Assuming that OPEN is able to demonstrate its proof of concept during these times of post-pandemic housing crisis, we believe that its tailwind may be highly promising once the uncertain macroeconomic outlook lifts.

Mohammed Haneefa Nizamudeen
The OPEN Investment Thesis Seems Promising At This (Potential) Bottom
We previously covered Opendoor Technologies (NASDAQ:OPEN) in June 2023, discussing its mixed prospects.
On the one hand, it remained to be seen how the nascent iBuying company might perform, attributed to the property market’s highly cyclical nature, worsened by the elevated interest rate environment.
On the other hand, the management had demonstrated stellar inventory management and operating efficiency, while boasting a $10.7B of credit facility at a time of tightened lending environment post-banking meltdown.
As a result of these promising developments, we had rated the OPEN stock as a speculative Buy then.
For now, it appears that we have been proven right, with OPEN continually scaling back its acquisition pace in order to manage its risks and liquidity in the latest quarter. This is on top of the highly efficient marketing cadence, resulting in the growth of its registered consumer base/ brand awareness while reducing its variable expenses by nearly -80% YoY.
These efforts have directly translated to the moderation in its adj operating expenses to $78M (-22% QoQ/ -61.7% YoY) by FQ2’23, significantly attributed to the faster sell-through rates and lower inventory holding expenses.
At the same time, OPEN appears to be maintaining its R&D efforts with $38M reported in the latest quarter (-5% QoQ/ -7.3% YoY), as an attempt to improve the accuracy of its pricing model. These efforts are not in vain indeed, since we are already seeing notable improvements in its spreads between offer and selling prices.
For example, its new inventories have recorded excellent gross margins of 14.4% and contribution margin of 10.6% in FQ2’23. This is compared to the overall contribution margins of -4.6% (-14.7 points YoY) at the same time, mostly attributed to the older inventories’ write down.
In addition, most of OPEN’s older homes, previously acquired between March and June 2022, have already been sold off, with the inventory on balance sheet also drastically reduced to $1.14B (-45.9% QoQ/ -82.7% YoY) by the latest quarter.
The management also guides improved spreads in H2’23, with 2.68K of its homes or the equivalent of 75.3% of its current inventories likely to “deliver healthier risk adjusted contribution margins.”
As a result, the worst may already be over for OPEN, potentially signaling improved profitability ahead.
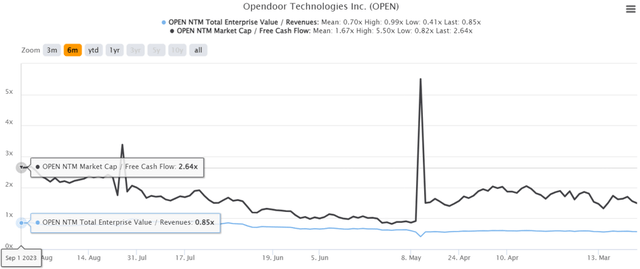
OPEN 6M EV/Revenue and Market Cap/ FCF Valuations
S&P Capital IQ
For now, the same optimism has been observed in the OPEN stock’s valuations, with NTM EV/ Revenues of 0.85x and NTM Market Cap/ FCF of 2.64x, elevated compared to its 1Y mean of 0.66x/ 0.98x, respectively.
However, if we are to compare against the Real Estate Management/ Development sector’s median Market Cap/ FCF of 8.89x, it appears that the stock is still not overly valued for now.
Consensus Forward Estimate
Tikr Terminal
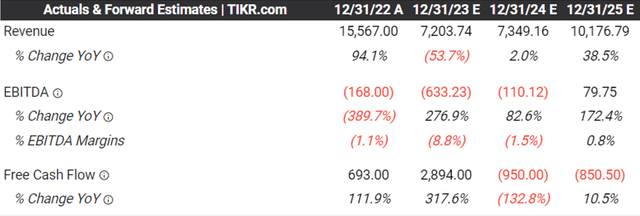
This is because OPEN has already generated FQ1’23 Free Cash Flow of $2.51B (+54.8% QoQ/ +39.9% YoY) and FQ2’23 of $931M (-56.7% QoQ/ +148.9% YoY).
While it remains to be seen how H2’23 may develop, the consensus estimates already expect the company to generate FY2023 FCF of $2.89B (+317.6% YoY). Based on its current share count of 667.16M, we are looking at a Free Cash Flow per share of $4.33.
Combined with its normalized Market Cap/ FCF valuation, the OPEN stock appears to be trading below its fair value of $4.24 indeed.
On the one hand, Mr. Market appears uncertain if the company is able to sustain this cadence, attributed to the underwhelming consensus estimates for FY2024 and FY2025.
On the other hand, we are cautiously optimistic that OPEN may still be able to report positive FCF profitability ahead, attributed to the improving contribution margins despite the tight market inventory.
The management has also offered an optimistic FQ3’23 guidance with revenues of $975M (-50.6% QoQ/ -70.9% YoY) and adj EBITDA of -$65M (-61.3% QoQ/ -69.1% YoY) at the midpoint. These numbers imply adj EBITDA margins of -6.6% (+1.9 points QoQ/ -0.3 YoY), drastically improved compared to the FQ4’22 levels of -12.3%.
Assuming that OPEN is able to demonstrate its proof of concept during these times of post-pandemic housing crisis, we believe that its tailwind may be highly promising once the uncertain macroeconomic outlook lifts, interest rates moderate, and the housing market normalizes.
So, Is OPEN Stock A Buy, Sell, or Hold?
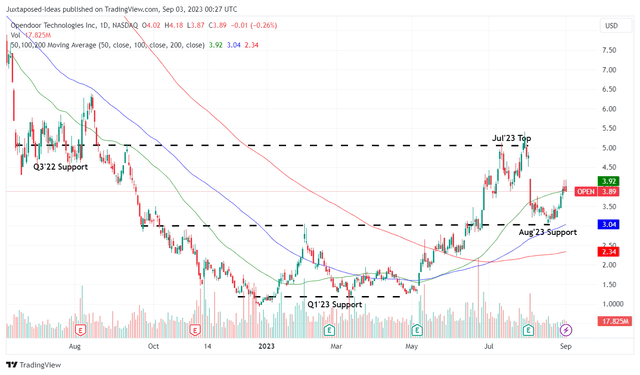
OPEN 1Y Stock Price
Trading View
For now, the OPEN stock has returned much of its recent July 2023 gains, with it remaining well supported at the August 2023 levels of $3. The market analysts have also priced in a rate freeze in the upcoming FOMC meeting and the Fed pivot by 2024.
Therefore, while the 30Y National Fixed Rate Mortgage Average is still highly inflated at 7.18% (+0.37 points MoM/ +1.52 YoY) by August 31, 2023, compared to the 2019 averages of 3.8%, we believe that the peak may already be here, consequently easing the borrowing costs.
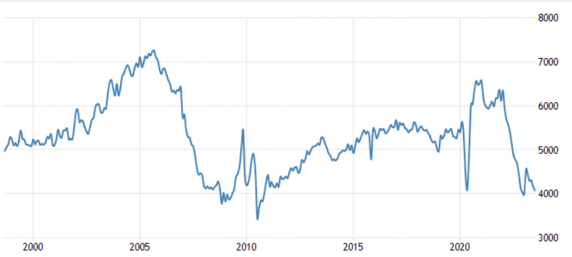
Historical Home Sales In The US
Trading Economics
In addition, the market sentiments appear to have bottomed here, with the existing home sales in July 2023 already nearing the historical bottom during the 2008 recession and March 2020 pandemic period.
With most of the pessimism already baked in, resulting in a highly attractive risk reward ratio, we continue to rate the OPEN stock as a Buy here.
Purchase Application Payment Index In The US
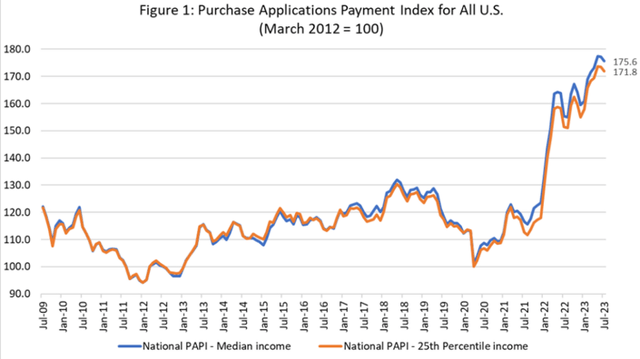
Mortgage Bankers Association
Then again, OPEN investors need to note the eye-watering Purchase Applications Payment Index [PAPI] of 175.6x by July 2023 (-0.9% MoM/ +13% YoY), compared to the 2008 recession levels of 122x and March 2020 levels of 100x.
With the higher ratio being “indicative of declining borrower affordability conditions,” we may see the housing market remaining volatile for a little longer, further delaying OPEN’s recovery.
Combined with the company’s lack of projected profitability through FY2024, the stock is only suitable for investors with higher risk tolerance and patient investment trajectory.
Analyst’s Disclosure: I/we have no stock, option or similar derivative position in any of the companies mentioned, and no plans to initiate any such positions within the next 72 hours. I wrote this article myself, and it expresses my own opinions. I am not receiving compensation for it (other than from Seeking Alpha). I have no business relationship with any company whose stock is mentioned in this article.
The analysis is provided exclusively for informational purposes and should not be considered professional investment advice. Before investing, please conduct personal in-depth research and utmost due diligence, as there are many risks associated with the trade, including capital loss.
Seeking Alpha’s Disclosure: Past performance is no guarantee of future results. No recommendation or advice is being given as to whether any investment is suitable for a particular investor. Any views or opinions expressed above may not reflect those of Seeking Alpha as a whole. Seeking Alpha is not a licensed securities dealer, broker or US investment adviser or investment bank. Our analysts are third party authors that include both professional investors and individual investors who may not be licensed or certified by any institute or regulatory body.
