Summary:
- Palantir’s technical analysis is overwhelmingly positive, with strong charts, accelerating bullish momentum in moving averages, and bullish indicators in both daily and weekly time frames.
- Despite strong earnings, Palantir’s valuation appears significantly overvalued, with P/S and P/E ratios near or at all-time highs, not justified by current growth rates.
- The stock’s revenue growth is moderate, and EPS growth has slowed, clashing with its high valuation multiples, indicating a disconnect between fundamentals and stock price.
- Given the divergence between bullish technicals and overvalued fundamentals, I downgrade Palantir to a hold rating, suggesting caution for investors.
hapabapa
Thesis
Back in October, I reiterated my buy rating on Palantir Technologies Inc., (NYSE:PLTR) stock, and it has surged over 65% since that call. From my technical analysis below, I determine that the technicals could not be better as charts, moving averages, and indicators in both the daily and weekly time frames indicate a strong outlook. Note that a long term monthly analysis has not been provided, as Palantir only went public in 2020. The fundamental analysis clashes with the technicals, however, as I determine that the stock’s valuation has a disconnect with the company’s growth rates. While revenue growth is moderate and EPS growth has slowed, the P/S ratio is at all-time highs and the P/E ratio is closing in on its all-time high as well. Even though the business itself is very strong, I conclude that the stock is significantly overvalued, as the stock seems to have gotten ahead of itself. Therefore, it is really a tale of two cities, with the technicals showing that there may be room to run, while the fundamental analysis shows that the stock has already run too far. Since these two sides highly disagree on the outlook for the stock, I downgraded Palantir to a hold rating.
Daily Analysis
Chart Analysis
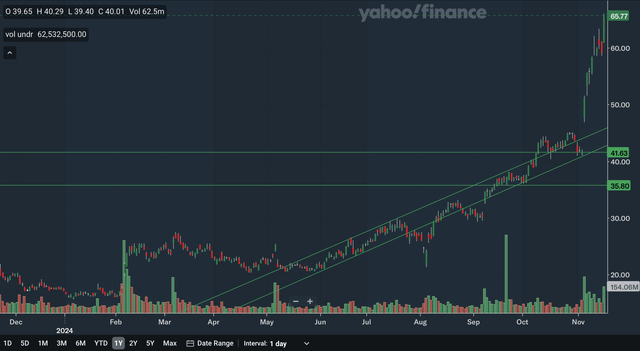
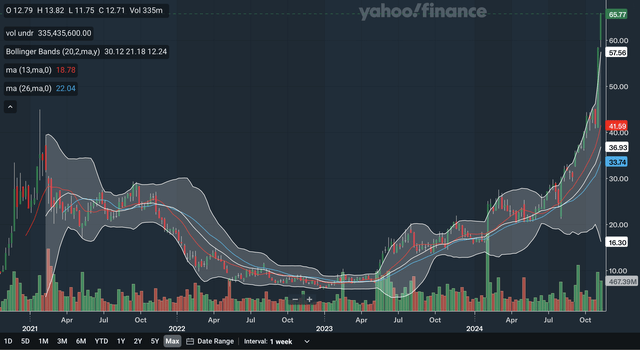
There is not much to complain about on Palantir’s daily chart, as there is no resistance to speak of. The only negative here is that support is relatively distant, as the stock has surged incredibly this month so far. The stock truly broke out of a channel early this month, and the stock has not looked back. The upper channel line is the closest source of support, as it has moved above 45. The lower channel line would be the next area of support, it has already surpassed 40. Despite the lower channel line being broken on two occasions this year, I would still consider it valid as both were false breakdowns and this line proved to be support even after these breakdowns occurred. We also have an upside gap at around 41 that could be support if the stock slumps. Lastly, there is also support in the mid-30s, as that area was a significant consolidation zone back in September and early October. Overall, I would say that the daily chart is a positive one even though support is relatively distant, as there are really no bearish indications here.
Moving Average Analysis
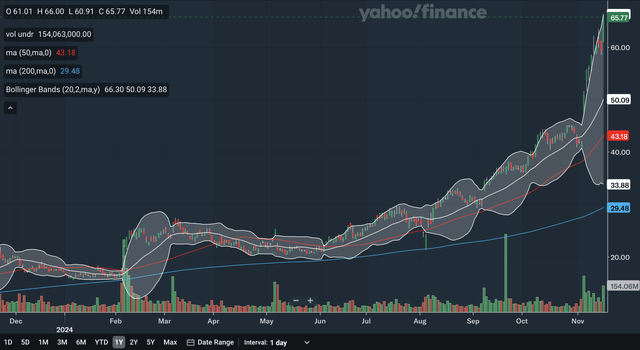
There has been no crossovers between the 50-day SMA and the 200-day SMA in the past year, with the 50-day SMA remaining on top the entire time, an indication of sustained bullish momentum. As of late, the gap between the two SMAs has widened significantly, with the 50-day SMA pulling away with an increasingly strong upward trajectory, showing that bullish momentum is, in fact, accelerating. The stock currently trades miles above the SMAs with the 50-day SMA’s support at only 43, but it is rising fast. For the Bollinger Bands, the stock is currently trading right at the upper band, showing that it could be overbought. However, during its entire November surge, the stock has been consistently at the upper band, showing that this signal is no reason to believe the stock can’t keep advancing. Instead, this shows that the bulls have been relentless and that we have sustained bullish momentum. The 20-day midline of the Bollinger Bands is the nearest MA support, as it is now at 50 and rising quickly. In my view, it is clear that these MAs are highly bullish, as there are no signs of weakness in sight.
Indicator Analysis
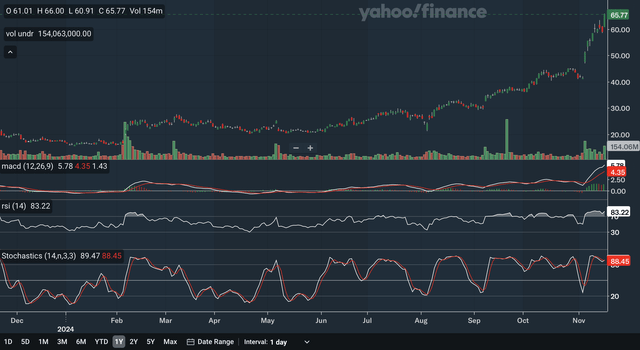
The positivity continues into the daily indicators. The MACD crossed above the signal line earlier this month, a bullish indication. After briefly narrowing, the gap between the two lines have started to widen again, showing renewed bullishness in the stock recently. The MACD is at its highest level in the past year, confirming the stock’s run to all-time highs. For the RSI, it is currently at 83.22 which is an overbought level. However, stocks can remain overbought for extended periods of time, as demonstrated by Palantir’s RSI from September to present day. The RSI also confirms the recent surge, as it too recently set a one-year-high. For the stochastics, the %K just crossed above the %D, a bullish signal. This comes after a bearish crossover earlier in the month, but the stochastics never dropped below the 80 mark, meaning that the bearish signal was weak. As a whole, the daily indicators are overwhelmingly bullish, as all three of these key indicators are flashing green flags.
Takeaway
With all three of the daily analyses indicating a strong outlook, it is clear that Palantir’s near term is highly bullish. The chart shows that despite support being relatively far away, the stock is in an accelerated uptrend as it has broken out of an upward channel. The MAs show accelerating bullish momentum, with the Bollinger Band’s midline acting as the nearest support. Lastly, as discussed above, the indicators were all positive as well.
Weekly Analysis
Chart Analysis
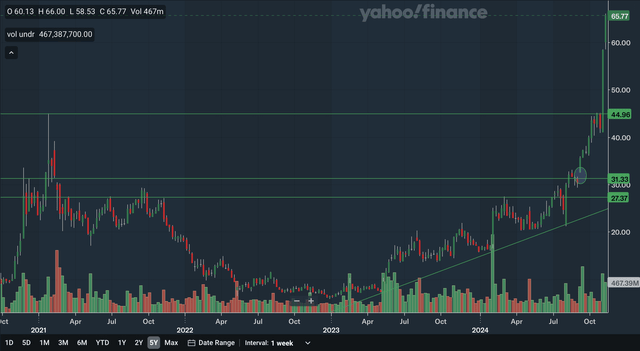
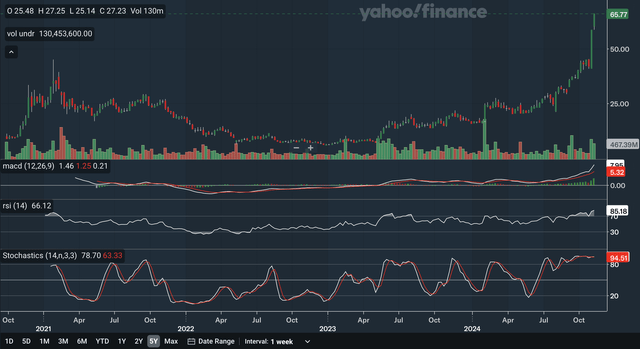
The weekly chart is another positive one as once again there are no resistance levels to speak of. The stock recently broke the last remaining resistance level at the 2021 peak. That area is therefore now the closest level of support at around 45. During the latest rally, the stock actually stalled at this level before breaking out, increasing the significance of this support level even further. The other support levels are quite distant. There is an upside gap at around 31 which is particularly significant as it is on a weekly chart. We also have support in the high 20s, with that price level being resistance on many occasions in Palantir’s trading history. Lastly, there is an uptrend line that dates back to early 2023 that is in the mid-20s currently and rising. Although the stock is in an accelerated near term uptrend, this trend line on the weekly chart also shows the stock remains in a longer-term uptrend as well. Overall, the weekly chart is another positive for the stock as again, there are no bearish indications here.
Moving Average Analysis
The 13-week SMA had a bullish crossover with the 26-week SMA back in early 2023 and since then, the stock has surged to say the least. The gap between the two is currently widening as the 13-week SMA’s trajectory is taking off, again reflecting accelerating bullish momentum. The stock also trades high above these weekly MAs with the 13-week SMA’s support at around 41 currently. As for the Bollinger Bands, the stock is currently far above the upper band, indicating that it is indeed overbought in the longer time frame. The stock is currently at its highest level above the upper band in its history. The 20-week midline’s support is in the mid-30s and is rising fast as well. From my analysis, the weekly MAs generally show a positive longer term for Palantir, but the Bollinger Bands does show that the stock may be subject to a near term pullback as its surge high above the upper band indicates that the stock may have gotten slightly ahead of itself.
Indicator Analysis
The MACD crossed above the signal line earlier this year, a bullish indication. Currently, the gap between the lines is at is the most extreme level in the stock’s trading history as the MACD accelerates its upward trajectory, indicating very strong bullish momentum in the stock. The weekly MACD also confirms the recent run to all-time highs as it records it’s by far the highest level ever. For the RSI, it is currently at 85.18 showing that the bulls are firmly in control of the stock. The RSI also confirms the recent all-time high, as it to set its highest level ever. For the stochastics, the %K is currently above the %D, with no meaningful crossover in the past few months. The stochastics has remained in the 80 zone since the middle of the year, indicating that the bullish momentum has been sustained. Overall, it is hard to argue that the long term isn’t bullish for Palantir, as all three key weekly indicators show strong signs of strength in the stock.
Takeaway
The longer-term technical outlook for Palantir is highly positive, with all three weekly analyses indicating a strong future for the stock. The chart shows the stock has broken through the last remaining resistance level. Like the daily MAs, the weekly MAs also show accelerating bullish momentum. Lastly, the indicators all showed significant signs of strength in the latest surge. The only negative in the entire weekly analysis is the overbought Bollinger Bands signal, that could indicate a potential short-term pullback before the resumption of the upward climb for the stock.
Fundamentals & Valuation
Earnings
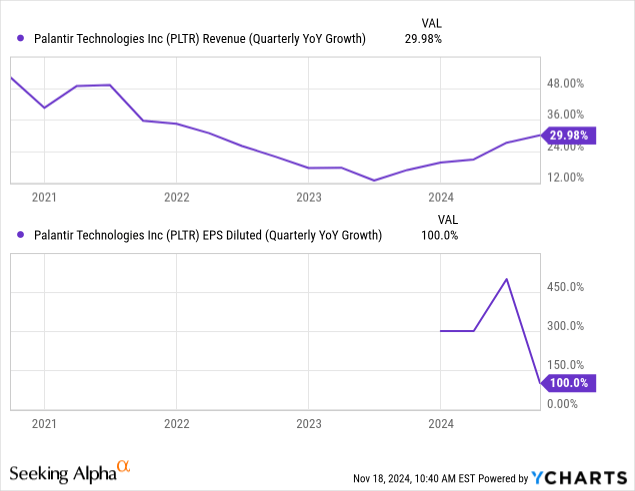
Palantir released their 2024 Q3 earnings earlier this month and showed strong results. They reported revenues of $726 million, an increase of 30% YoY. An important figure is their U.S. commercial revenue that saw 54% YoY growth to $179 million, indicating that their diversification from government revenue streams is playing out well. Palantir reported a GAAP EPS of $0.06, up 100% YoY. Both revenue and EPS beat expectations, with revenue beating by $21.82 million and EPS beating by $0.02. However, as you can see in the charts above, these results are not too extraordinary compared to Palantir’s history. Revenue growth is below levels seen back in 2020 and 2021 while EPS growth of 100% actually represents a slowdown in growth for Palantir. Other highlights in their earnings include the fact that they closed 104 deals over $1 million in the quarter and their customer count growing by an impressive 39% YoY.
In other news, CNBC recently reported that Palantir is moving its stock listing over to the Nasdaq exchange. Board member Alexander Moore reportedly posted on X saying that this move could “force” ETFs to buy billions of dollars in Palantir stock. Last Friday, the stock surged 11% as the result of this news, indicating strong investor optimism in Palantir’s latest move.
Valuation
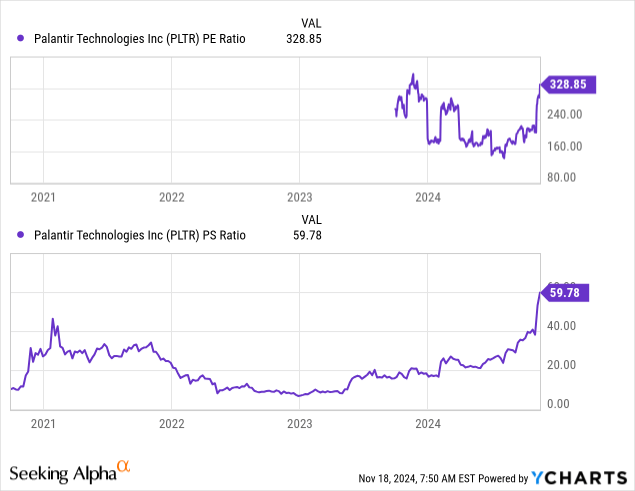
The P/E ratio is currently quite high compared to the past year, while the P/S ratio is at all-time highs. The P/E ratio is currently at 328.85, still slightly below the 2023 peak, but is much higher than levels of under 160 seen earlier this year. As for the P/S ratio, it is currently at 59.78, far above the 2021 peak of near 50. Let’s compare these valuation multiple charts with the growth charts above. For the P/E ratio, I would say that it indicates that the stock is quite overvalued. While the P/E is near all-time highs, EPS growth has dropped to its lowest level since earnings became positive for Palantir. Even though growth is still very strong at 100% YoY, it is still a material deceleration from the growth of the past few quarters. As for the P/S ratio, while revenue growth is quite moderate by historic standards, the ratio is at an all-time high. Therefore, the P/S also suggests the stock is significantly overvalued, as the current growth rate is not able to justify such a high level in the P/S ratio. Overall, I believe it is clear that the stock’s valuation has gotten ahead of its fundamentals. Seeking Alpha currently has an F valuation rating on Palantir, confirming my evaluation that it is now highly overvalued.
Conclusion
As I said in the beginning, it is a tale of two cities with Palantir stock. The technicals were overwhelmingly positive, with basically nothing to dislike in both the daily and weekly time frames. Charts were strong with no resistance, moving averages showed accelerating bullish momentum, and indicators confirmed the latest surge in the stock. This is highly contrasted with the fundamental analysis, however. While earnings results remain strong and are respectable, revenue growth is not spectacular and EPS growth has slowed considerably. This comes as the P/S ratio is at all-time highs and the P/E ratio nears its all-time high. Current growth rates cannot justify these valuation multiples, leading me to believe the stock is very overvalued. Therefore, Palantir has highly bullish technicals, but the fundamentals indicate the stock has gotten ahead of itself. Since these two sides of analysis diverge on the outlook for Palantir stock, I believe a downgrade to a hold rating is appropriate at this juncture.
Analyst’s Disclosure: I/we have no stock, option or similar derivative position in any of the companies mentioned, and no plans to initiate any such positions within the next 72 hours. I wrote this article myself, and it expresses my own opinions. I am not receiving compensation for it (other than from Seeking Alpha). I have no business relationship with any company whose stock is mentioned in this article.
Seeking Alpha’s Disclosure: Past performance is no guarantee of future results. No recommendation or advice is being given as to whether any investment is suitable for a particular investor. Any views or opinions expressed above may not reflect those of Seeking Alpha as a whole. Seeking Alpha is not a licensed securities dealer, broker or US investment adviser or investment bank. Our analysts are third party authors that include both professional investors and individual investors who may not be licensed or certified by any institute or regulatory body.

