Summary:
- Palantir remains a buy despite overbought signals, with strong support levels and bullish technical indicators suggesting continued upward momentum after consolidation.
- Daily and weekly chart analyses show minimal resistance and significant support, reinforcing the bullish outlook for Palantir’s stock.
- Palantir’s valuation is justified by strong financial results, positive EPS, and promising AI growth prospects, despite high P/S and P/CF ratios.
- Mixed signals from indicators suggest near-term weakness, but overall, the technical and fundamental analyses support a continued bull run.
JHVEPhoto
Thesis
In an article written around a year ago, I initiated Palantir Technologies Inc. (NYSE:PLTR) at a buy rating and the stock has advanced over 100% since then. I had correctly called Palantir an AI bargain. Today, while no longer at bargain levels, I still believe it is a buy as the near term and intermediate term technical analyses show that there is still room to run for Palantir. Note that a longer term monthly analysis has not been provided, as Palantir has only been a public company for a few years. Despite some indications of being overbought currently, in my view, Palantir is likely to stage an upward breakout following a short-term pause for consolidation. From the analysis below, it is determined that Palantir has a net positive technical outlook while being relatively fairly valued in terms of its P/S and P/CF ratios. Therefore, I believe despite surging in the past year, Palantir is still worth buying at current levels.
Daily Analysis
Chart Analysis
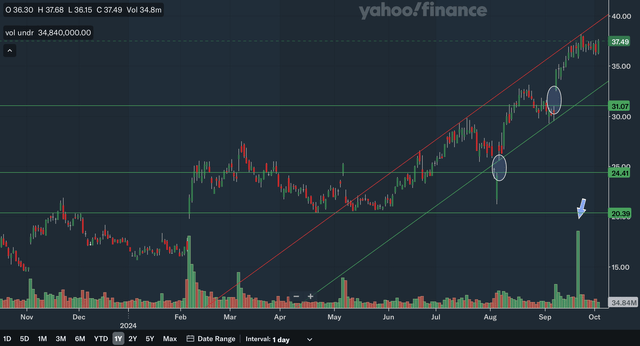
A look at the daily chart shows that there is plenty of support under Palantir’s stock, while there is minimal resistance. The only resistance identified above is the upper channel line that has been resistance since May of this year. The bottom channel line began in August and is the closest area of support in the mid-30s zone currently, and is rapidly rising. The next area of support is in the low thirties. I have circled the gap at that level for you, as the bottom of the gap will likely act as support. Moving down, there is another gap that I have circled, and so the mid-20s zone would be the next zone of support. Lastly, I believe the low 20s area would also be support as that level has acted as support 3 times this year and has previously acted as resistance back in 2023. I have also drawn an arrow pointing to the overwhelming positive volume that took place in September. Although the price movement during that day was relatively small, I believe it demonstrates that the bulls are clearly in control, as it is the highest volume we have seen in the past year. Overall, in my view, the short-term chart analysis shows a positive technical outlook for Palantir since resistance is minimal with the upper channel line rapidly advancing.
Moving Average Analysis
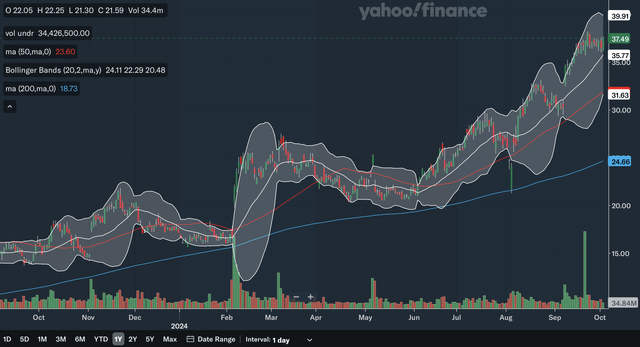
The short-term moving averages show the bulls are clearly in control as well. The 50-day SMA has been above the 200-day SMA for the entirety of the past year, showing that not once has the bears been strong enough to create any lasting downtrend. Currently, the 50-day SMA is widening the gap with the 200-day SMA, showing the near term uptrend is accelerating and shows no signs of ending. However, the stock is trading above both of the moving averages by a wide margin, showing that it may be slightly overbought currently as traders may take profits. Furthermore, Palantir hit the upper band of the Bollinger Bands in September, showing it was a bit overbought as well. However, currently, the stock sits just above the 20-day centre line of the Bollinger Bands and that line acts as support in an uptrend. Therefore, there is solid support for Palantir in the mid-30s zone. The current narrowing of the Bollinger Bands could indicate that there will be a period of relatively low volatility and dormancy for Palantir before it breaks out again, making now a great time to buy or to add to positions. Overall, I believe a look at the daily moving averages clearly demonstrates that Palantir’s bull run is intact and in fact, it is accelerating. It may be slightly overbought in the near term and needs some time to consolidate, but make no mistake, Palantir is set to break its 52-week highs.
Indicator Analysis
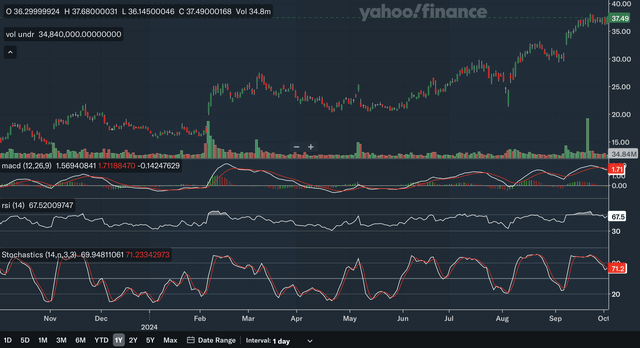
A look at the indicators at the daily level shows that in the past few weeks, the bullish momentum has receded a bit. This is not too surprising, given that we came to the conclusion that Palantir may be slightly overbought in the near term. For the MACD, it broke below the signal line just very recently, flashing a near term bearish signal. However, the more important signal given by the MACD is its confirmation of this year’s uptrend. As Palantir hit new peaks in July, August, and September, the MACD confirmed all three new highs with higher peaks of its own. This confirmation shows that this rally is sustainable and likely to continue. For the RSI, it is currently sitting at 67.5 which is near an overbought level. It has receded from an overbought level in September, showing that the stock has cooled off. The RSI did confirm the recent September peak, as the RSI hit the highest level since February. Lastly, for the stochastics, it also shows some near term weakness as the %K line broke below the %D line within the overbought 80 zones, flashing a bearish signal. Very recently, however, the %K has closed the gap with the %D significantly and is extremely close to being in a bullish crossover. Therefore, the bearish signal flashed in September could soon be voided. Overall, a short-term indicator analysis paints a mixed picture for Palantir. The indicators show that there is indeed some near term weakness as they hit overbought levels in September, but at the same time, the key indicators also confirm the bull run of the past few months as there has not been divergence from the stock.
Daily Analysis Takeaway
I believe the near term bullish outlook for Palantir remains highly intact, despite some very near term weakness. As demonstrated by the strong trend line, the close support of the Bollinger Band centre line, and the confirmation of the bull trend by the MACD and RSI, Palantir’s bull run still has momentum. It is likely just taking a pause and consolidating, as it has advanced too much too fast and was overbought.
Weekly Analysis
Chart Analysis
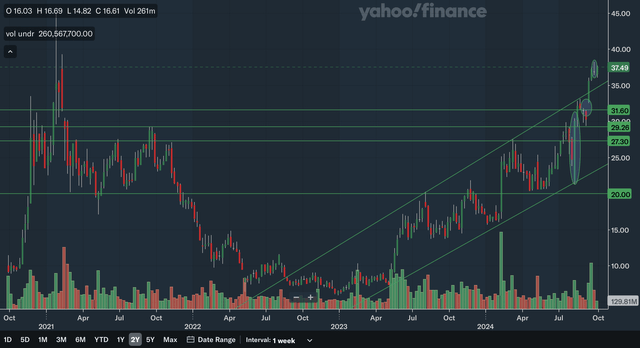
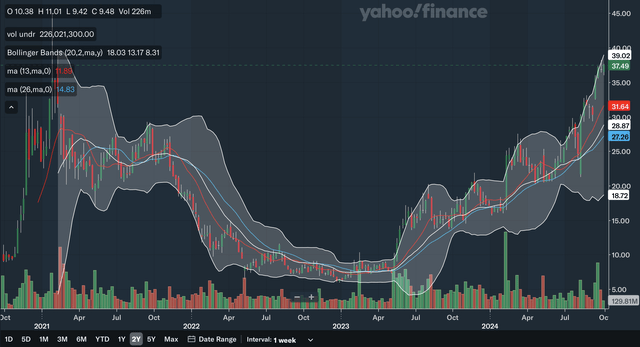
As shown in the chart above, there is not much resistance for Palantir in the intermediate term. The all-time high set in 2021 will likely be the only resistance that Palantir will see in the intermediate term. On the other hand, Palantir has many levels of support beneath its stock. The nearest level of support would be the former upper channel line in the mid-30s and is rapidly rising. Palantir broke above the upper channel line that has been in effect since 2023, demonstrating its uptrend is accelerating in the intermediate term. The next level of support would be in the low thirties, as there is a gap at that level. It is the same one as identified in the daily chart analysis. Moving down, the next support level zone would be in the high 20s. The 27-29 area seems to be quite a significant area, as it has been support or resistance a total of 6 times since Palantir went public. Therefore, this zone would be solid support if Palantir were to slip back to these levels. Lastly, there is also support further down as there is the lower former channel line as well as a support level in the low 20s that has been bounced off from multiple times in the past few years. I have also circled a bullish engulfing pattern showing the bulls are in control as well as a doji showing that in the near term, Palantir may be overbought and could potentially pull back a bit. Overall, in my view, Palantir’s chart should convey confidence to investors as there is enormous support contrasted with minimal resistance overhead.
Moving Average Analysis
The 13-week SMA has not been below the 26-week SMA for approximately a year and a half, indicating sustained bullish momentum. The latest bullish crossover took place in early 2023 and since then, the stock has surged, to say the least. Currently, the gap between the two SMAs is widening, indicating accelerating momentum in the nearer term. The stock is currently quite high above both of the SMAs showing that it may be slightly overbought in the intermediate term as well. That is further demonstrated by the Bollinger Bands, as the stock hit the upper band just very recently. The stock is also high above the Bollinger Bands 20-week centre line, showing that support is significantly below current levels. In fact, both the SMAs and the Bollinger Bands centre line are all more than 15% below its current price. This clearly shows to me that while the intermediate term uptrend is strong and well, Palantir is overbought and needs some time for the moving averages to catch up before breaking out on the upside again. Currently, it is not a bad to place to buy by any means, but waiting for some more consolidation would lower the risk considerably.
Indicator Analysis
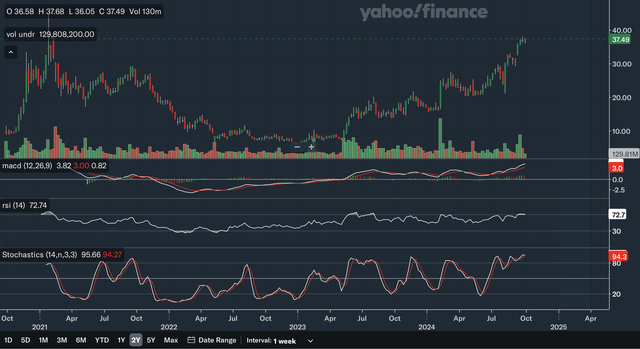
Currently, the MACD is significantly above the signal line, indicating that there is intermediate term bullish momentum. Since the bullish crossover earlier this year, the MACD has bounced from the signal line two times, showing the bulls are resilient. The MACD also confirms the recent highs, as the MACD has bested levels seen back in mid-2023. For the RSI, Palantir is currently sitting at an overbought 72.7. That itself is not worrying, as the stock can remain overbought for a long time. What is slightly concerning is there is a minor negative divergence taking place for the RSI in the intermediate term. Back in mid-2023, the RSI rose above the 70 level into overbought territory, and that peak exceeds that current RSI peak. This is a potential red flag and should definitely be monitored moving forward. Lastly, for the stochastics, the %K line is currently above the %D showing a bullish signal. The lines have crossed over quite a few times in the past few months, but both lines have generally stayed above the 80 zone, showing sustained bullish momentum. Overall, I believe an intermediate term indicator analysis shows that the longer-term technical outlook for Palantir is net positive. The divergence with the RSI needs to be monitored closely as it can be a potentially bearish signal.
Weekly Analysis Takeaway
I would say that the intermediate term technical setup for Palantir is still good, but not as good as the shorter term. The intermediate term charts should still give longer-term investors’ confidence, but the moving averages show that Palantir is a bit overbought and support of the moving averages are quite far below. As discussed above, the indicator analysis is net positive, but the RSI divergence warrants some caution. Overall, I believe the intermediate outlook for Palantir is good, but not great. It is still a buy, but just not a strong buy.
Fundamentals & Valuation
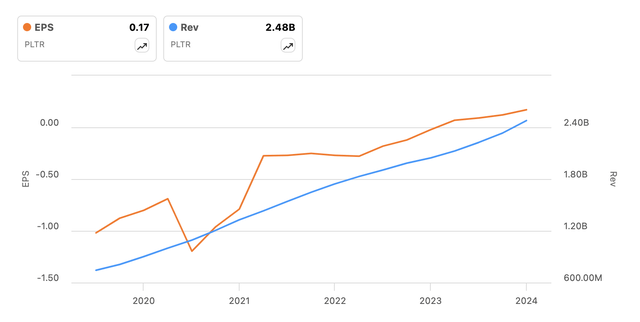
Back in August, Palantir reported strong earnings. The posted revenues of $678 million, representing growth of 27% YoY and 7% QoQ. Their government revenue hit $371 million, growing by 23% YoY. Even more impressive was their commercial revenue, as it grew by 33% to $307 million. This reflects the success of their continued efforts to diversify their revenue streams from reliance on mainly government contracts. They also reported an adjusted EPS of $0.09, representing an impressive 80% growth rate. Other highlights include their US commercial customer count growing by 83% to 295 customers and closing 27 deals over $10 million in the quarter. Overall, I believe the results in their 2024 Q2 were strong, and their results remain in a strong uptrend as shown in the above chart.
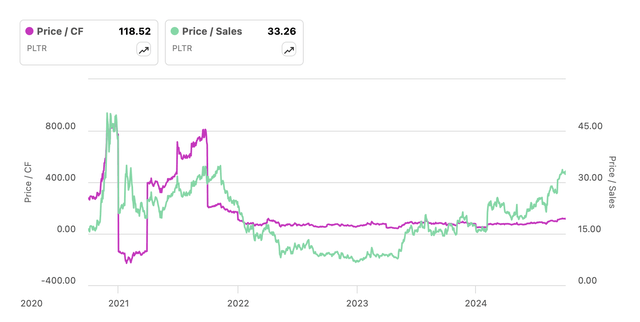
While Palantir stock is by no means cheap when evaluating its P/S and P/CF ratios, it is significantly cheaper than at its peak levels. The P/S ratio currently sits at around 33, much lower than the 2020 reading of above 45 and the P/CF ratio is around 120, down from the peak of over 800 in 2021. The multiples, however, have also rebounded significantly from their 2023 lows, but I would argue that the rebound was justified as the AI boom has provided Palantir with a key growth driver. As you can see in the revenue and EPS chart above, things are clearly trending in the right direction for Palantir. Their EPS turned positive for the first time in early 2023 and while revenue growth has decreased percentage-wise over the past few years, their revenue is clearly still trending in the right direction. In addition, with major AI tailwinds, Palantir’s growth figures will likely reaccelerate in near future. Although certainly not cheap, in my view, Palantir’s current valuation is justified with their EPS turning positive, their revenue continuing to trend upward, and AI providing a strong future outlook for its business.
Conclusion
From my analysis of the near term and intermediate term technicals of Palantir, I conclude that it is still a buy at current levels. Overall, the chart analyses show that there is strong support reasonably below the stock, while the moving average analyses show the bull trend is still highly intact despite near-term overbought signals. Lastly, the indicator analyses show some mixed signals, with some indicators signalling some weakness after being overbought as well as the RSI showing a potentially concerning divergence. However, I believe as a whole, the rewards still outweigh the risks at this point and the continuation of the bull run after a period of consolidation is the most likely scenario. In terms of the fundamentals, as discussed above, in my view, Palantir’s valuation is justified by its strong financial results as well as its AI growth prospects. Therefore, I reiterate my buy rating for Palantir, even though it has advanced over 100% since my previous buy rating.
Analyst’s Disclosure: I/we have no stock, option or similar derivative position in any of the companies mentioned, and no plans to initiate any such positions within the next 72 hours. I wrote this article myself, and it expresses my own opinions. I am not receiving compensation for it (other than from Seeking Alpha). I have no business relationship with any company whose stock is mentioned in this article.
Seeking Alpha’s Disclosure: Past performance is no guarantee of future results. No recommendation or advice is being given as to whether any investment is suitable for a particular investor. Any views or opinions expressed above may not reflect those of Seeking Alpha as a whole. Seeking Alpha is not a licensed securities dealer, broker or US investment adviser or investment bank. Our analysts are third party authors that include both professional investors and individual investors who may not be licensed or certified by any institute or regulatory body.

