Summary:
- Palantir Technologies Inc. aligns with expectations of correction after reaching new highs within uptrend price channel.
- Global application software market projected to grow at 7.8% CAGR, driven by AI and ML technologies.
- Technical analysis indicates potential downside risks for Palantir, prompting a sell rating due to overextended position and possible correction.
- In this technical article, I discuss essential price levels and metrics investors could consider to gain an edge over the stock’s likely price action.
Just_Super/E+ via Getty Images
Palantir Technologies Inc. (NYSE:PLTR) has aligned with my expectations of a correction. While it has reached new highs within its uptrend price channel, the stock now finds itself at another critical juncture that warrants close examination. This article delves into potential trading strategies, with a focus on the increased likelihood of a retracement based on current market dynamics and technical indicators. The analysis suggests a more cautious approach, taking into account various risk factors, including the broader industry landscape and overall equity market conditions.
A macro perspective
The global application software market is expected to grow at a CAGR of 7.8%, reaching a size of $328.30B through 2032. While the fast expansion of the US technology sector has recently been more supported by companies in the semiconductor and computer hardware industries, the development and adoption of Artificial Intelligence [AI] and Machine Learning [ML] technologies is offering secular growth opportunities to companies involved into the development and integration of software which uses or enhances such technologies. However, the expansion observed in the S&P 500 (SP500) is driven by a handful of stocks, namely NVIDIA Corporation’s Stock (NASDAQ:NVDA) (NVDA:CA), Microsoft Corporation (MSFT), Alphabet Inc. (GOOGL) (GOOG), Meta Platforms, Inc. (META), Apple Inc. (AAPL), and Amazon.com, Inc. (AMZN); which contributed to over 60% of the year-to-date return as of the end of June, before the market pulled back. Such a high dependence on a few stocks raises some questions for companies highly correlated to the technology sector and companies whose valuation multiplied over the past quarters, such as Palantir. The latter’s correlation with the SP500 is increasingly high, reaching 75.90% in July, implying that an eventual more significant correction of the index would cause the stock to suffer accordingly.
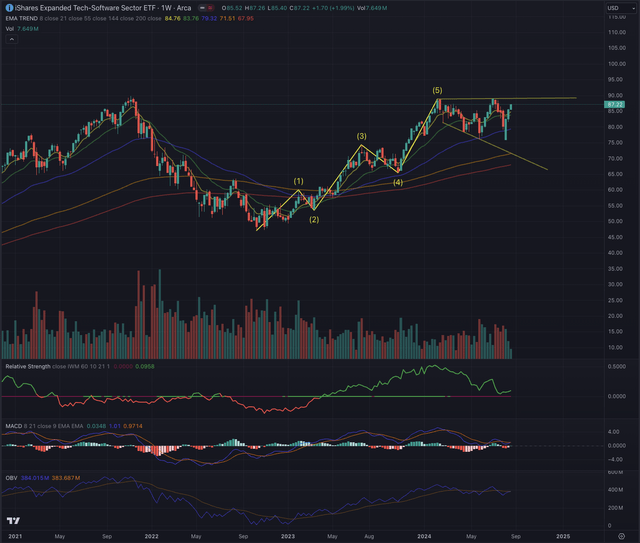
The iShares Expanded Tech-Software Sector ETF (IGV) has completed a five-wave Elliott impulse sequence and successively consolidated close to its highest price level while forming a double top at the beginning of July. IGV is forming an expanding triangle in its attempt to form a handle out of a massive cup formation, starting from the peak in November 2021 and bottoming in October 2022.
The recent increase in volatility hints at a possible imminent breakout or breakdown from these price levels. When looking at the Moving Average Convergence Divergence [MACD] momentum indicator and at IGV’s relative strength compared to the broader equity market, as represented by the iShares Russell 2000 ETF (IWM), the likelihood of a breakdown seems more significant, as both indicators point towards increased weakness. It is also noteworthy to observe that weeks, where the price has been under pressure, are reporting higher volume, a hint of ongoing distribution from institutions. The recent surge lacks robust buying momentum, as shown by the On Balance Volume [OBV], which has inverted and could have completed an extended cycle while hovering at or below its 21-day moving average.
Investors should pay attention to the upcoming area testing around $89. If IGV is rejected, more downside potential towards $69 becomes relevant. If instead, the industry benchmark breaks out from its ATH, it could lead to a very positive development for the concerned companies. Investors should consider that a breakout from a cup-and-handle formation is often tested, which means that the price is reverting toward the breakout level, and fake breakouts can lead to a massive reversal, as observed in many similar situations.
Where are we now?
In my last article on Palantir, published on March 22, 2024, I rated the stock as a sell position, assuming it had reached a top and was set for a correction.
“While the prospect of PLTR overcoming overhead resistance remains uncertain, my primary scenario leans towards a higher probability of the stock retracing and testing its prior breakout level.”
I suggested the stock would fall back towards the important price area around $20.24 and eventually reach further areas that needed to be balanced in terms of open gaps and liquidity pools.
“Initial price targets for the retracement are set at $20.24, progressing towards $17.90. While this retracement scenario appears most likely, PLTR could find support and resume its ascent, particularly towards the initial price target, confirming the breakout and fostering increased buying interest.”
It was mentioned that if PLTR confirms the support from its breakout level, the stock has a high chance of reaching prices above $30 in the foreseeable future.
“This scenario could lead to price targets between $30-31.50 initially, with further targets around $36.70.”
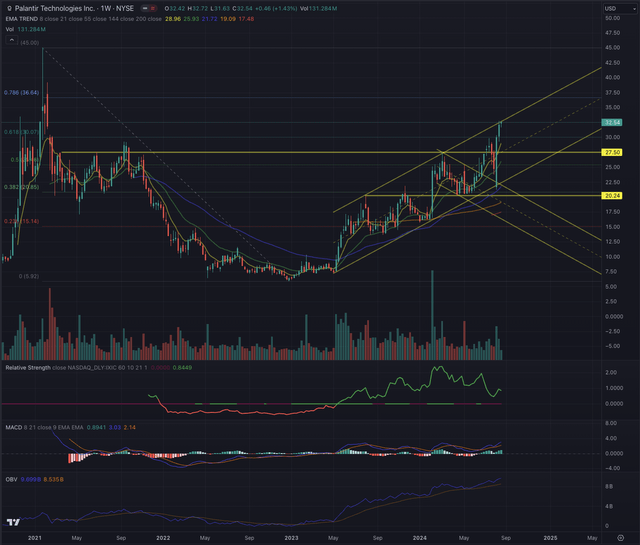
As observed in PLTR’s weekly chart, the price followed my assumption of reaching the previous resistance level of $20.24. While not breaking below, it consolidated around it before breaking out from a possible extended downtrend, leading PLTR to reach the price I mentioned as overhead targets.
The stock’s momentum has been fueled by robust buying interest, which can be observed in the consistent increase in the OBV. This upward trajectory is in line with the up-trending channel, with PLTR reaching the channel’s channel ceiling for the third time, as its MACD continues in its positive expansion, underscoring the observed positive momentum. Despite the stock’s recent surge, the relative strength compared to the broader technology market, represented by the Nasdaq Composite (IXIC), is decreasing, hinting at the stock having lost some interest from investors compared to other market opportunities.
Although these observations stem from PLTR’s weekly chart, it is crucial to zoom in further and examine the daily chart to confirm their validity. This shorter time frame provides a more detailed view of the recent price action, giving more insight into a tactical approach. By closely studying the daily chart, I can better grasp the underlying dynamics and judge whether the stock’s current path is sustainable or whether a corrective phase might be approaching.
What is coming next?
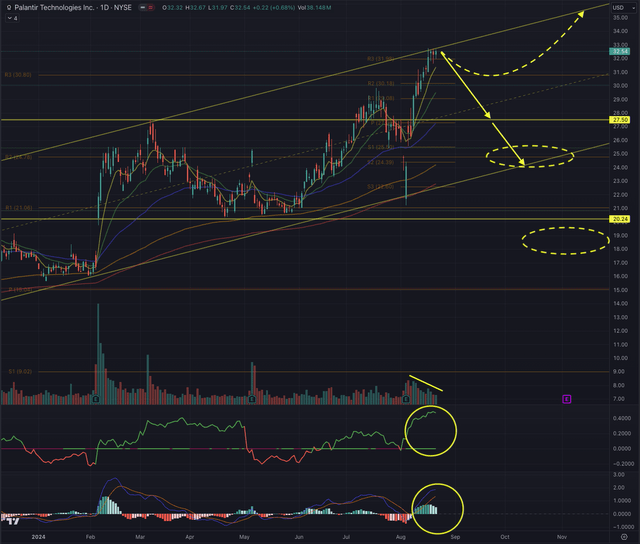
A closer examination of PLTR’s daily chart confirms the critical actual moment. The stock has reached the top of the up trending channel, while this area also corresponds to the 1.618 extensions from the previous drop, which was hinted at in my last article and finally observed during March and April. Additionally, this monthly resistance R3 at $31.98 has been breached, and a liquidity sweep is underway.
The tendentially decreasing volume in the past two weeks is instead ringing an alarm bell, as this could hint at buyers’ exhaustion at this crucial price level. The rapid surge in PLTR price action has left a new significant gap open between $25.57 and $24.44, beside the already discussed gap between $19.75 and $17.90, both areas are hinting at likely pricing balancing, as observed with Fair Value Gaps [FVG].
My primary scenario looks at PLTR correcting from its highs towards the channel lower band. This thesis would see the price plummeting below the support level at $27.50 to below the yearly resistance around $24.40 by closing the price gap and sweeping the liquidity pool. Here, PLTR would retrace around 70% from its last leg up, while this would also normalize the extension observed in the MACD, which is seemingly stalling. A significant magnitude of a likely correction could lead PLTR to even fill the gap towards $17.90 until reaching the yearly pivot point at $15.04, but this scenario would need a massive trigger either related to the company itself or caused by a correction in the technology market.
Alternatively, PLTR may consolidate within its current levels, retracing slightly towards $30.80 and forming a tight range or a flag before continuing in its ascent. Here, a first price target would be $36.64, followed by $39. This very optimistic scenario would need support from the broader technology market and increased buying pressure from institutions, which would be observed in the daily and weekly volume.
A breakout or breakdown of the industry benchmark IGV could provide a crucial clue about PLTR’s next move. Although PLTR is currently in an uptrend channel, my analysis indicates that the stock has reached significant targets and appears overextended, suggesting a likely retracement. It would be wise to consider taking profits at this stage as an investor. While I recognize PLTR’s potential within future-orientated growth trends, the current stock price reflects overly optimistic sentiment. From a technical and short-term standpoint, the risks now outweigh the opportunities, leading me to rate PLTR as a sell.
The bottom line
Technical analysis is a crucial tool for investors, increasing their chances of success by helping them navigate the complexities of listed securities. Like consulting a map or using a GPS on an unfamiliar journey, incorporating technical analysis into investment decisions offers a strategic guide. I utilize techniques rooted in Elliott Wave Theory and apply Fibonacci principles to assess potential outcomes based on probabilities. This approach helps validate or challenge potential entry points, considering factors such as sector performance, industry trends, and price action. My goal in using technical analysis is to thoroughly evaluate an asset’s condition and derive likely outcomes informed by these methodologies.
The global application software market is projected to grow at a 7.8% CAGR, reaching $328.30B by 2032, driven by AI and ML technologies. However, the S&P 500’s growth has heavily relied on a few tech giants, raising concerns about companies like Palantir, which is highly correlated with the index. Technical analysis of the iShares Expanded Tech-Software Sector ETF (IGV) indicates potential downside risks, with a possible breakdown likely. Given Palantir’s overextended position within its uptrend channel, profit-taking is advisable. The stock’s price action adds up to the risk of a correction, prompting a sell rating.
Analyst’s Disclosure: I/we have no stock, option or similar derivative position in any of the companies mentioned, and no plans to initiate any such positions within the next 72 hours. I wrote this article myself, and it expresses my own opinions. I am not receiving compensation for it (other than from Seeking Alpha). I have no business relationship with any company whose stock is mentioned in this article.
All of my articles are a matter of opinion and must be treated as such. All opinions and estimates reflect my best judgment on selected aspects of a potential investment in securities of the mentioned company or underlying, as of the publication date. Any opinions or estimates are subject to change without notice, and I am under no circumstance obliged to update or correct any information presented in my analyses. I am not acting in an investment adviser capacity, and this article is not financial advice. This article contains independent commentary to be used for informational and educational purposes only. I invite every investor to do their research and due diligence before making an independent investment decision based on their particular investment objectives, financial situation, and risk tolerance. I take no responsibility for your investment decisions but wish you great success.
Seeking Alpha’s Disclosure: Past performance is no guarantee of future results. No recommendation or advice is being given as to whether any investment is suitable for a particular investor. Any views or opinions expressed above may not reflect those of Seeking Alpha as a whole. Seeking Alpha is not a licensed securities dealer, broker or US investment adviser or investment bank. Our analysts are third party authors that include both professional investors and individual investors who may not be licensed or certified by any institute or regulatory body.


