Summary:
- Palantir’s Q3 earnings report highlighted its differentiating business model with superb scalability and profitability.
- Investors are willing to pay 158x FWD P/E for such a business model.
- Palantir’s free cash flow significantly exceeds its accounting EPS, suggesting its true earnings power is underestimated.
- Nonetheless, the stock’s current valuation would require years or even a decade for growth to catch up.
- Time compounds uncertainty and investors should consider their investment timeframe before engaging in this stock.

Prostock-Studio
PLTR stock: Previous thesis and Q3 earnings
My last work on Palantir Technologies Inc. (NYSE:PLTR) was published more than a month ago and was titled “Palantir: S&P 500 Inclusion And Thiel’s $1 Billion Divestiture.” As you can already guess from the title, the focus of that article was placed on its recent inclusion in the S&P 500 Index and also on Chairman Peter Thiel’s disclosure of a large divestiture. I argued for a bearish thesis after examining these factors. Quote:
PLTR’s inclusion in the S&P 500 index was followed by a substantial price rally, but the benefits are now priced in. Substantial insider sales, particularly by Chairman Peter Thiel, signal heightened valuation risks. Despite robust EPS growth projections, PLTR’s forward P/E ratio remains excessively high, pointing to an unfavorable return/risk profile ahead.
Its PLTR forward P/E ratio, which I considered excessively high at that time, was around 110x. Since then, there have been a few new catalysts evolving surrounding the firm. In this article, I will concentrate on the top two as I see it. First, the company has reported its Q3 earnings and updated its business operations. As you can see from the following screenshot, the numbers surpassed market expectations and I will review the implications of its new financials. Second, the stock has enjoyed a substantial expansion of its valuation multiples since my last writing. The stock now trades at an FWD P/E of 158x as of this writing. These new developments call for a new look at the stock.
In the subsequent sections, I will present my reexamination of the stock as a blend of its Q3 earnings review and a reflection of my experiences with high P/E stocks. I will explain why, after weighing the positive catalysts and valuation risks, I maintain my sell rating under current conditions.

Seeking Alpha
PLTR Q3: free cash conversion in focus
As a popular stock on the Seeking Alpha platform, PLTR’s Q3 earnings report has been dissected by multiple authors immediately after its release. Thus, here I won’t repeat what has already been said. I will directly get to my point. The stock enjoys triple digits for good reason. The stock enjoys a highly scalable and highly profitable business model, as highlighted in its Q3 ER. I will elaborate on the scalability part later and will focus on the profitability part there. As seen in the chart above, the company’s GAAP EPS came in at $0.06 per share for Q3 and its normalized EPS is even better at $0.10 per share.
However, as a fast growth stock, even the normalized EPS underestimates its true earnings power. This leads to the first lesson I’ve learned about high P/E stocks. A major cause that makes their P/E high is that they spend aggressively on growth capex. To get insights into their true earnings power, we need to add the growth capex back to the accounting EPS earnings to obtain the so-called owners’ earnings (OE) – a key insight I’ve learned from Warren Buffett. As a result, their true OE is considerably higher than their accounting EPS and thus their P/E based on OE is usually considerably lower.
PLTR’s Q3 earnings are a good reflection of such underestimation. More specifically, the chart below (taken from its income statement and cash flow statement) illustrates its free cash flow and also EPS per share. As seen, the FCF it reported in Q3 is about $0.18 per share, 3x higher than the GAAP accounting EPS of $0.06 mentioned above. Even compared with the normalized EPS of $0.1 per share, the FCF/EPS conversion ratio is 1.8x for Q3.
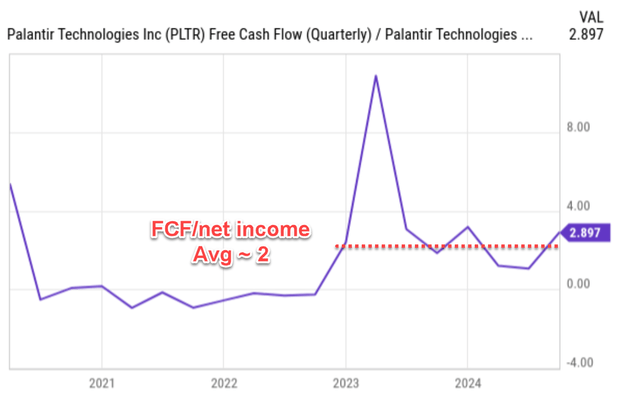
To better contextualize these figures, the second figure below shows the same ratio (i.e., FCF to net income ratio) in the past. The ratio has been largely negative before ~2023 because of its negative accounting EPS. However, after it became profitable by GAAP standards around ~2023, the ratio has been substantially above 1x since then. Despite large fluctuations (mostly caused by its very small accounting EPS), the ratio has averaged around 2x in the past two years.

Seeking Alpha

Seeking Alpha
PLTR Q3: P/E based on owners’ earnings
Thanks to the above factors, PLTR OE is significantly higher than its accounting EPS and thus its P/E is considerably lower when based on OE. As an estimate, I applied the so-called Bruce Greenwald’s approach to isolate its growth capex. The approach was detailed in my earlier article (where I applied it to analyze Apple Inc. (AAPL)). Here I will just quote the end results below:
First, calculate the ratio of PPE (properties, plants, and equipment) to sales for each of the five prior years and find the average. We use this to indicate the dollars of PPE it takes to support each dollar of sales. We then multiply this ratio by the growth (or decrease) in sales dollars the company has achieved in the current year. The result of that calculation is growth capex. We then subtract it from the total capex to arrive at maintenance capex. From this approach, PLTR’s OE is on average 32% higher than its accounting EPS in recent years.
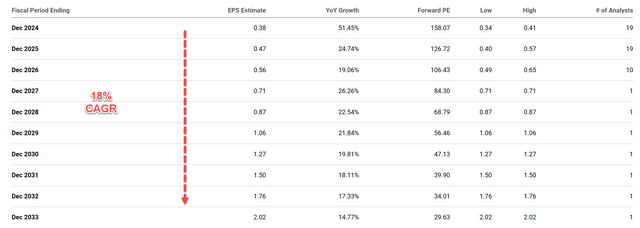
As such, the stock’s P/E would be about 32% lower when it’s based on the OE. According to the consensus EPS estimates for PLTR stock below, the stock is trading at 158x P/E based on FY1 accounting EPS. This figure would translate into an OE-based multiple of about 119x, much lower than the accounting P/E but still in the triple digits.
Of course, the consensus expects rapid EPS growth in the years to come. The estimated EPS for fiscal year 2024 is %0.38, translating into a year-over-year growth rate of 51.45%. This growth momentum is expected to continue, with EPS estimates increasing to over $2 in 10 years, an increase of almost six-fold. The compound annual growth rate implied by these estimates is 18%. However, note that even assuming such growth for the next 10 years, the stock’s implied P/E would still be around 30x by then – still a quite elevated level.

Seeking Alpha
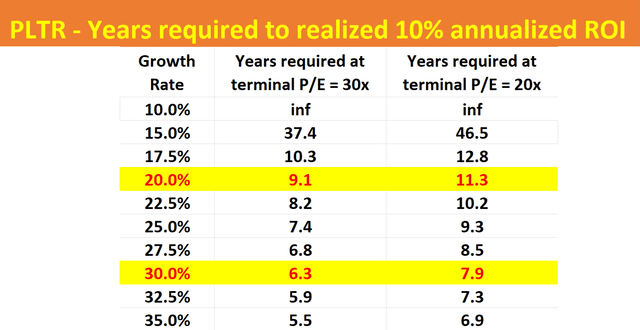
In the end, investors’ return does not come from growth alone. It comes from the combination of growth and how the market prices the growth. This leads to the second lesson I’ve learned about high-P/E stocks. To make a profit from these stocks, investors need years of high growth and a reasonable terminal P/E. A simple reality check on these factors is shown in the table below. This simple calculation projects the number of years to realize a 10% annualized ROI (return to investors) at PLTR’s current valuation of 158x P/E. I calculated two scenarios: A terminal multiple P/E of 30x and 20x. As seen, with a 20% CAGR, under its current P/E, investors would need 9~11 years to realize a 10% annual return on the stock when the terminal P/E is in the range of 30x to 20x.
Time compounds uncertainty. I certainly do not have the foresight to project PLTR’s business – in a rapidly evolving sector – in about 10 years and make any prediction if it would be worth 30x P/E at that time.

Author
Other risks and final thoughts
Finally, the third lesson I’ve learned about high P/E stocks (or just stocks in general) is that investors should not short stocks simply based on high valuation multiples. These stocks are usually expensive for a good reason. In PLTR’s case, as mentioned earlier, its scalable model provides it with plenty of high-growth areas to deploy growth capex aggressively. Such aggressive pursuit of growth can lead to large quarterly earnings surprises and stock price swings.
In PLTR’s case, its business model indeed differentiates itself from other tech companies in several key areas. The top one in my opinion is its data integration and analysis capability. This capability enables it to extract valuable insights from disparate data sources. This allows PLTR to provide tailored solutions to a wide range of industries, from government agencies to commercial enterprises. Its success with the A.I.P. and the Ontology platform are good examples. These differentiating features could result in a customer lock-in advantage. Its ongoing efforts to integrate generative A.I. and Large Language Models can further augment the potency of these differentiators.
All told, PLTR’s Q3 highlights the beauty of its underlying business model. The model is highly scalable and profitable, as reflected in its superb free cash conversation ratio and aggressive growth capex investments. Due to these factors, its P/E is lower than on the surface considerably, but still in the triple digits by my estimates. As such, my verdict is that its current valuation has already priced in years or even a decade of growth, and time compounds uncertainty – a key lesson I learned from my past mistakes.
Analyst’s Disclosure: I/we have no stock, option or similar derivative position in any of the companies mentioned, and no plans to initiate any such positions within the next 72 hours. I wrote this article myself, and it expresses my own opinions. I am not receiving compensation for it (other than from Seeking Alpha). I have no business relationship with any company whose stock is mentioned in this article.
Seeking Alpha’s Disclosure: Past performance is no guarantee of future results. No recommendation or advice is being given as to whether any investment is suitable for a particular investor. Any views or opinions expressed above may not reflect those of Seeking Alpha as a whole. Seeking Alpha is not a licensed securities dealer, broker or US investment adviser or investment bank. Our analysts are third party authors that include both professional investors and individual investors who may not be licensed or certified by any institute or regulatory body.
As you can tell, our core style is to provide actionable and unambiguous ideas from our independent research. If your share this investment style, check out Envision Early Retirement. It provides at least 1x in-depth articles per week on such ideas.
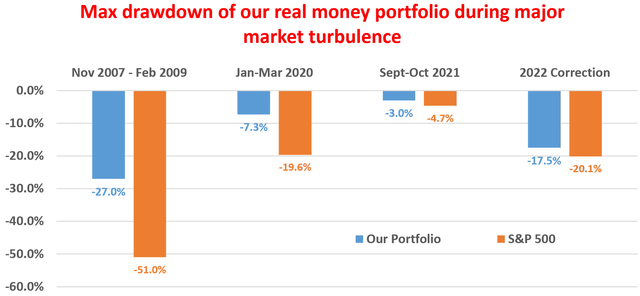
We have helped our members not only to beat S&P 500 but also avoid heavy drawdowns despite the extreme volatilities in BOTH the equity AND bond market.
Join for a 100% Risk-Free trial and see if our proven method can help you too.

