Summary:
- Palantir is expensive, but not overvalued. Intrinsic value increases every passing quarter while the core business gets more robust. The company is fairly valued at the time of writing.
- While year-over-year numbers look amazing due to a weak comparison period, the quarter-over-quarter numbers do not. However, every KPI is showing hints of acceleration.
- Palantir is exhibiting a masterclass in sales efficiency and is being rewarded in the market for it.
Andreas Rentz
I’ve written two articles featuring Palantir Technologies (NYSE:PLTR). I initiated coverage with a buy rating followed by a hold rating, even though the intrinsic value increased significantly from the first article to the second. With the latest earnings, investors have been giving deeper insights and hints that help us more accurately project future financial performance for the business. Since my previous articles, Palantir stock price has soared, and it is currently the most expensive software-as-a-service (SaaS) company. However, expensive does not mean overvalued. In this article, I will explain why the stock is trading below intrinsic value yet again and why I am upgrading my rating for the company.
Expensive, But Not Overvalued
It is important to be able to differentiate pricing from valuation. Most major news broadcasts, Wall Street analysts, and individual investors confuse these terms to the point where price-to-sales (P/S) or price-to-earnings (P/E) ratios are considered valuation metrics. These are pricing metrics as they relate to the current stock price and not the intrinsic value of the business. Investors then compare the pricing to other similar businesses to derive opinions regarding the stock being cheap or expensive. These are snapshots of present or near-term future expectations against the current stock quote.
For example, if you were to purchase a home, you don’t value what the raw materials used for building the home are worth today while discounting for material depreciation over time. Instead, you price it by looking at what similar homes recently sold for within the same neighborhood. With that in mind, Palantir is currently trading at a premium to other similar SaaS businesses and can therefore be considered expensive. The chart below shows the P/S multiple for Palantir and closely related SaaS businesses.
However, looking at current results is not too interesting for a company where most of the value is terminal, meaning beyond analysts’ projection models. Palantir is such a company, and I will value the business in this article. Before we reach that point, let’s look at current performance and why Palantir is justified in having a premium in the market on a pricing basis. After all, current financial results are used to extrapolate future projections for a valuation.
The 2024 Q2 earnings report was recently released, and it has reiterated the continuous reacceleration of various key parts of the business. First, top-line revenue grew 27.15% year-over-year (YoY) off the back of a weak comparison period the year prior. Q2 of 2023 was the bottom in terms of YoY growth rate for Palantir, and it has been accelerating since. Palantir was a hot name as the company did their direct public offering (DPO), with promises of 30% compounded annual growth rates (CAGR) for many years to come. This made for lofty valuations as analysts used large growth rates in their models. However, as the growth started to taper off, so too did the stock price. At the time of reporting the 2023 Q2 results, revenue growth was only 12.75% YoY, and the stock price was trading at around $7.50. As the following quarters saw an acceleration, so too did the stock price. The weak quarter in particular set a bed for impressive rewards to reap as it serves as a weak comparison period for 2024 Q2, which is the quarter we just had.
Emir Mulahalilovic, Palantir SEC Filings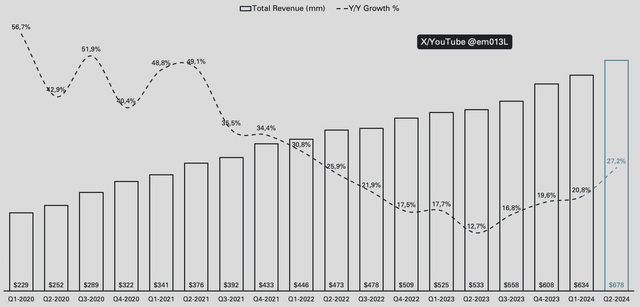
The re-acceleration story is not only tied to the weak comparison period. Even if we normalize revenue growth for the 2023 Q2 period, the top-line growth rate would still come in at ~24% revenue growth for this quarter. That would mean that Palantir is still on a healthy, accelerating growth trend.
To understand the top line better, we need to look under the hood of the components that make up the total revenue. If we peel back the first layer and look at the commercial and government revenue individually, we can see that both are exhibiting YoY accelerations. This is healthy, and what you want to see as an investor is that the whole business moves along on a healthy and upward trend. If there is a single outlier to credit all the growth to, that may introduce risks to the business.
Emir Mulahalilovic, Palantir SEC Filings
This specific chart also shows us what caused the weak comparison period in 2023 Q2. Specifically, commercial revenue declined from $236 million to $232 million, which sets up a strong growth quarter for the commercial side of the business.
While Palantir operates globally, a majority of both commercial and government revenue stems from the U.S. as of the latest 10Q report. U.S. commercial makes up 52% of the total commercial revenue, up from 50% the previous quarter, and U.S. government makes up 75% of total government, down from 77% the previous quarter.
We already identified that the commercial revenue was the primary drag 12 months ago. That was also in a period where the Artificial Intelligence Platform (AIP) was in its infancy and had yet to leave its mark on Palantir’s business. There has been intense growth within the commercial space for Palantir since the launch of AIP and the bootcamp concept. During bootcamps, Palantir hosts building sessions on its AIP platform, a smart and efficient way to let customers get a hands-on experience of the product. Since bootcamps started scaling up, so too has the U.S. commercial customer count.
With AIP bootcamps scaling up and with the weak comparison period in mind, Palantir recorded 54% U.S. commercial revenue growth Y/Y…
Emir Mulahalilovic, Palantir SEC Filings
…as well as a very impressive 83% increase in commercial customers Y/Y.
Emir Mulahalilovic, Palantir SEC Filings
And finally, if we look at the total number of customers, they grew ~41% YoY.
Emir Mulahalilovic, Palantir SEC Filings
It may seem like a lot to digest back-to-back, but the previous three charts display similar characteristics. YoY growth is strong because the comparison period was weak, and the quarter-over-quarter (QoQ) growth is significantly slowing down compared to the previous periods.
One period of slowdown QoQ is not yet a cause for concern, but it is strange considering the continuous ramp-up of AIP bootcamps. Palantir has roughly doubled the amount of bootcamps hosted each quarter since 2023 Q4, which should have resulted in an accelerated increase in customer count growth as well.
A Deeper Look
It needs to be noted that Palantir has a drag on its revenues. The special purpose acquisition company (SPAC) investments from 2021-2022 have been providing a big boost to Palantir’s revenue. At times, income from the contracts resulting from the SPAC investments has reached 32% of the total U.S. commercial revenue as well as up to 10% of total revenue. These only made up 3% of U.S. commercial revenue and 1% of total revenue in 2024 Q2, meaning it is a major drag. If we look at total revenue and U.S. commercial revenue excluding SPAC income, the growth rates are 30.17% YoY for total revenue and 79.21% for U.S. commercial revenue. This is the organic growth of the business and therefore a much more important figure to track. It’s a very positive sign seeing Palantir back to above 30% growth organically.
Emir Mulahalilovic, Palantir SEC Filings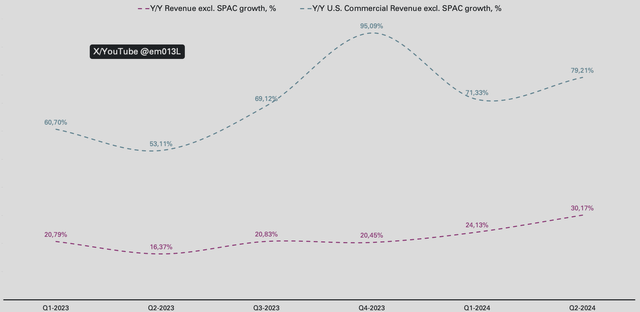
While net addition of customers had a weaker quarter, the same cannot be said for the amounts of deals closed for Palantir. The company closed the second-most deals in a single quarter while also noting the best quarter for deals closed of at least $10 million.
Emir Mulahalilovic, Palantir SEC Filings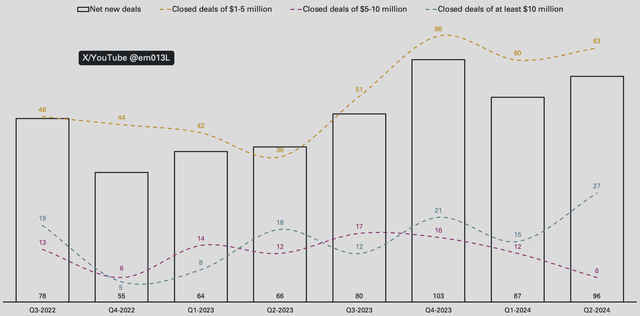
The large deals had an impact on scoring the first increase in average revenue per customer, excluding the top 20 customers. The reason I exclude the top 20 customers in terms of revenue is because 3% of the customers (the top 20) account for 46% of all the revenue. I normalize the average revenue per customer by excluding these and by using trailing twelve-month data. Average revenue per customer has been on a steady decline since investors could track this metric, a huge positive for the company.
Emir Mulahalilovic, Palantir SEC Filings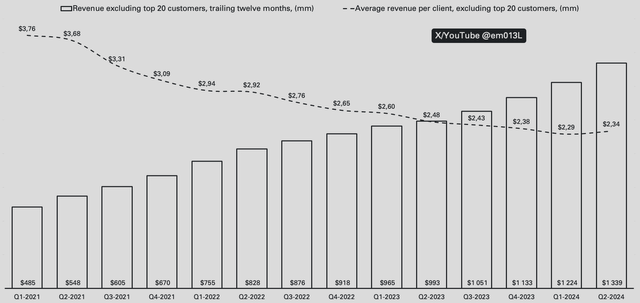
The cascading effect continues, as Palantir also kept the positive trend in regards to the net dollar retention. Net dollar retention speaks for how well existing customers are scaling, as it records the increase in spending from customers that have been contracted for at least 12 months. We know that AIP and bootcamps were introduced and started accelerating customer growth roughly a year ago. We also know that Palantir did not fully monetize new AIP customers due to being focused on taking market share. The coming periods should see a continued acceleration of net dollar retention growth as this cohort starts scaling into Palantir’s offerings.
Emir Mulahalilovic, Palantir SEC Filings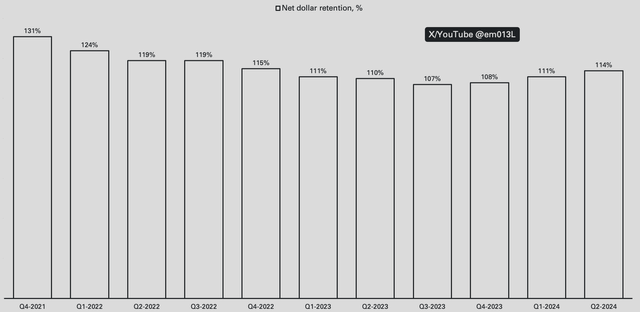
While Palantir has been free cash flow positive for 15 quarters in a row, they have only been operationally profitable for 6. They had positive net income margins for 7 quarters due to the substantial amount of income credited to yield farming government-issued debt. Both operating- and net income margins have since been on an upward trend and scored a record high this past quarter.
Emir Mulahalilovic, Palantir SEC Filings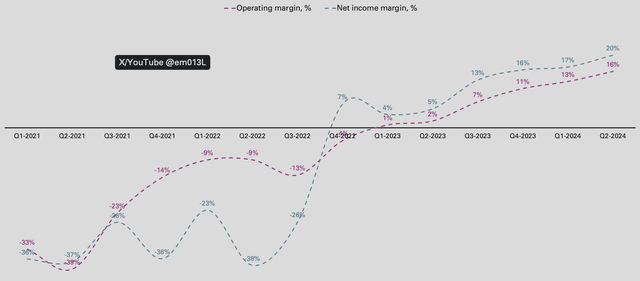
Palantir’s reported adjusted free cash flow came in at $149 million, the same as the prior quarter. The margin for Q2 is lower, however, due to $14.3 million less cash paid for employer payroll taxes related to stock-based compensation (SBC), which is what Palantir adjusts for. I also calculate free cash flow to the firm on an SBC adjusted basis as well, where the margin came in at 17%, the same as the prior quarter.
Emir Mulahalilovic, Palantir SEC Filings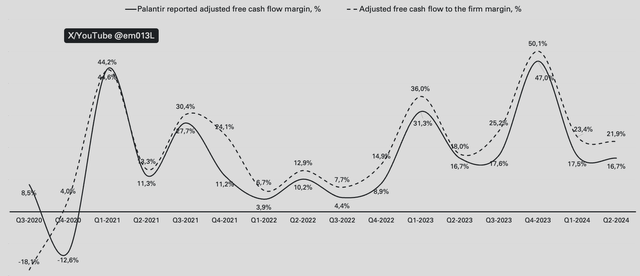
There are two more important metrics to track for this company. The first being the sales efficiency. We saw a huge boost in sales efficiency when AIP and bootcamps were introduced; therefore, we want to see that trend continuing. The way I track sales efficiency is by calculating customer acquisition cost (CAC) as well as how long it takes for each customer to pay back the CAC. The formula for these can be found in my previous Palantir article, as repeating it every time would make my articles even longer. CAC per customer is heavily impacted by the slowing down of customer count growth. While $3.7 million per customer is higher than the previous two periods, it is not cause for concern as the value per customer is higher, which is seen by the decrease in implied CAC payback months.
Emir Mulahalilovic, Palantir SEC Filings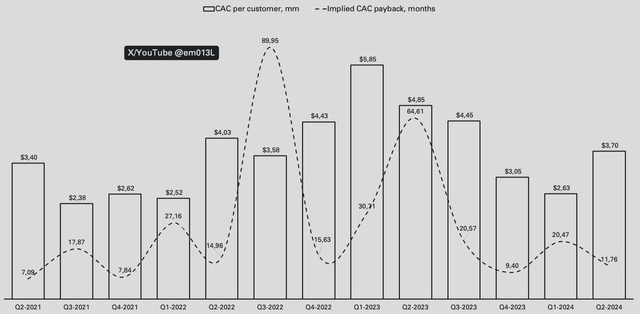
There are two more metrics that I track to gauge the quality of a SaaS business. These are the implied magic number, which relates to sales efficiency, as well as the rule of 40, which relates to the overall growth quality of a business. The magic number looks at implied annual recurring revenue (ARR) for the current period and divides it by the previous period sales and marketing spend. This produces a ratio that tells investors how efficient the sales cycle is for the business. The formula for the magic number can also be found in my previous article. In short, above 0.75 indicates a healthy business model with efficient sales. At that stage, the business is primed to start scaling growth. Below 0.75 requires some deeper look at the underlying metrics, while below 0.5 indicates issues with the business model. While Palantir may have been in trouble prior to AIP and bootcamps, we can clearly see the net positive effect over the past twelve months. Keep in mind that the 2021 quarters had an inorganic boost through SPACs and don’t provide meaningful data.
Emir Mulahalilovic, Palantir SEC Filings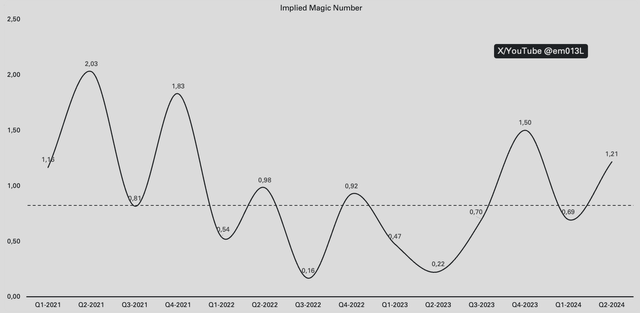
Finally, the last metric of importance is the rule of 40. This metric is commonly used to gauge the quality of a business by summing up the growth rate and the profit margin. What metric is used for the growth rate and for the profit margin varies depending on the analyst and the maturity of the business, but I use trailing twelve months of revenue growth as well as trailing twelve months of free cash flow margin. Palantir reports this metric differently in their earnings presentations, they sum up revenue growth on a YoY basis as well as an adjusted operating profit margin. The way I calculate it, Palantir is reaffirming that they are out of a drought where the business stagnated, and since being revitalized by AIP, it has been healthily above 40.
Emir Mulahalilovic, Palantir SEC Filings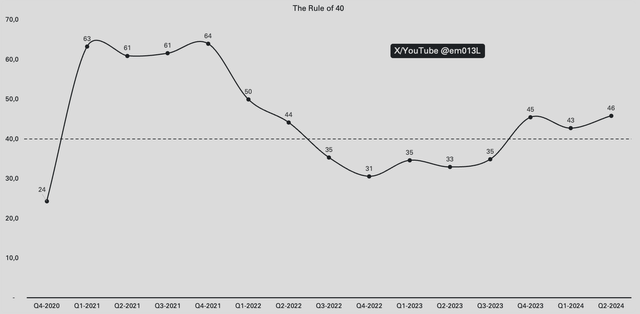
Risks, While Not Many, Do Still Exist
As with any business, there are risks. However, Palantir is not subject to the most common risks due to multiple reasons. Palantir has thrived under both political spectrums, famously having co-founder Peter Thiel and CEO Alex Karp on opposite sides. As such, the presidential outcome should not have a meaningful impact on the business in terms of bidding for government tenders. Palantir also operates under virtually every industry out there, and as such won’t be hit if specific industries take a beating. If the economy soars, Palantir will see AI spend go their way; if there’s a recession, companies will want to be cost-effective, and Palantir should still see customers piling in as a result.
However, no business is perfect. Palantir is set up well with a substantial cash position, no debt, and runs no risk of bankruptcy any time soon. However, the slow QoQ growth can be concerning if it is not an isolated quarter. Investors who rewarded the stock for high-growth rates after the Q2 report may not have identified the weak comparison period, and therefore might punish the stock after the Q3 report when the top-line growth rates are not matched.
Intrinsic Valuation
Understanding a story and being able to explain numbers in a valuation model is very important. Slapping flat growth rates over projection periods is not a valuation; that’s an Excel exercise. Palantir is a story currently at chapter 5 of a 35-chapter book; a lot of the story is still to be told, and we do not yet know the fate of our main character. This also means that valuing Palantir is not easy or static, and as investors we need to re-adjust whenever more hints about the future are presented to us. 2024 Q2 was such a quarter, I have underestimated several parts of Palantir’s story, and thus I need to value the business again.
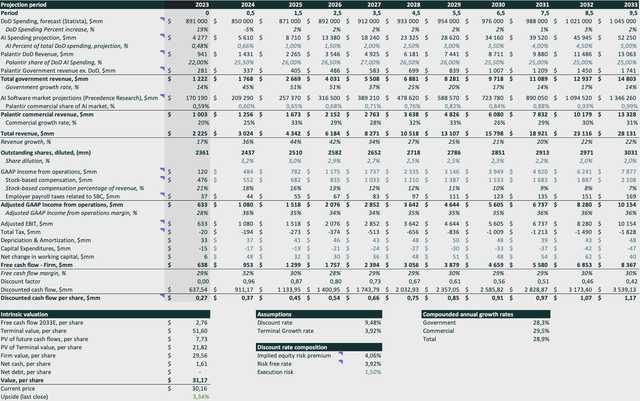
The way Palantir has solved sales efficiency and the way the margins are expanding are at a faster rate than I have anticipated. I had operating margins for 2024 through 2033 start at 13%, scaling up to 28%. The midpoint in 2028 I had previously projected to be 20%; Palantir is already about to reach that. I still have a difficult time explaining reaching above 28% operating margins for the business, but I have scaled up the prior periods by a few basis points, now starting at 16% for 2024. Bootcamp scalability may seem limited at first, as Palantir does not have unlimited personnel to keep running these at infinite scale. That is where their consultancy partnerships start to matter more. The more AIP becomes widespread, the more familiarity with the product and the possibility to scale out bootcamps to companies like Accenture and PwC, already confirmed Palantir partners. At one point, the need for bootcamps will cease as the primary function is to prove use cases and outcomes in a much shorter time than any other solution in the market can provide. Bootcamps solved one of Palantir’s core issues, being able to get the product into the hands of potential customers. The software sells itself, but Palantir is still a largely unknown entity. With bootcamps, they are able to get the product into the hands of many companies, proving use cases and outcomes in mere days as opposed to a 6-12 month long integration phase with worse output from a competitor.
My main assumptions for the valuation still rely on market projections for the AI software market by Precedence Research, as well as scaling up AI spend within the DoD budget (projected by Statista). These assumptions are explained in more detail in my previous articles.
My discount rate of 9.48% is composed of 4.06% implied equity risk premium calculated by Professor Aswath Damodaran for the month of August, the current risk-free rate of 3.92%, and finally, my own imposed execution risk of 1.5%. The terminal growth rate used is equal to the risk-free rate. As none of us are able to predict future economic performance in the US, the next best thing is to use the market implied growth through the risk-free rate as a proxy, in my opinion. The model adjusts earnings before interest and taxes (EBIT) by adding back SBC and instead captures dilution on a per-share basis through discounted cash flow per share for each period, where outstanding shares are diluted per period.
The pictured assumptions give us an intrinsic value of ~$31 per share, roughly where Palantir is currently trading. Strangely enough, the market has been fairly good at ensuring that Palantir trades close to fair value since the launch of AIP, only giving investors an opportunity to buy the company severely undervalued during the first half of 2023. Each time I value Palantir, it is trading around fair value, but my assumptions keep getting increasingly adjusted to the upside for each passing quarterly report.
Summary And Rating Upgrade
The 2024 Q2 report comes in three levels for investors. Growth rates look amazing at first glance—an acceleration through the most important key performance indicators. On the second tier, investors can identify that the comparison period of 2023 Q2 was particularly weak, setting up the bed for all the impressive YoY growth rates while throwing up a cautious eye on the slowing QoQ growth rates. On the third tier, where you are after reading this article, we can see that the business is, in fact, firing on all cylinders and continuously improving the underlying core of the business.
Sales efficiency metrics are showing investors that bootcamps are a scalable way to get the product into the hands of all-size businesses. In particular, while this quarter slowed down the customer acquisition rate, they also scored the most amount of $10 million or more deals in Palantir’s history. The net dollar retention rate continues to accelerate now that initial AIP customers are starting to scale. The CAC increased, but the CAC payback time decreased, showing healthy levels of sales and marketing spend for rewarded implied recurring revenue.
Margins keep expanding, accelerating at a faster clip than my previous forecast, which also pushes up my intrinsic valuation of the business. Organic revenue growth is already back to 30%, with U.S. commercial reporting an outstanding ~80% YoY growth rate if we exclude the SPAC contracts.
Palantir may be trading as the most expensive SaaS on the market right now, but that does not mean that it is overvalued. The business is getting more robust with each passing quarter, and I believe that the next quarter will drive intrinsic value up even further. The company trades at fair value using my assumptions and justifies a buy rating in my books; therefore, I have upgraded the rating from a hold to a buy.
Analyst’s Disclosure: I/we have a beneficial long position in the shares of PLTR either through stock ownership, options, or other derivatives. I wrote this article myself, and it expresses my own opinions. I am not receiving compensation for it (other than from Seeking Alpha). I have no business relationship with any company whose stock is mentioned in this article.
Seeking Alpha’s Disclosure: Past performance is no guarantee of future results. No recommendation or advice is being given as to whether any investment is suitable for a particular investor. Any views or opinions expressed above may not reflect those of Seeking Alpha as a whole. Seeking Alpha is not a licensed securities dealer, broker or US investment adviser or investment bank. Our analysts are third party authors that include both professional investors and individual investors who may not be licensed or certified by any institute or regulatory body.


