Summary:
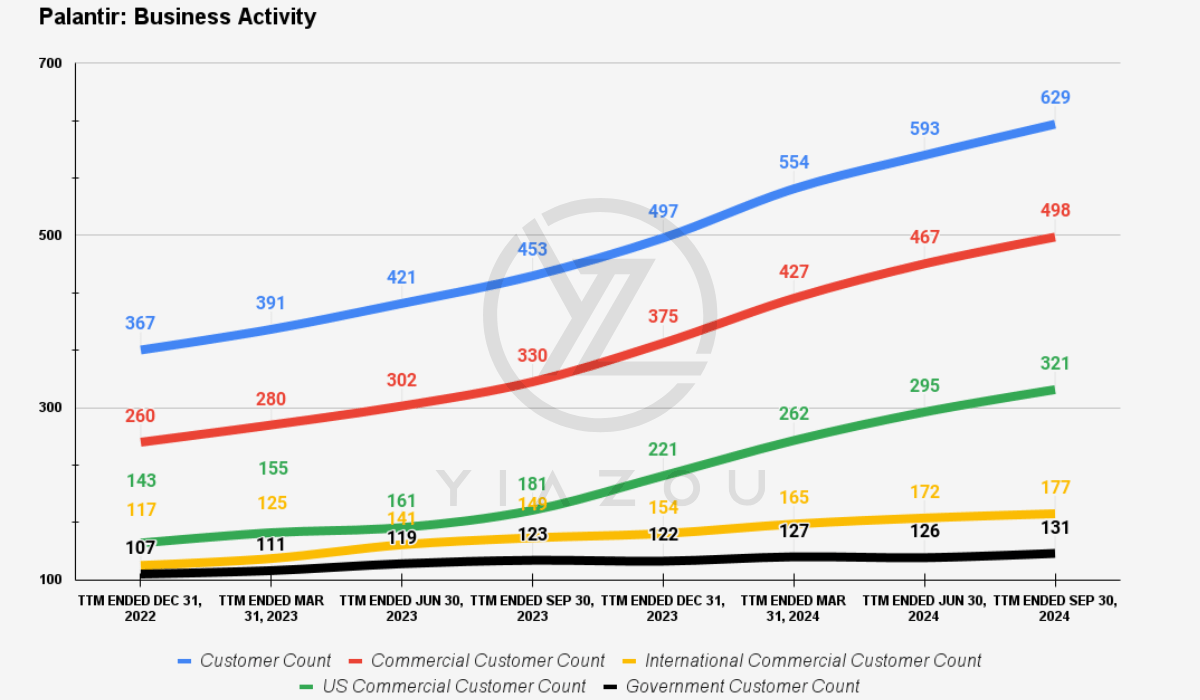
- Palantir’s customer base grew 71% from December 2022 to September 2024, reaching 629 customers, driven by strong commercial demand.
- Commercial customer growth surged 91.5% from Q4 2022 to Q3 2024, positioning Palantir to reduce reliance on government contracts.
- U.S. commercial customers saw 124.5% growth over the same period, highlighting Palantir’s successful expansion in its domestic market.
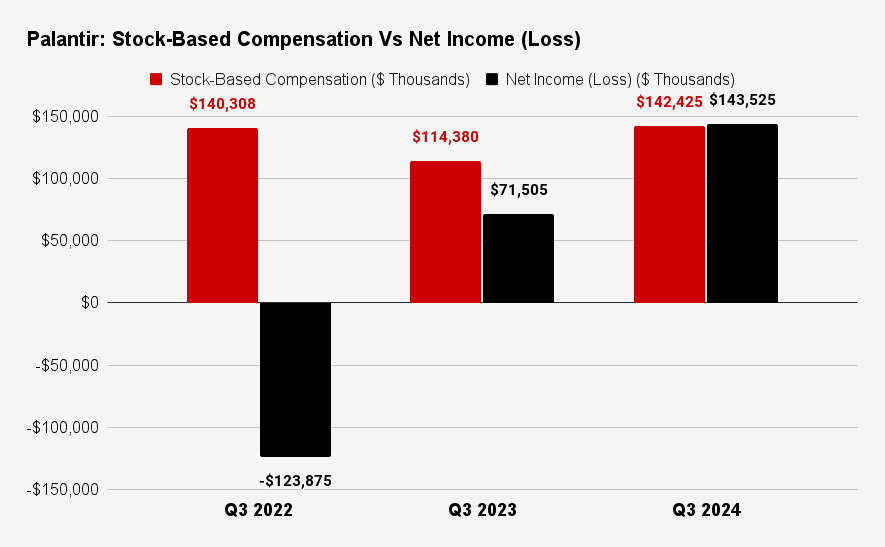
- SBC remains high, reaching $142.4 million in Q3 2024, limiting profitability and diluting shareholder value.
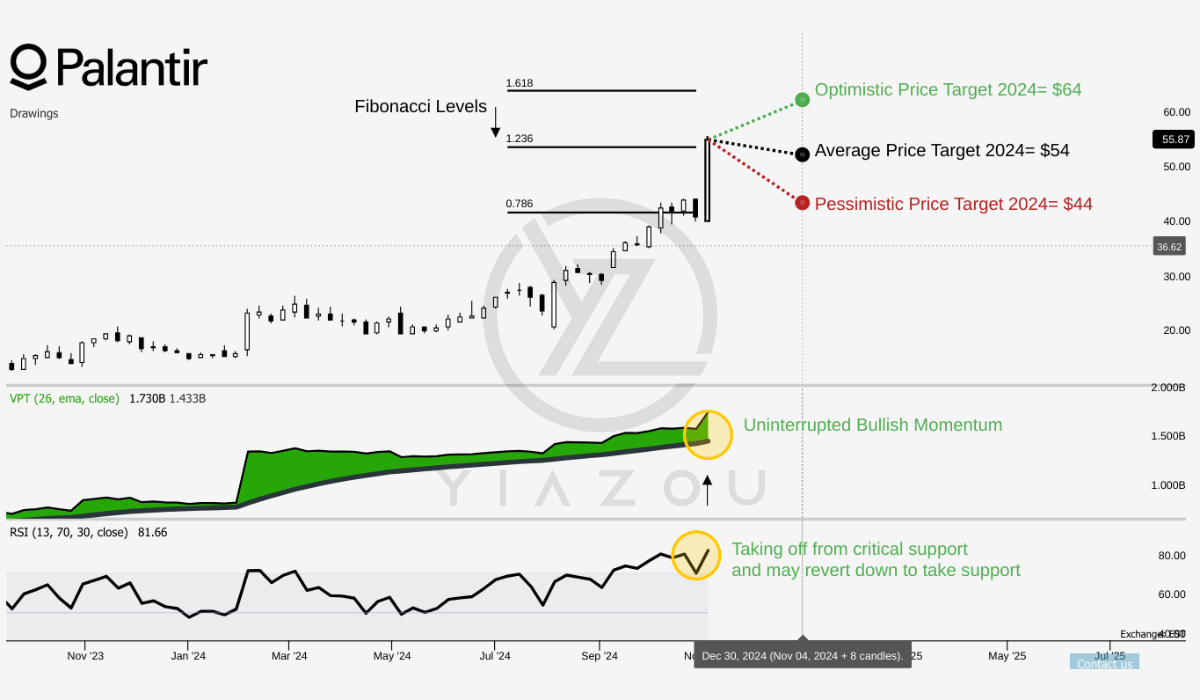
- With RSI at 81.66, Palantir’s stock is overbought, suggesting a potential pullback; current valuation offers a profit-booking opportunity.

piranka
Investment Thesis
As a long-time bull on Palantir (NYSE:PLTR), I’ve seen my conviction in this investment validated, with PLTR proving to be one of my most rewarding positions. Since the last coverage following the recent rally, we maintained optimism for additional upside, with PLTR returning over 31% in just one month.
However, while Palantir’s business momentum remains strong, the current valuation presents a compelling opportunity to book some profits, with technical indicators suggesting an overbought territory. A potential pullback could provide a more favorable entry point for new or additional investments.
Despite these near-term valuation concerns, Palantir’s impressive customer growth and dominance in data-driven technology underscore its promising long-term potential as it continues to innovate and expand its reach across diverse sectors.
Customer Surge: 71% Growth Driven by Commercial Demand and Global Reach
From December 2022 to September 2024, Palantir’s consolidated customer count increased constantly. Over this period, the consolidated customer count hit 629, increasing from 367. There is a growth rate of +71.39%, and in Q3 2024 alone, the YoY growth reached 38.85%. This stable growth in Palantir’s consolidated customer base reflects considerable demand for its platforms across both commercial and government sectors. This growth trend also marks effective sales strategies capitalizing on a strong product-market fit and a rising interest in data analytics advancements.
Moreover, the growth in commercial customers stands out as a solid factor in Palantir’s overall top-line expansion. From Q4 2022 to Q3 2024, the company’s commercial customer count surged from 260 to 498, representing a 91.54% increase. Meanwhile, year-over-year (YoY) growth in Q3 2024 was 50.91%. This rapid expansion in Palantir’s commercial customer base is a long-term catalyst, as the company has traditionally been known for government contracts.
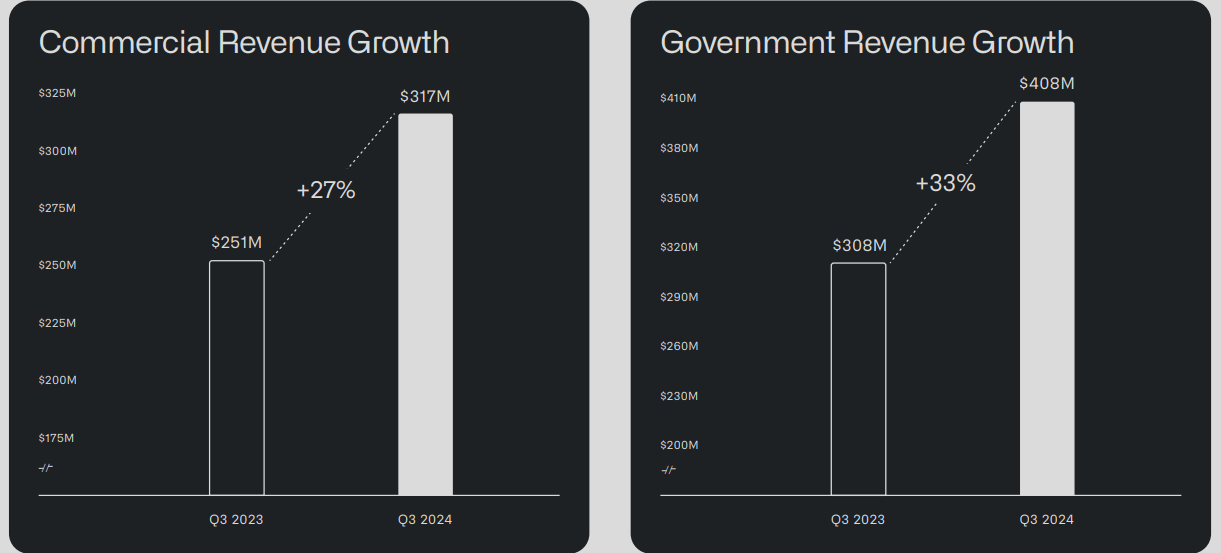
The shifting revenue mix signals Palantir’s lead in the commercial sector to diversify its revenue and broaden its reach into various industries. The commercial sector could present a considerable growth opportunity as businesses seek advanced data and analytics capabilities to sharpen decision-making and improve operational processes.
Further, growth in Palantir’s international commercial customer base reflects its expanding reach beyond the U.S., although somewhat slower. From Q4 2022 to Q3 2024, the international commercial customer count grew from 117 to 177 (+51.28%). In Q3 2024 alone, the YoY growth rate stood at 18.79%. This slower growth rate in international regions against the domestic market is mainly related to regulatory issues, regional competition, and the need for market adaptation. Nevertheless, this positive growth in international markets suggests potential for revenue diversification as Palantir reduces reliance on any single market.
Yiazou
Similarly, Palantir’s US commercial customer segment demonstrates the highest growth rate among all metrics, reflecting substantial progress in its domestic market. From Q4 2022 to Q3 2024, the US commercial customer count grew from 143 to 321 (+124.48%). In Q3 2024, this segment expanded by 77.35% YoY, which suggests Palantir has effectively tapped into the US demand for data analytics. Here, Palantir’s go-to-market strategies, such as targeted marketing, partnerships, and product boosts, were progressive in attracting and retaining clients in the US commercial sector.
Finally, while Palantir’s growth in government customers is more modest relative to the commercial sector, it still holds a stable trend. Between Q4 2022 and Q3 2024, government customers grew from 107 to 131, which indicates a 22.43% increase. The YoY growth in Q3 2024 reached 6.50% compared to Q3 2023. This slower growth in government customers could be due to longer sales cycles and budget constraints often associated with government contracts.
However, the steady growth in this segment underscores Palantir’s continued relevance and strong standing within the government sector, which serves as a stable revenue stream. Government clients tend to maintain long-term partnerships that may potentially provide Palantir with a consistent top-line over time.
Q3 Business Update
Profitability Hurdle: Rising SBC Threatens Margin Growth
Palantir’s SBC expense shows inconsistency and growth over time, indicating a problematic cost structure. In Q3 2022, SBC was $140.3 million, then decreased to $114.4 million in Q3 2023, and now, in Q3 2024, it rose again to $142.4 million. SBC surged once more in Q3 2024, suggesting Palantir has not implemented stable measures to reduce or control SBC costs that make up a significant part of its overall expenses.
Although SBC is often used to retain talent in tech firms, its rising pattern may hinder Palantir’s capability to attain and sustain profitability for owners. Excessive reliance on SBC will dilute stockholder value and strain financial resources that could be directed toward growth initiatives, competitive research, and operational improvements. For a company that aims to scale rapidly, fluctuations and high SBC expenses may limit profits and restrict investment in core expansion areas.
Despite SBC volatility, Palantir has improved its net income over the observed period, moving from a loss to a profit. In Q3 2022, the company lost $123.9 million, and by Q3 2023, it had derived a profit of $71.5 million. In Q3 2024, this profit grew 2X YoY to $143.5 million. While the transition from a loss to a profit is a positive sign, the absolute net income remains modest compared to the SBC expense.
Even with increasing net income, the company’s SBC remains disproportionately high, which may limit the extent to which these profits can signal stable profitability. The relationship between SBC and net income suggests that while Palantir’s operations may be profitable on paper, the high SBC dampens the effective profit margin. The growth in net income is a positive indicator, but it is insufficient if overshadowed by rising SBC costs.
Yiazou
Moreover, in Q3 2022, SBC, as a percentage of net income, stood at -113.27%, meaning that SBC exceeded net loss, which is unsustainable. In Q3 2023, SBC as a percentage of net income jumped to 159.96%, reflecting that SBC costs were 1.6 times greater than the profit generated. Although this percentage fell to 99.23% in Q3 2024, SBC still accounted for nearly all of the remaining net income. This pattern suggests that even as Palantir’s net income grows, the company’s actual profitability is undermined by high SBC.
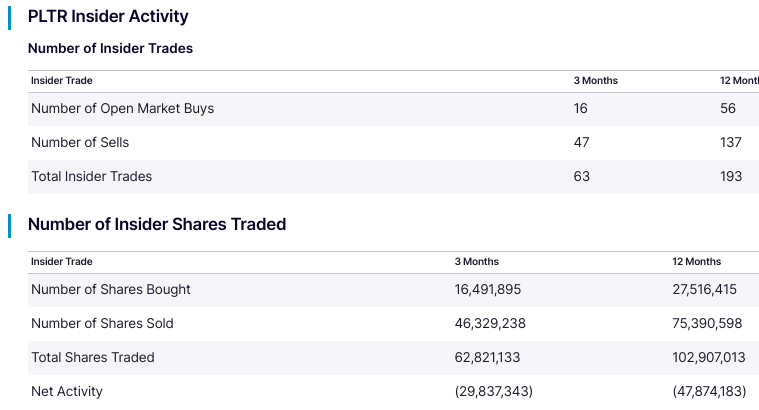
When SBC nearly equals or exceeds net income, it limits the stock’s valuations. This dynamic creates a fragile profit structure, if SBC continues to rise, the company may issue more shares and insiders will sell shares at higher prices that may continue to dilute the ownership of existing stockholders and distort the street sentiment. The notion that insiders are eating Palantir’s added market value (rapidly issuing shares at minimal exercise prices and selling them at higher market prices) while investors hold on to shares can considerably weaken PLTR’s market value growth.
nasdaq.com
Palantir Stock Price Target $64, With RSI at 81.66, Indicating Overbought Conditions and Pullback Is Back
PLTR trades around $56, closely aligned with its average price target of $54 for 2024, corresponding to the Fibonacci extension level of 1.236. The optimistic target of $64.0 aligns with the 1.618 Fibonacci extension, while the pessimistic target of $44 reflects the 0.786 level. These Fibonacci levels provide a framework for understanding potential support and resistance zones, indicating possible price movements based on recent short-term trends. Given these targets, the Fibonacci alignment suggests that Palantir’s price could experience substantial volatility, influenced by levels where significant buying or selling pressure may occur.
Moreover, the RSI for Palantir stands at a high of 81.66, signaling an overbought condition, often a precursor to price correction. Furthermore, a bearish divergence is present, even as the RSI line trends upwards. This divergence indicates a weakening of the upward momentum despite the recent positive trend and suggests a potential pullback if market sentiment shifts.
The Volume Price Trend (VPT) line shows a consistent uptrend, recording 1.73 billion against a moving average of 1.43 billion, hinting at sustained buying pressure. This volume-based trend may support continued upward price movement in the near term, though the divergence with RSI raises caution for potential corrections.
Yiazou (trendspider.com)
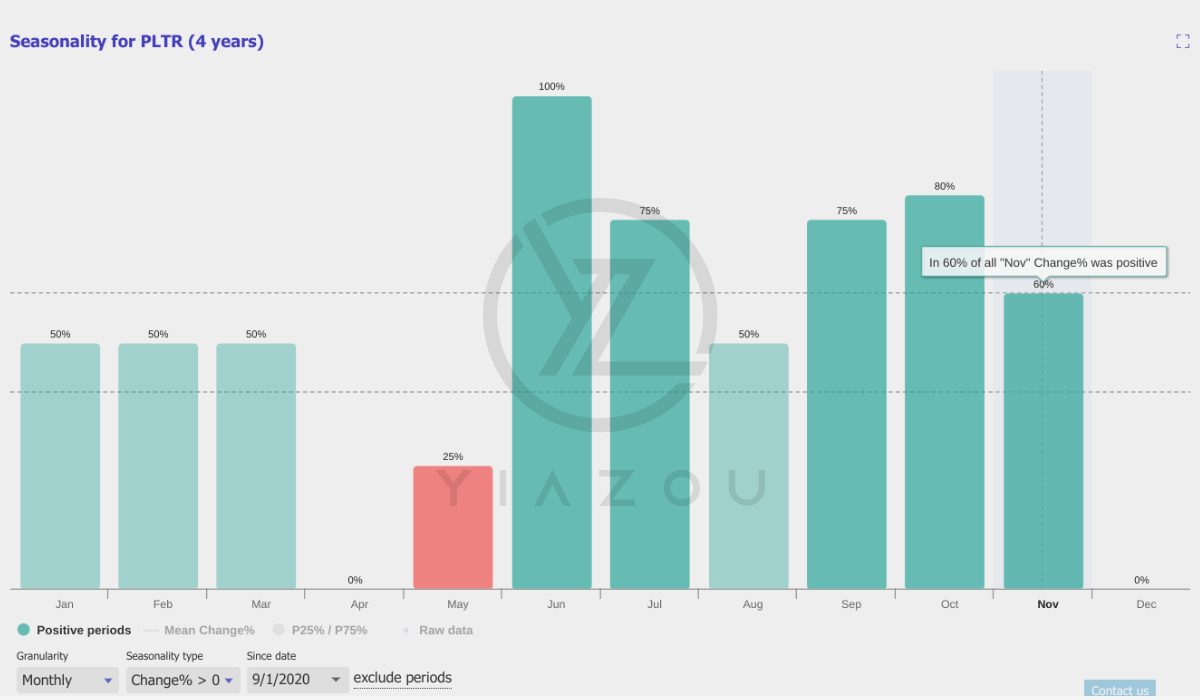
Seasonal analysis, based on 4 years, shows a 60% historical chance of a positive return in November, which aligns with the broader uptrend and reinforces the need to monitor technical indicators closely. While there is potential for further gains, one should be cautious of overbought signals and possible rapid trend reversals.
Yiazou (trendspider.com)
Takeaway
Palantir’s impressive customer growth and expanding commercial reach solidify its position as an AI and data analytics leader. However, high SBC costs and an overbought valuation signal potential short-term risks. Investors may consider booking some profits while remaining optimistic about Palantir’s long-term growth potential as it innovates and captures demand across sectors.
Analyst’s Disclosure: I/we have a beneficial long position in the shares of PLTR either through stock ownership, options, or other derivatives. I wrote this article myself, and it expresses my own opinions. I am not receiving compensation for it (other than from Seeking Alpha). I have no business relationship with any company whose stock is mentioned in this article.
Seeking Alpha’s Disclosure: Past performance is no guarantee of future results. No recommendation or advice is being given as to whether any investment is suitable for a particular investor. Any views or opinions expressed above may not reflect those of Seeking Alpha as a whole. Seeking Alpha is not a licensed securities dealer, broker or US investment adviser or investment bank. Our analysts are third party authors that include both professional investors and individual investors who may not be licensed or certified by any institute or regulatory body.
