Summary:
- PayPal’s stock has experienced significant declines in the past two years, attracting value investors.
- Decelerating Total Payment Volume and declining Transaction Margin suggest lower future EPS growth.
- Free Cash Flow yield of 8-9% not particularly attractive given underlying business headwinds and high Stock-Based Compensation expense.
Editor’s note: Seeking Alpha is proud to welcome Balance Sheet Nerd as a new contributor. It’s easy to become a Seeking Alpha contributor and earn money for your best investment ideas. Active contributors also get free access to SA Premium. Click here to find out more »
Erikona
In spite of PayPal’s (NASDAQ:PYPL) share price falling more than 80% from its 2021 highs, a closer look to its transaction margin and operating margin, and to its Free Cash Flow suggests that the stock is still not cheap enough to offer a solid margin of safety. With an FCF yield of just 8-9%, I give this stock a HOLD rating, as I believe there currently are better opportunities elsewhere.
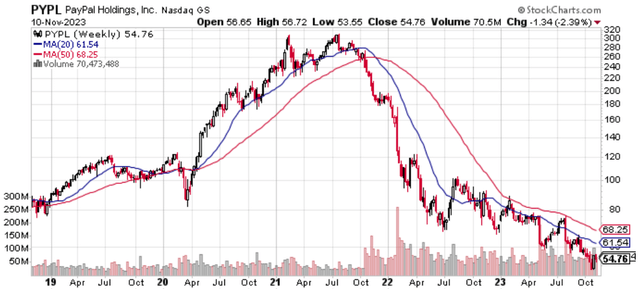
PayPal’s stock has been extremely weak during the past two years, first losing ~70% from the 2021 peak of $310 to a trough in 2022 of around $70, and then an additional ~20% decline to the current level of mid-fifties, reaching levels not seen since 2017.
It is therefore natural that such a free-falling valuation has started to attract so-called value investors, trying to catch the bottom. In this article, my aim is to try to assess the attractiveness of the investment in PayPal at the current market cap of ~$60bn, by looking at a few data points that I have not seen much discussed in other articles.
I will first look at the underlying business, secondly at the new management’s remarks, and thirdly I will look at valuation.
Business Analysis
PayPal is a technology platform that enables digital payments on behalf of consumers and merchants worldwide. It earns revenue primarily by charging fees for completing payment transactions and payment-related services, which are based on the volume of activity processed on the platform (referred to as “ Total Payment Volume”, or TPV). TPV is thus among the most watched indicators of PayPal’s business performance since it is closely correlated with revenue.
The fees PayPal earns are usually charged to merchants, as consumers are not charged for drawing from their accounts. However, PayPal also generates revenue from consumers on fees charged on currency exchanges, instant transfers, and on interest and fees from credit products.
I will now make a few points on Total Payment Value, Transaction Margin, and Operating Margin.
Total Payment Value
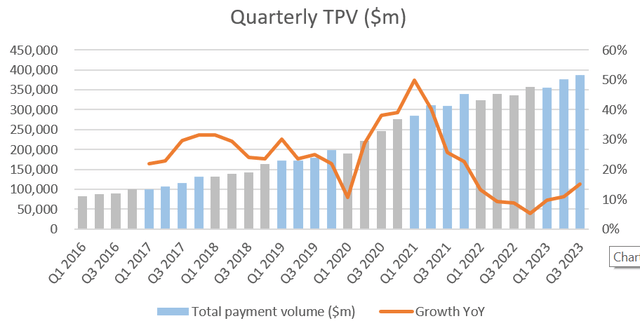
Let’s start by looking at the most fundamental indicator of revenue growth: we see how TPV has steadily increased since the separation from eBay and has experienced solid momentum in the first three quarters of 2023, with YoY increases between 10% and 15%. It is clear from the chart, however, that growth rates are not what they used to be anymore (avg. of ~25% in the years before the pandemic), and from the current 12-month trailing TPV of ~$1.5trn, it will be increasingly difficult to grow faster than the online payments industry as a whole.
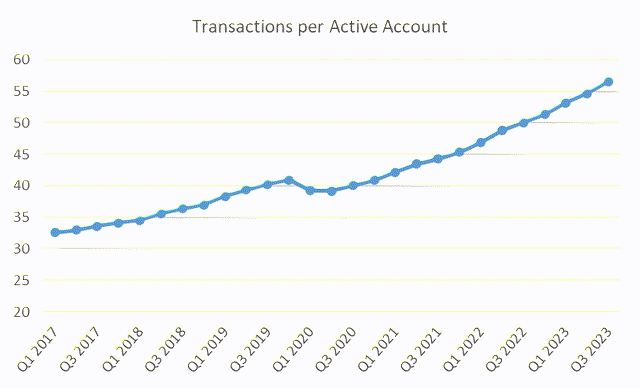
In my opinion, the lower expected growth rates of PayPal’s TPV are simply an indication of a maturing industry with increasing competition (think Stripe, Block, Adyen), rather than an indication of PayPal’s inevitable obsolescence, that a few people here on SA advocate for. In fact, while it is true that the number of active accounts has stalled (Q3 2023 Active Accounts were 428m, -1% YoY), I find it very believable that this simply reflects the churn of minimally engaged accounts, that were bringing no revenue for the company either way. I think looking at the absolute number of transactions is a much more useful way to assess the situation, as after all PayPal generates more revenues the more transactions are made, not the more accounts there are. And it is in fact the case that Transactions per Active Account are still growing steadily (13% YoY in Q3 2023).
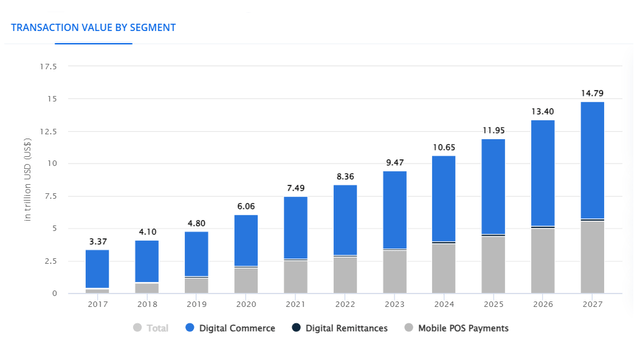
Overall, as PayPal continues to expand its unbranded payment processing (primarily Braintree), I believe that it will still manage to sustain a positive growth rate in line with the global digital payment industry, which according to Statista is expected to grow at ~12% annually to reach $15trn in 2027.
Transaction Margin
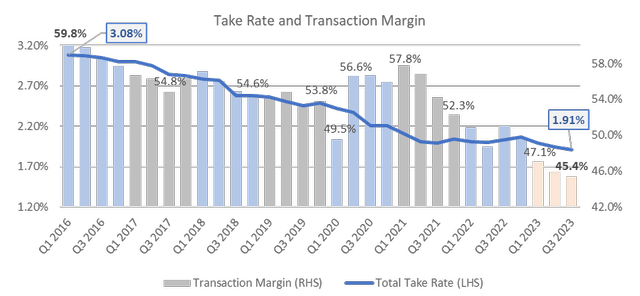
If we look at PayPal’s Transaction Margin over the past years, we get a very strong clue about the high competition in the payments industry. To illustrate this, let’s focus on two very important ratios that PayPal discloses in its quarterly investor presentations: the Total Take Rate (= total revenue divided by TPV) and Transaction Expense Rate (= transaction expense divided by TPV).
The Total Take Rate gives us a sense of how much, per average dollar of payment volume processed, PayPal actually charges in fees. I wrote average dollar on purpose because not every payment processed is born the same: around ~30% of TPV comes from PayPal’s Branded Checkout (FY2022), and this is the most profitable type of payment for the company; then another ~30% comes from Payment Processing Services (or unbranded processing), which primarily comprises Braintree; and then ~25% of TPV comes from P2P (or Person to Person payment), on which PayPal likely generates no fees. I couldn’t find a precise breakdown that accounts for 100% of TPV, but the remaining ~15% might come from partner payment solutions.
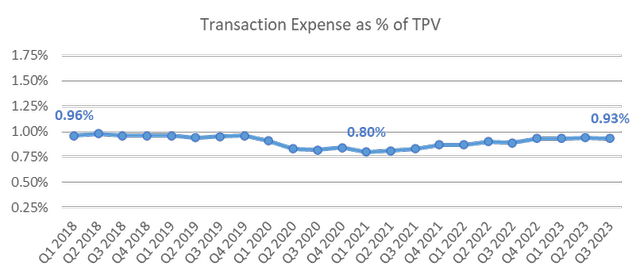
The Transaction Expense Rate, on the other hand, is the cost per dollar of TPV that PayPal incurs to accept a customer’s funding source of payment, which includes fees paid to payment processors and other financial institutions when drawing funds from a customer’s credit or debit card, bank account, or other funding source stored in their digital wallet.
Below is the chart for the Transaction Expense Rate, which has hovered between 0.80% and 1.00% since 2018, indicating that the average cost of processing a payment has remained largely unchanged.
What is more striking, however, is the evolution of the Total Take Rate. As shown from the blue line in the chart below (which starts from Q1 2016) it has decreased from 3.08% in Q1 2016 to 1.91% in the latest quarter. So on the one hand we have that the cost of processing $1 of payment is constant (0.93% in Q3 2023), but on the other hand, we have that PayPal is generating less and less revenue for the same dollar processed. The consequence is obvious, namely a compression in the Transaction Margin (“Net Revenue – Transaction Expense”, a sort of Gross Margin), which is represented by the bars in the same chart below. The Transaction Margin has decreased from 59.8% at the start of 2016, to the most recent 45.4% of Q3 2023, an astonishing drop of almost 15%.
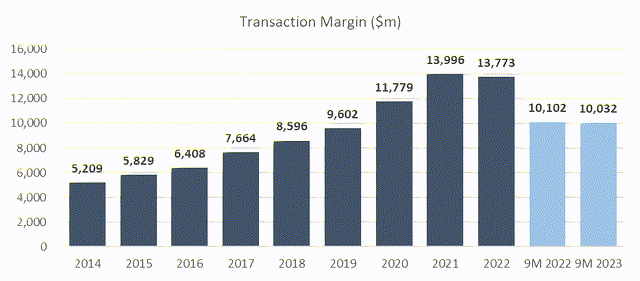
To sum up, while costs are remaining the same for each dollar processed, PayPal is able to charge less and less in fees to its customers, and this most likely reflects a shift of payment volume from the more profitable Branded Checkout to the less profitable Unbranded Checkout. This is a strong indicator of the high level of competition in the industry and of the fact that PayPal does not have such a strong moat to defend its pricing after all. As said before, this is not to say that its products are obsolete, but I simply suggest more caution when assuming future EPS growth rates: with a declining Transaction Margin, $1 of additional payment volume will contribute increasingly less to the bottom line.
This already happened in 2022 and in the first 9M 2023, as clear from the chart below: even though PayPal has had positive TPV growth, 2022 Transaction Margin is lower in absolute dollar terms, and 9M 2023 Transaction Margin is lower than it was in 9M 2022, suggesting that it is very possible that it will deliver a second year of consecutive Transaction Margin decline.
Cost-cutting and Operating Margin
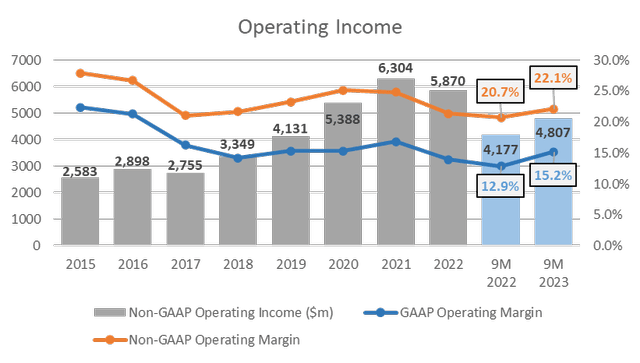
So we have seen how PayPal has decreasing Transaction Margins, but you might have heard that their expected 2023 EPS growth rate is positive. This is all thanks to cost-cutting measures. If we look at the GAAP Operating Income margin bridge below, we see how against a 3.9% drop in Transaction Margin in the first 9M 2023 compared to end of 2022, PayPal compensated with a 5.1% increase in margin thanks to a reduction in Non-transaction Expenses. From the chart below the bridge, we have a historical series of Operating Income. We see that GAAP OI has gone up during 9M 2023 compared to the same period the previous year, and the margin has expanded from 12.9% to 15.2% (and it has also increased from 13.9% compared to FY2022).
PayPal’s 10-K and 10-Q filings PayPal’s 10-K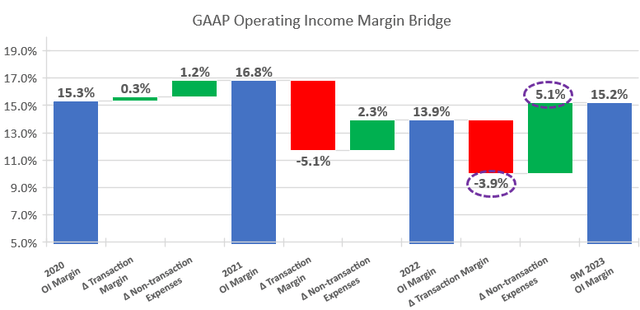
Views on Management
In the Q3 2023 earnings call the new CEO Alex Chriss made a few comments to address the two points I made above: A) transaction margin compression and B) non-transaction expenses reduction.
On A) he said the following (italics are the author’s):
The weight of the organization will be squarely behind [..] driving margin expansion in Braintree and other products for large enterprises.
[..] as a management team, we will be guided by margin-accretive revenue growth. Over time, I believe we have a tremendous opportunity to grow revenue outside of purely transaction-related volume as we continue to serve our customers’ core needs.
While on B) he said:
Simply put, our cost base remains too high, it is actually slowing us down. As such, I am in the process of evaluating our most profitable growth priorities and aligning our resources to those priorities. We will become leaner, more efficient and more effective [..].
[..] I am laser-focused on operating leverage and making sure we manage our cost base with relentless attention and commitment. As I’ve said before, I believe our cost base and complex structure is slowing us down. We have opportunities to accelerate our revenue growth, while reducing our expenses, helping further drive operating leverage.
Clearly, this is a good sign. Mr. Chriss has also promised additional disclosure on PayPal’s business, KPIs and important operating metrics, to come in the next quarterly report, which will be interesting to read. However, it must be kept in mind that it’s difficult for a single man to change wider industry factors, like fierce competitors that drive margin compression, let alone in a few quarters. Also, while there certainly may be headroom to trim more fat from the cost structure, it cannot be exploited indefinitely to prop up falling operating margins.
Valuation
Stock-Based Compensation and Buybacks
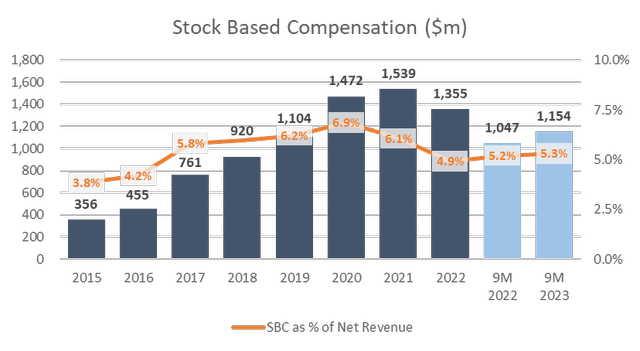
As many people know, PayPal has had a significant Stock-Based Compensation expense for the past years. The chart below shows the amount of SBC since 2015, which reached $1.5bn in 2021.
PayPal reports both GAAP and non-GAAP figures, and the difference between GAAP and non-GAAP Operating Income is explained by Stock-Based Compensation for ~70%, and a further ~20% by amortization of acquired intangible assets.
In my opinion, given the recurrence and high amount of the SBC expense, it makes no sense to use non-GAAP earnings to value this company, as they simply do not reflect the true underlying earnings power of the business.
This also leads me to my final point, namely stock buybacks, which management is using as their preferred method of shareholder remuneration. Currently, almost 100% of free cash flow is being used to repurchase shares, as disclosed in the Q3 2023 quarterly presentation (see snip below). An interesting fact that does not inspire confidence though, is that since 2016 PayPal has allocated $20.5bn in stock repurchases, while the number of shares has dropped by a mere 11%, from 1,208m at the end of FY2016 to 1,078m in Q3 2023. It appears evident that a significant portion of the $20.5bn has been directed towards monetizing the shares of the receivers of SBC, rather than shareholders. This reinforces the idea that GAAP earnings are more relevant to consider than non-GAAP earnings.
PayPal’s Q3 2023 Investor Presentation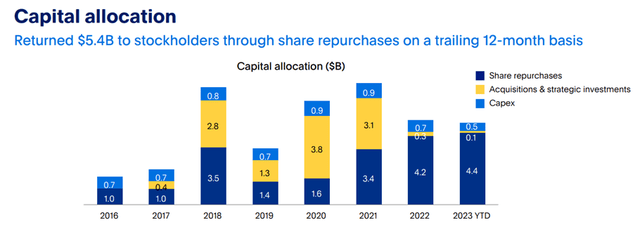
One positive thing that must be noted, however, is that of these $20.5bn of buybacks, $10.6bn were used on repurchases with the stock price above $100. With the stock now trading in the low fifties, it is likely that we will see a more marked effect of share count reduction going forward. On the back of this, management noted in the Q3 2023 presentation the following statement:
On a trailing 12-month basis, PayPal returned $5.4B to stockholders by repurchasing ~75M shares, reducing weighted average shares by 5% y/y.
So, just in the last 12 months, they achieved half of the share reduction since 2016.
Free Cash Flow
Moving to FCF, below you can see a chart with Free Cash Flow since 2016 as per management definition (after the adjustment for held-for-sale loans), including the guidance for FY2023 (as disclosed in the Q3 2023 presentation). I think this metric represents a useful guide when thinking about potential future returns to shareholders.
PayPal’s Annual Reports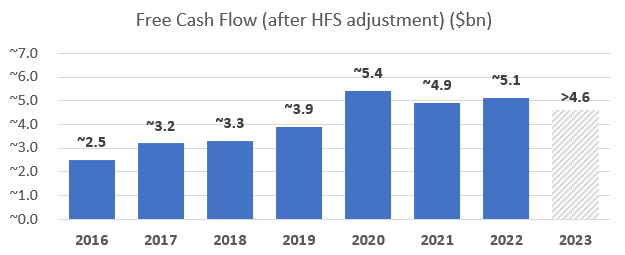
If I consider both the points made above about the shrinking transaction margin and the inability to cut non-transaction expenses indefinitely, and the fact that PayPal has not seen any FCF growth since 2020, I am not very optimistic about the potential of the stock to significantly increase from current levels. After all, if FCF is not growing, there is little reason for the stock to grow too.
In fact, if we assume a base case of FCF staying around ~$5bn for the next couple of years, this equates to an ~8-9% FCF yield on a current market cap of $60bn. If $5bn looks too conservative to you in light of the CEO’s remarks, keep in mind that any restructuring and cost-cutting will bring nontrivial cash expenses (think severance packages), and any immediate growth from adjacent services that the CEO has in mind will likely require some CapEx and likely won’t be very profitable since day 1.
I believe that focusing on the expected FCF yield (which in this case correlates highly to buyback yield) allows for a more sensible understanding of the potential merits of this investment, rather than purely focusing on EPS (let alone non-GAAP EPS). Too often it is the case that people apply an arbitrary P/E multiple on EPS that they deem appropriate, which will vary from person to person based on whether they like the stock or not.
It must be said that there is a possibility that PayPal will grow faster and more profitably than expected, and that 2024 FCF will come in substantially higher than $5bn. This could happen should the CEO be successful in stopping the margin compression and in the reorganization of the cost structure. At the current share price level, an argument could be made about a stock purchase representing an 8-9% expected FCF yield plus a free call option on the success of management.
Conclusion
To sum up, based on the slower expected growth in TPV compared to the past and on the eroding transaction margin, I believe that PayPal does not have, at least anymore, an identifiable moat around its business. In my opinion, the 8-9% expected return on the investment is not high enough to justify the relatively high risks of further business deterioration, especially in the current interest rate environment, where you can search for high-yielding assets with considerably lower risk (for example, midstream O&G dividend yields of close to 10%).
However, I believe the current forward GAAP P/E of ~15x is neither very high nor very low, and as I said above, on top of the 8-9% FCF yield you can purchase for free a theoretical call option on the new management, which can turn around at least a bit the margin decline and provide some unexpected growth. Personally, given that I tend to be a bit more conservative than most, and given that I see other attractive opportunities with the same yield but in cash (a dividend vs PayPal’s buyback), I give this stock a HOLD, expressing a neutral view on valuation.
Note: I am long the stock exclusively due to short-term option trading strategies.
Analyst’s Disclosure: I/we have a beneficial long position in the shares of PYPL either through stock ownership, options, or other derivatives. I wrote this article myself, and it expresses my own opinions. I am not receiving compensation for it (other than from Seeking Alpha). I have no business relationship with any company whose stock is mentioned in this article.
Seeking Alpha’s Disclosure: Past performance is no guarantee of future results. No recommendation or advice is being given as to whether any investment is suitable for a particular investor. Any views or opinions expressed above may not reflect those of Seeking Alpha as a whole. Seeking Alpha is not a licensed securities dealer, broker or US investment adviser or investment bank. Our analysts are third party authors that include both professional investors and individual investors who may not be licensed or certified by any institute or regulatory body.

