Summary:
- PayPal’s prices movements sine Q2 2024 earnings report show sign of breaking out of a long consolidation pattern.
- The potential of a valuation expansion, combined with the improved operations metrics reported in Q2, can support more upside.
- In particular, PayPal’s free cash flow and owner’s earnings significantly exceed its accounting EPS.
- This indicates its true earning power and valuation discounts are more than what meets the eye.
Andrey Zhuravlev
PYPL stock: Previous thesis and new developments
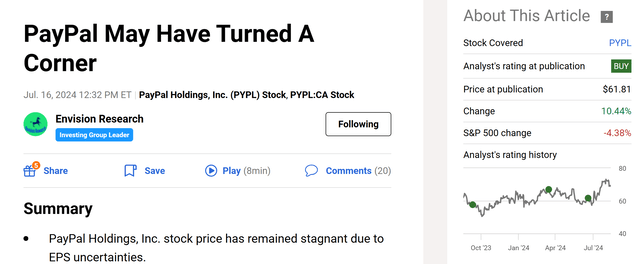
I last wrote about PayPal Holdings, Inc. (NASDAQ:PYPL) (NEOE:PYPL:CA) about two months ago. As you can see from the screenshot below, the article was titled “PayPal May Have Turned A Corner” and was published by Seeking Alpha on July 16, 2024. In the article, I argued for a “buy” rating based on the following considerations:
PayPal Holdings, Inc. stock price has remained stagnant due to EPS uncertainties. Despite EPS headwinds, I see improvement in revenues, earnings, and operating margins. Further positives include its leading market share, loyal user base, strong balance sheet, and cheap valuation ratios.
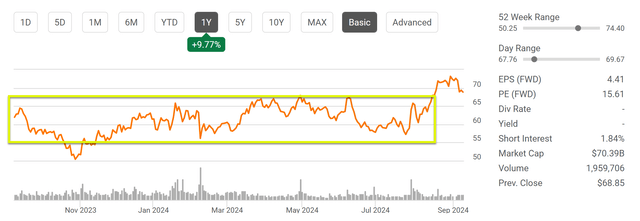
Since that writing, the company has released its 2024 Q2 earnings report (ER), and its price also diverged by about 14% from the broader market as seen in the chart above (about 10% gain from PYPL vs. about 4% loss from the broader market). Thus, I thought it would be helpful to write this follow-up article to incorporate these new developments. Notably, since my last writing, its stock prices have broken out of a consolidation window and peaked at about $74, representing a 52-week high. Its stock prices have been treading water for much of this year and moving sideways in a range of around $55 to $65 (as highlighted in the yellow box below).
Against this background, the thesis of this article is that the new developments outlined in its Q2 ER can support more upside potential for its stock prices from here. PayPal delivered a strong quarter in my view. Its revenues dialed in at $7.7 billion, or a 9% annual advance. Such robust growth was driven by fundamentally improved operating metrics during the period, such as total payment volumes, payment transactions, and transactions per active account. In addition, the company’s cost control strategies have been effective. Operating margins improved by nearly 1% year over year, supporting the bottom-line growth as well.
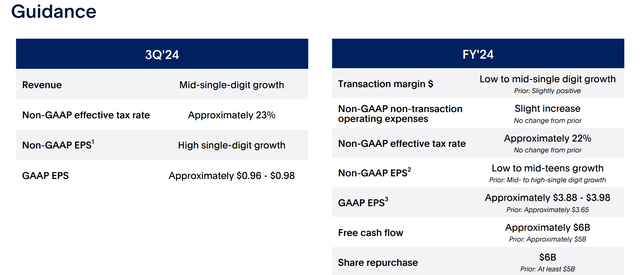
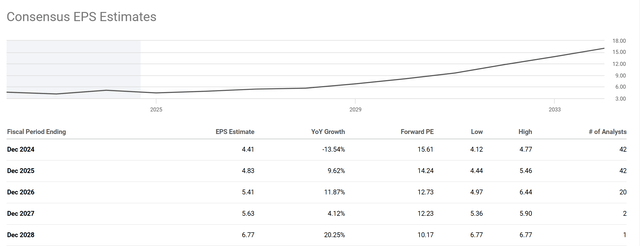
Looking ahead, the company also updated its full-year guidance. As seen from its ER slide below, its GAAP EPS is estimated to be in the range of approximately $3.88 to $3.98 for FY’24, compared to the prior $3.65. It expects non-GAAP EPS to grow at a low to mid-teens digit rate, and the consensus estimate points to a figure of $4.41 per share. Finally, PYPL’s new guidance for free cash flow is about $6 billion, compared to the prior figure of approximately $5.8 billion.
Next, I will explain why these accounting metrics could be understating its true earning power and thus its return potential.
PYPL stock: accounting EPS understates its true earning power
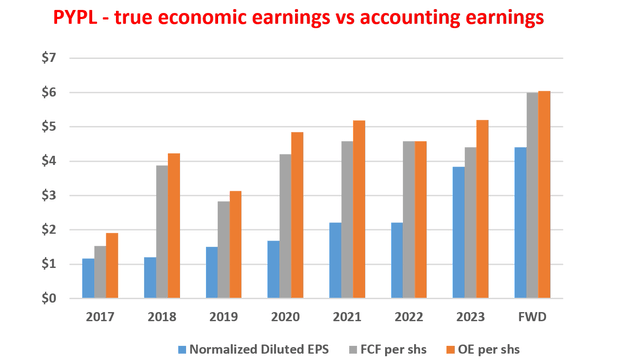
You can see why/how the accounting earnings underestimate PYPL’s true owner’s earnings from the next chart. This chart compares PYPL’s accounting EPS (fully diluted and shown by the blue bars) to its free cash flow (FCF shown by the grey bars) per share. As seen, PYPL’s FCF has consistently and substantially exceeded its accounting EPS, which is a good hint that the accounting EPS understates its true earnings severely. For FY 2024 as just mentioned, the FCF guidance of $6 billion translates into about $6 of FCF per share at the current share count, far exceeding both the GAAP and Non-GAAP guidance.
Next, remember that, from a business owner’s perspective, the FCF itself is an underrepresentation of the true economic earnings (aka, the owners’ earnings, OE). I first learned the concept from Warren Buffett, and details are provided in my earlier writings. The essence of the OE concept is quoted below for ease of reference:
In the calculation of FCF, ALL CAPEX expenses have been considered a cost. However, only the maintenance CAPEX should be considered as a cost. And the owner’s earnings should be free cash flow plus the portion of CAPEX that is used to fuel the growth (i.e., the growth CAPEX). As a result, the OE is even higher, as shown by the orange bars in the first chart below.
PYPL, as a growth stock, has spent the majority of its CAPEX on growth, more than 2/3 on average in the past few years according to my analysis. Thus, once the growth CAPEX is adjusted for, its OE is not only higher than the accounting EPS (either in GAAP or non-GAAP terms) but also higher than its FCF as seen in the chart below.
PYPL stock: valuation is even cheaper than on the surface
A factor many PYPL bulls quote is the cheap valuation. Indeed, the stock’s current P/E is very attractive both in absolute terms and relative terms. The chart below summarizes PYPL stock’s valuation grade. As seen, its shares are trading at only 13.63x P/E on a TTM and non-GAAP basis, despite the sizable rally since my last writing. This is more than 59% lower than its 5-year average of 33.57. The valuation discount is even deeper than on the surface, with the discrepancy between its accounting EPS and true OE. As seen in the second chart below, its FY1 P/E is quoted at 15.6x, based on an accounting EPS of $4.41 per share. However, its full-year guidance points to an FCF of about $6 per share, as aforementioned. The FWD P/FCF ratio is thus only 11.3x at the price as of this writing, and its P/OE ratio is even lower (only about 10.7x in my estimates) for the reasons discussed above.
Other risks and final thoughts
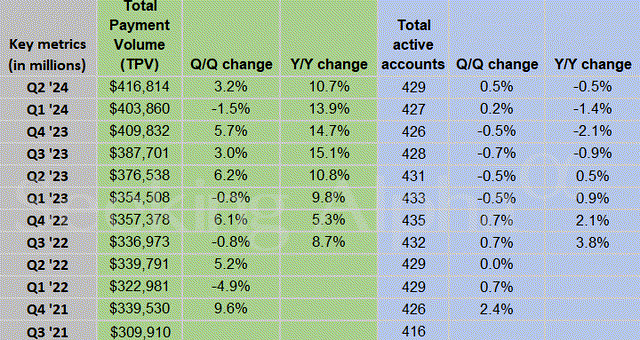
In terms of downside risks, the number of active accounts has been stagnating lately. The chart below shows the total active accounts of PYPL stock in recent quarters. As seen, the number peaked at 435 million accounts in Q4 2022. The growth rate then started fluctuating since then. On a year-over-year basis, the number has declined by 0.5% in Q2 2024 to 429 million. Judging by its Q2 numbers, it seems to me that some increased activity among the existing customer base helped to offset the impact to some degree. Looking further out, it’s unclear to me how/whether the number can resume its previous growth rates given the current utilization rate of the platform by merchants and also the overall macroeconomic environment.
All told, my verdict is that the stock offers a highly skewed return/risk profile under its current conditions. With a P/FCF ratio of 11x and a double-digit profit growth projection (as seen in the chart above), the stock offers an appealing GARP opportunity (Growth at a reasonable price). Its valuation is even more attractive than on the surface, considering the discrepancy between FCF and OE. The potential of a valuation expansion, combined with the improved operations metrics, provides strong support for the stock to break out its consolidation pattern and considerable upside potential.
Analyst’s Disclosure: I/we have no stock, option or similar derivative position in any of the companies mentioned, and no plans to initiate any such positions within the next 72 hours. I wrote this article myself, and it expresses my own opinions. I am not receiving compensation for it (other than from Seeking Alpha). I have no business relationship with any company whose stock is mentioned in this article.
Seeking Alpha’s Disclosure: Past performance is no guarantee of future results. No recommendation or advice is being given as to whether any investment is suitable for a particular investor. Any views or opinions expressed above may not reflect those of Seeking Alpha as a whole. Seeking Alpha is not a licensed securities dealer, broker or US investment adviser or investment bank. Our analysts are third party authors that include both professional investors and individual investors who may not be licensed or certified by any institute or regulatory body.
As you can tell, our core style is to provide actionable and unambiguous ideas from our independent research. If your share this investment style, check out Envision Early Retirement. It provides at least 1x in-depth articles per week on such ideas.
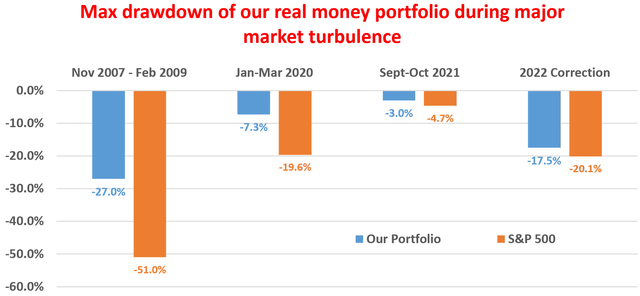
We have helped our members not only to beat S&P 500 but also avoid heavy drawdowns despite the extreme volatilities in BOTH the equity AND bond market.
Join for a 100% Risk-Free trial and see if our proven method can help you too.
