
Summary:
- PayPal’s financial outlook is characterized by complexities, with optimistic growth scenarios potentially hindered by declining net income and challenges in achieving the required revenue growth rates.
- The company’s financial decisions, including a significant share repurchase program, raise questions about the potential impact on returns and cash flow.
- A conservative target of $56.60 and a “hold” rating are assigned to PayPal, reflecting a cautious perspective on its near-term performance.
- The uncertain economic landscape, marked by the Federal Reserve’s efforts to reduce purchasing power and persistent inflation, further underscores the need for a restrained outlook.
- Overall, while PayPal presents opportunities for growth, the potential downside risks and economic uncertainties suggest a measured approach to investment.
Justin Sullivan
Thesis
In light of the complex dynamics shaping PayPal Holdings, Inc. (NASDAQ:PYPL) financial landscape, a cautiously optimistic outlook emerges, underscoring the importance of a prudent investment approach. With a conservative target of $56.60 and a “hold” rating, the company’s immediate future is viewed through a measured lens. This stance reflects concerns over declining net income and the challenges associated with achieving the required revenue growth, as well as the potential repercussions of financial decisions such as an extensive share repurchase program. Amidst economic uncertainties, typified by the Federal Reserve’s endeavors to reduce purchasing power and persistent inflation, this thesis highlights the need for a tempered perspective on PayPal’s near-term performance.
Overview
PayPal surprised the community in Q3 by surpassing revenue and earnings expectations. However, they have reaffirmed their Q4 earnings target of $1.38 per share, which aligns closely with analysts’ predictions.
Another noteworthy development is their announcement that they will repurchase shares in 2024, with a total value of $5 billion. In my opinion, this amount appears excessive given the company’s cash flow generation.
Furthermore, as you can observe in the financials section, while PayPal may have exceeded earnings expectations, their Q3 TTM net income is approximately 9% lower than Q2’s TTM net income. This indicates that PayPal’s net income did not decrease as significantly as analysts had anticipated, which is a positive outcome.
PayPal Holdings’ (PYPL) stock rose over 6%, with Q3 earnings and revenue surpassing Wall Street estimates. However, the company’s Q4 earnings expectations of $1.38, trailed the average analyst estimate of $1.40. The company also reaffirmed expectations for 2023 share repurchases of approximately $5B. The company also named Jamie Miller, most recently Global CFO at EY, its chief financial officer, effective Nov. 6.
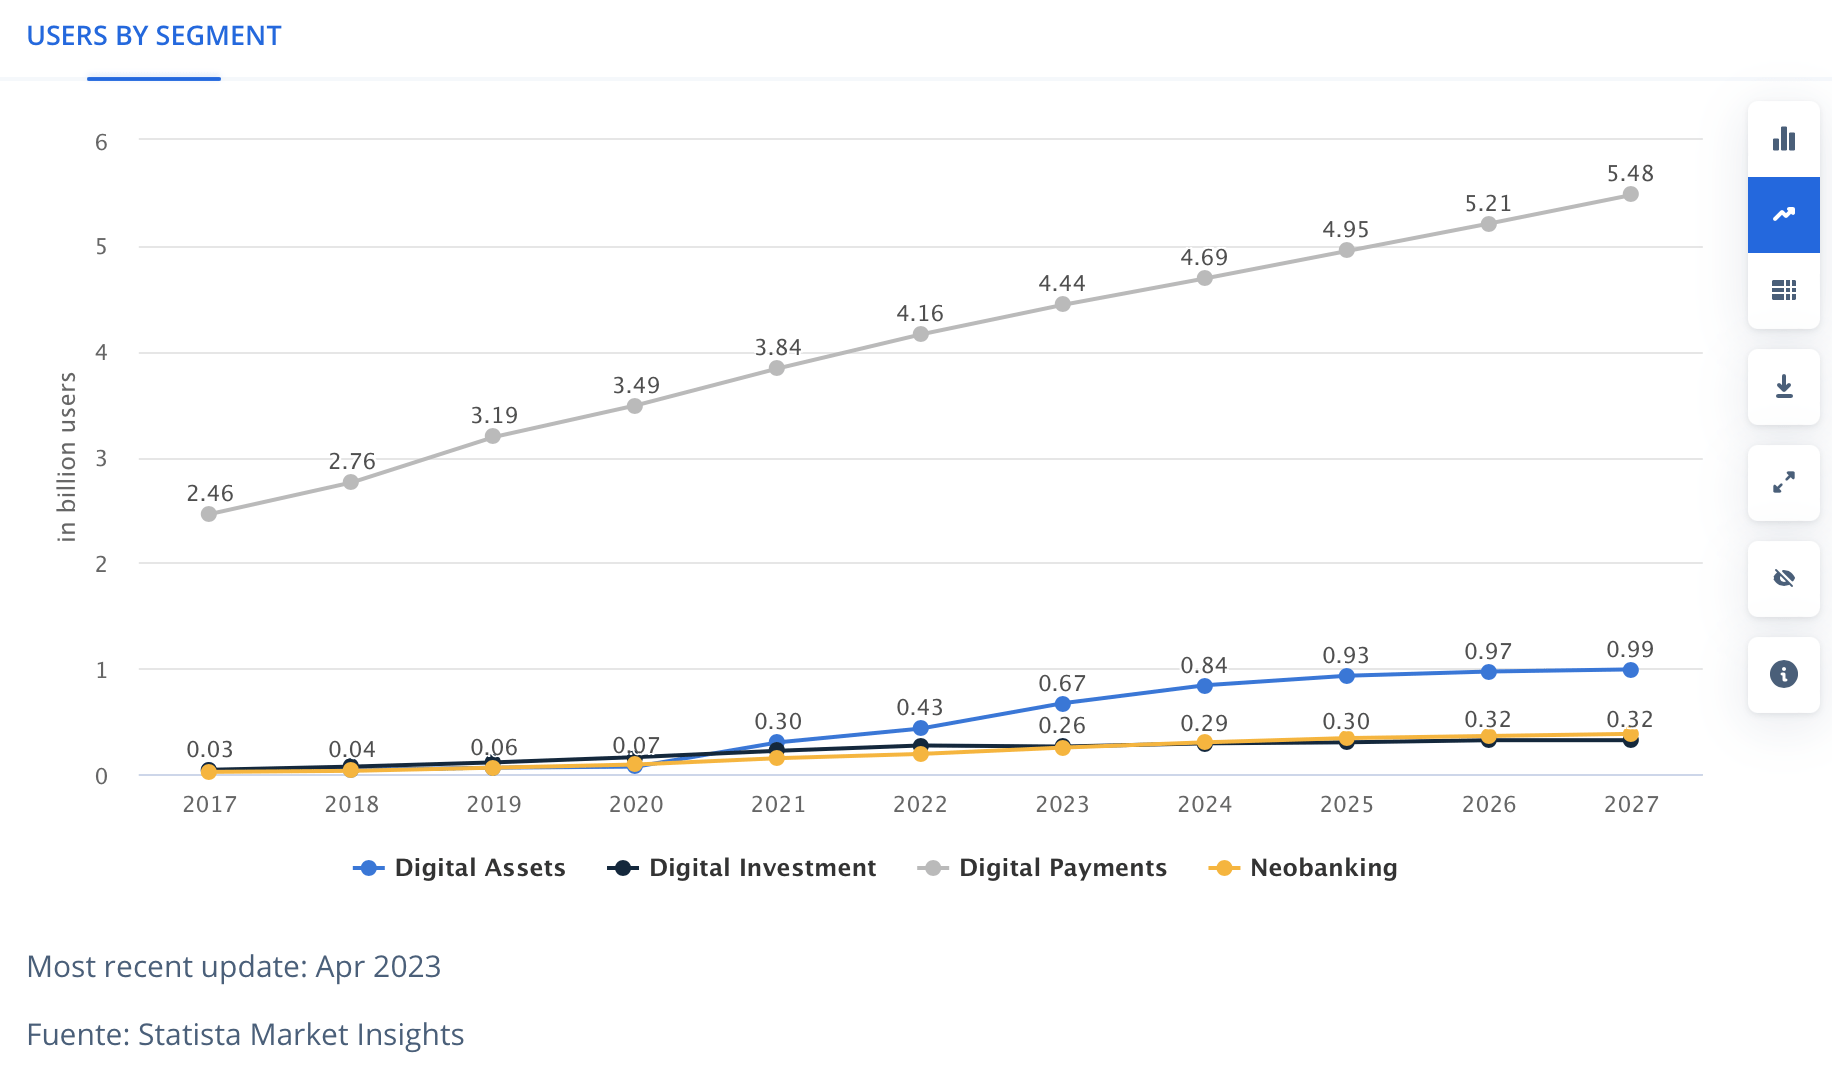
Fintech Market User Growth Projections
The fintech market is anticipated to reach 5.48 billion users by 2027, which signifies an annual increase of 5.85% from 4.44 billion in 2023.
In the previous five-year period (2019-2023), the market observed a growth rate of 9.79% in new user adoption. This marks a slowdown in the adoption of fintech for digital payments, the market in which PayPal operates.
Statista
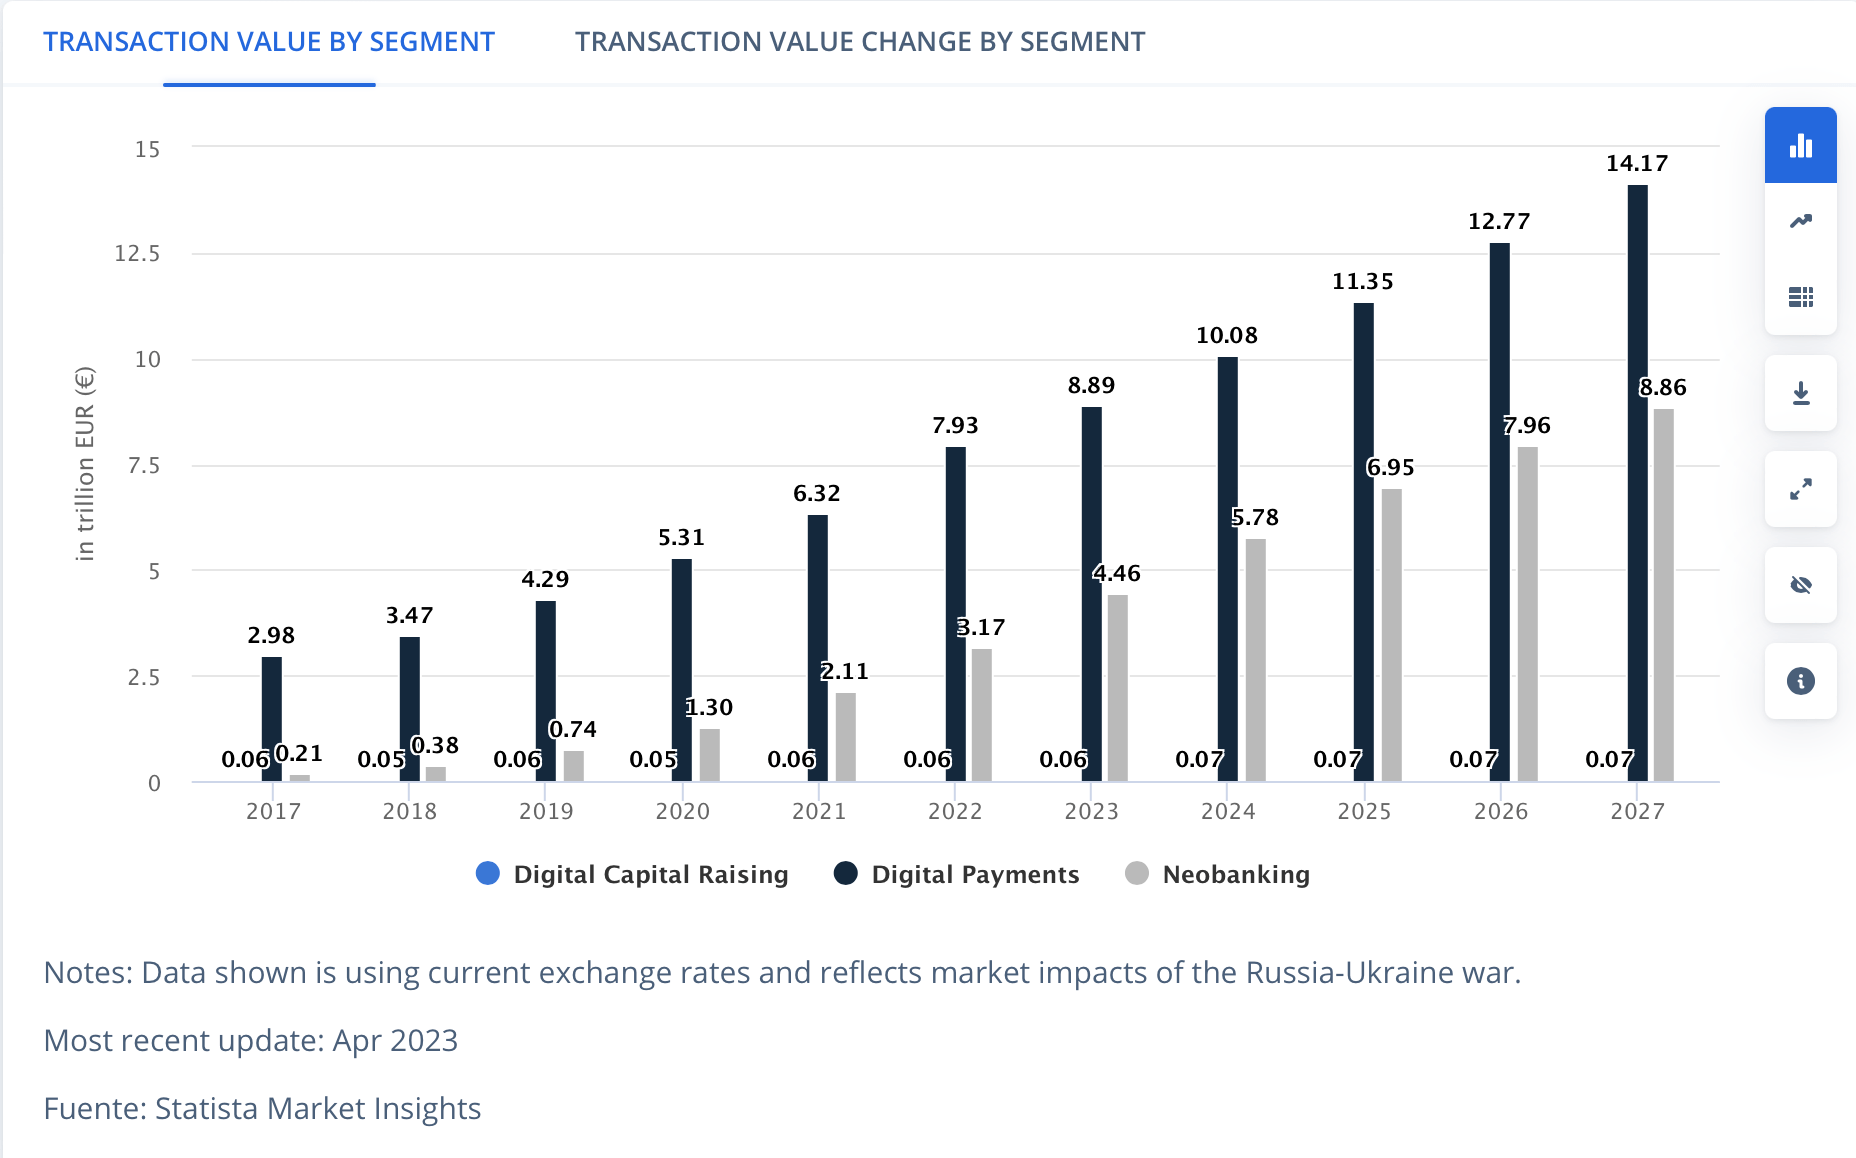
Fintech Market Transaction Volume Growth Projections
The fintech digital payments market is poised to achieve a transaction volume of approximately $14.17 trillion by 2027, a significant increase from the $8.89 trillion recorded in 2023. This projection implies an annual CAGR of 14.84%, significantly surpassing the projected user growth rate of 5.85%. This suggests that new users will need to conduct larger transactions for digital payment companies, like PayPal, to sustain substantial growth.
Statista
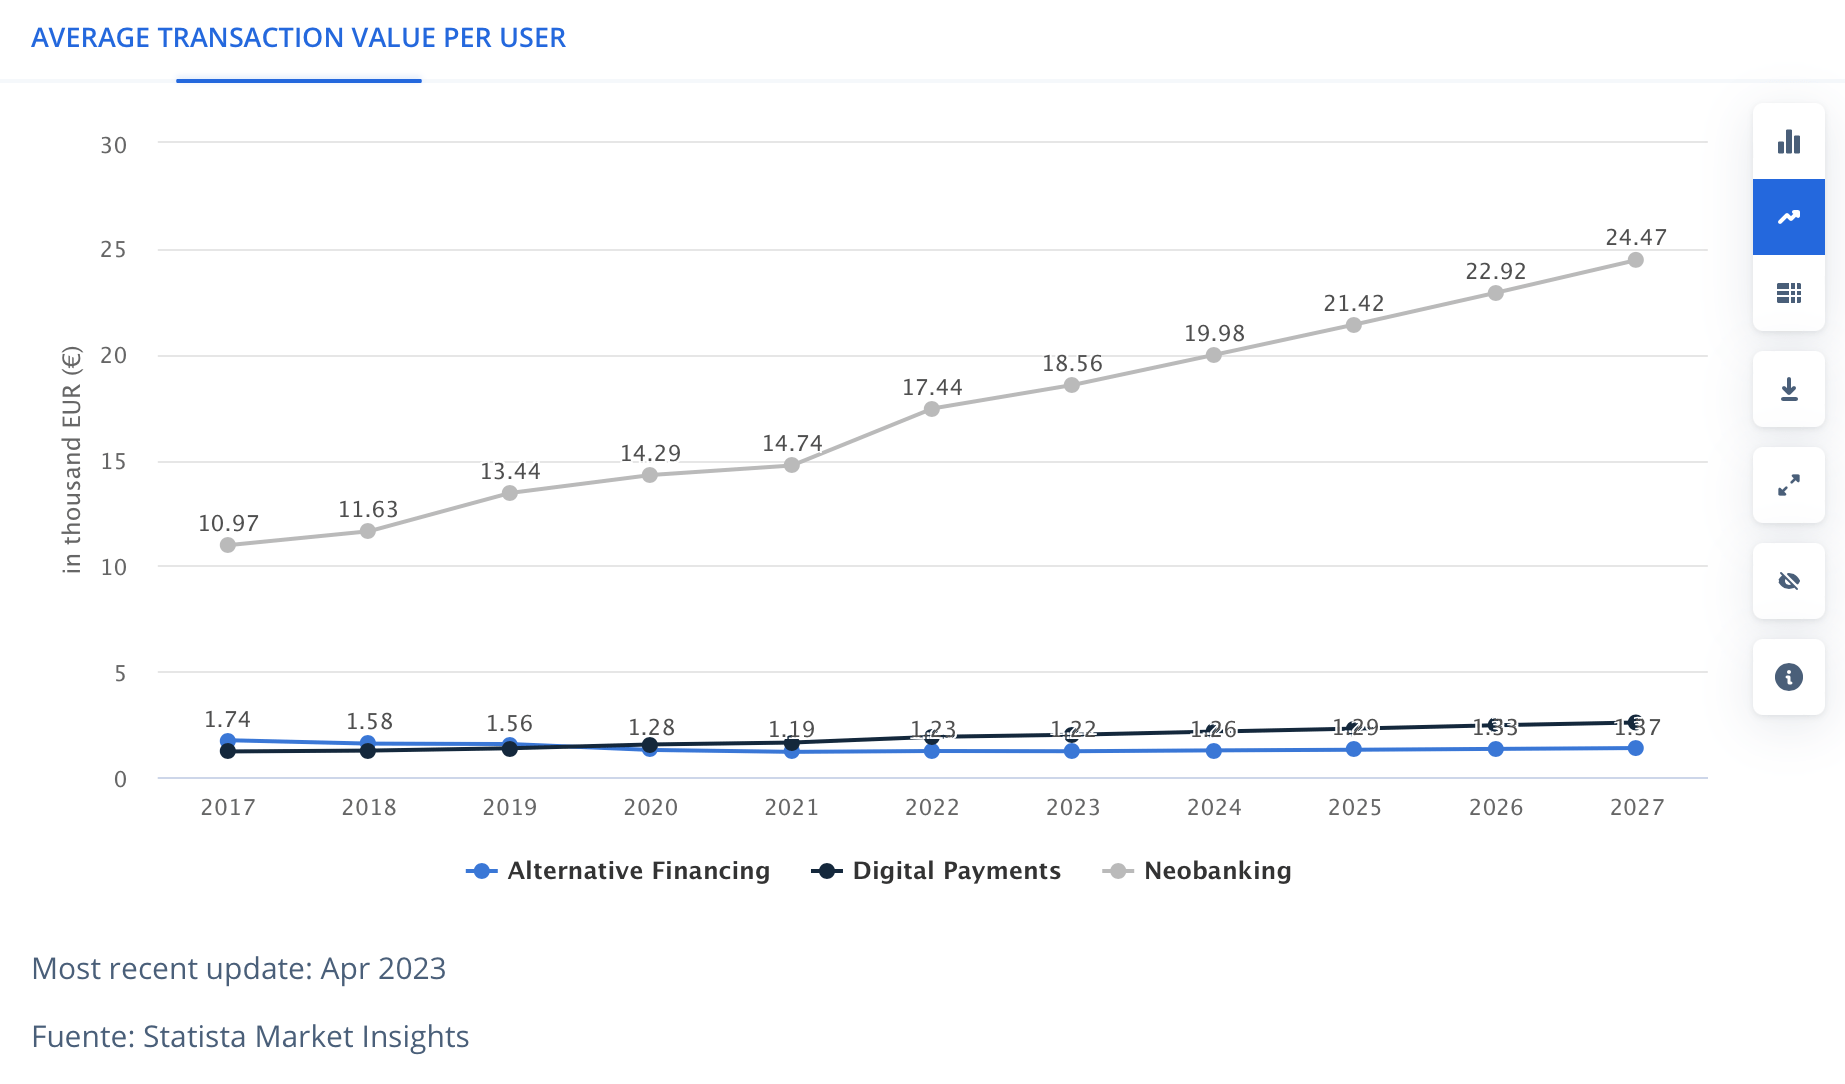
Revenue by User
As depicted in the table below, the transaction per user in the digital payments market is expected to grow at a CAGR of 7.25% from 2023 to 2027, with each user projected to transact approximately $2,580.
This data presents a contradiction, as it raises questions about how the transaction value can grow at a rate of 14.84%, while the average transaction per user increases at a rate of 7.25%, only slightly higher than the projected user growth of 5.85%.
For the period from 2019 to 2023, the average transaction value per user increased at a rate of 11.76%, which closely matched the user growth rate of 9.79% annually, leaving a gap of just 1.97%.
Statista
Financials
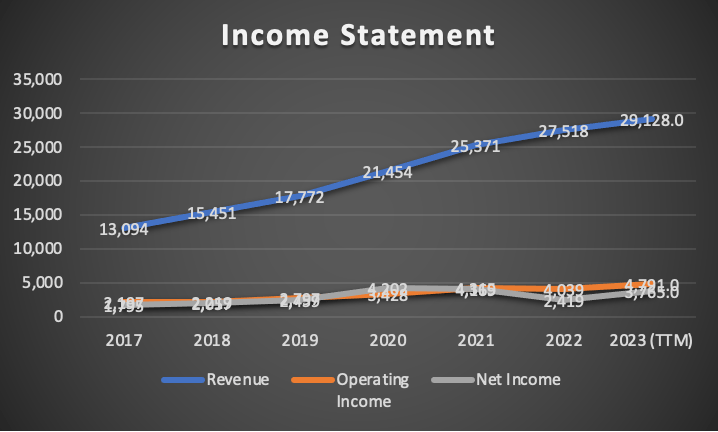
Since my last article on PayPal, which was released in Q2 2023, revenue has increased by a modest 2.1%, TTM growth of only 5.8%.
Meanwhile, operating income has seen a 1.48% growth compared to Q2’s TTM figure of $4.72 billion. This places PayPal’s TTM at approximately 18.85%, which significantly outpaces the growth rate displayed in revenue.
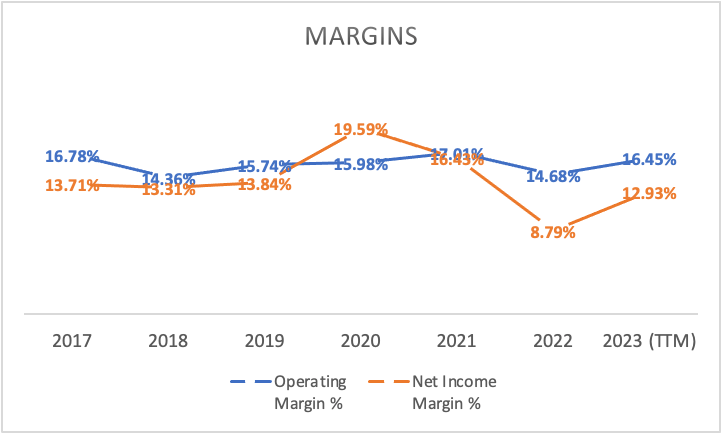
On the other hand, net income has declined from $4.07 billion in Q2 to $3.76 billion in Q3, marking a 9% decrease. While the operating margin has remained relatively stable, the net income margin has dropped from 14.27% to 12.93%, representing a 1.34% decrease.
Author’s Calculations
Author’s Calculations
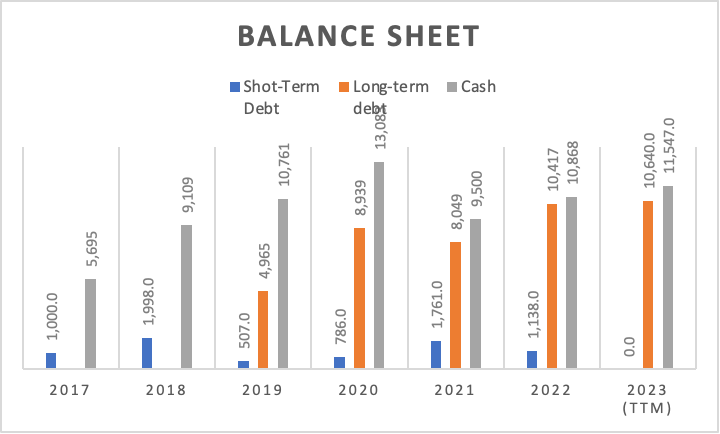
PayPal maintains a reasonable balance sheet. However, if we trace back to 2017, the balance sheet has deteriorated over time. In 2017, PayPal had less debt compared to its cash reserves. Now, as evident, debt and cash holdings are nearly at the same level.
Author’s Calculations
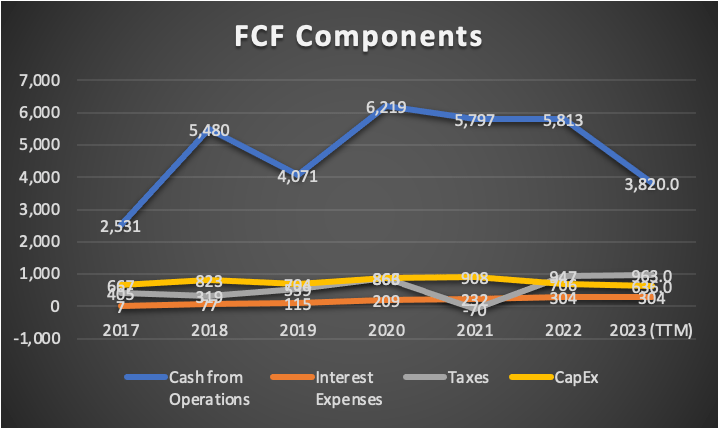
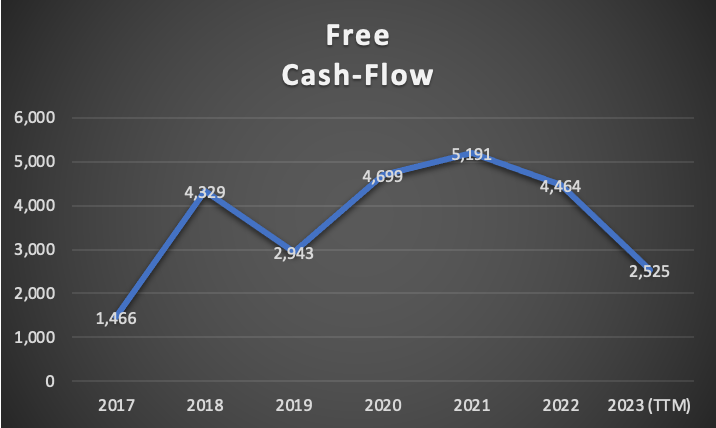
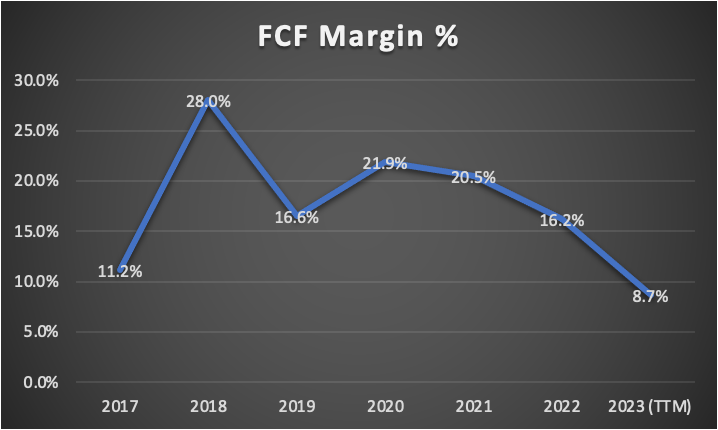
Furthermore, PayPal’s free cash flow has worsened, not only since 2020 but also between Q2 and Q3 when PayPal managed to reduce its free cash flow from approximately $3 billion to $2.5 billion. The margin has also decreased, falling from 10.6% to 8.7%.
Author’s Calculations
Author’s Calculations
Author’s Calculations
In summary, PayPal’s financial condition is showing signs of deterioration. While its balance sheet remains robust, there is a potential for an increase in debt, possibly surpassing its cash reserves. The most impacted metric is the free cash flow, which has consistently decreased, as I mentioned earlier.
Valuation
In this valuation, I will present three residual earnings models. The first model will consider analysts’ expectations for both revenue growth and EPS growth. The second model will exclusively focus on revenue growth, while maintaining net income at the average net income margin recorded from 2017 to 2023, effectively assuming net income grows in line with revenue. Finally, the third model will represent the most pessimistic scenario, aiming to explore the worst-case outlook for PayPal.
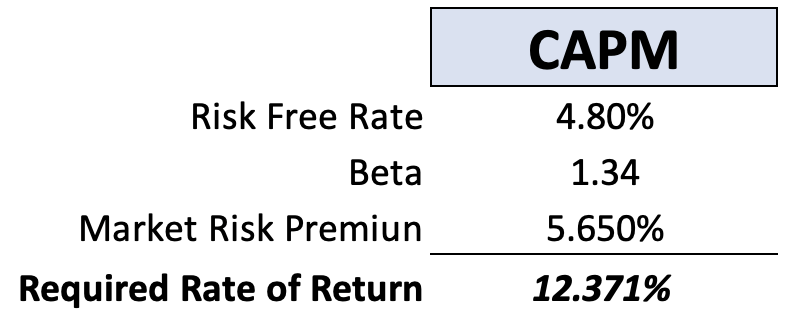
As illustrated in the table below, depreciation and amortization (D&A) and interest expenses will be calculated based on margins associated with revenue. The discount rate will be determined using the CAPM (Capital Asset Pricing Model).
Author’s Calculations
Author’s Calculations
| TABLE OF ASSUMPTIONS | |
| (Current data) | |
| Assumptions Part 1 | |
| Equity Value | 19,740.00 |
| Debt Value | 10,640.00 |
| Cost of Debt | 2.86% |
| Tax Rate | 25.58% |
| 10y Treasury | 4.80% |
| Beta | 1.34 |
| Market Return | 10.50% |
| Cost of Equity | 12.44% |
| Assumption Part 3 | |
| Net Income | 3,765.00 |
| Interest | 304.00 |
| Tax | 963.00 |
| D&A | 422.00 |
| Ebitda | 5,454.00 |
| D&A Margin | 1.45% |
| Interest Expense Margin | 1.04% |
| Revenue | 29,128.0 |
Analysts Estimates:
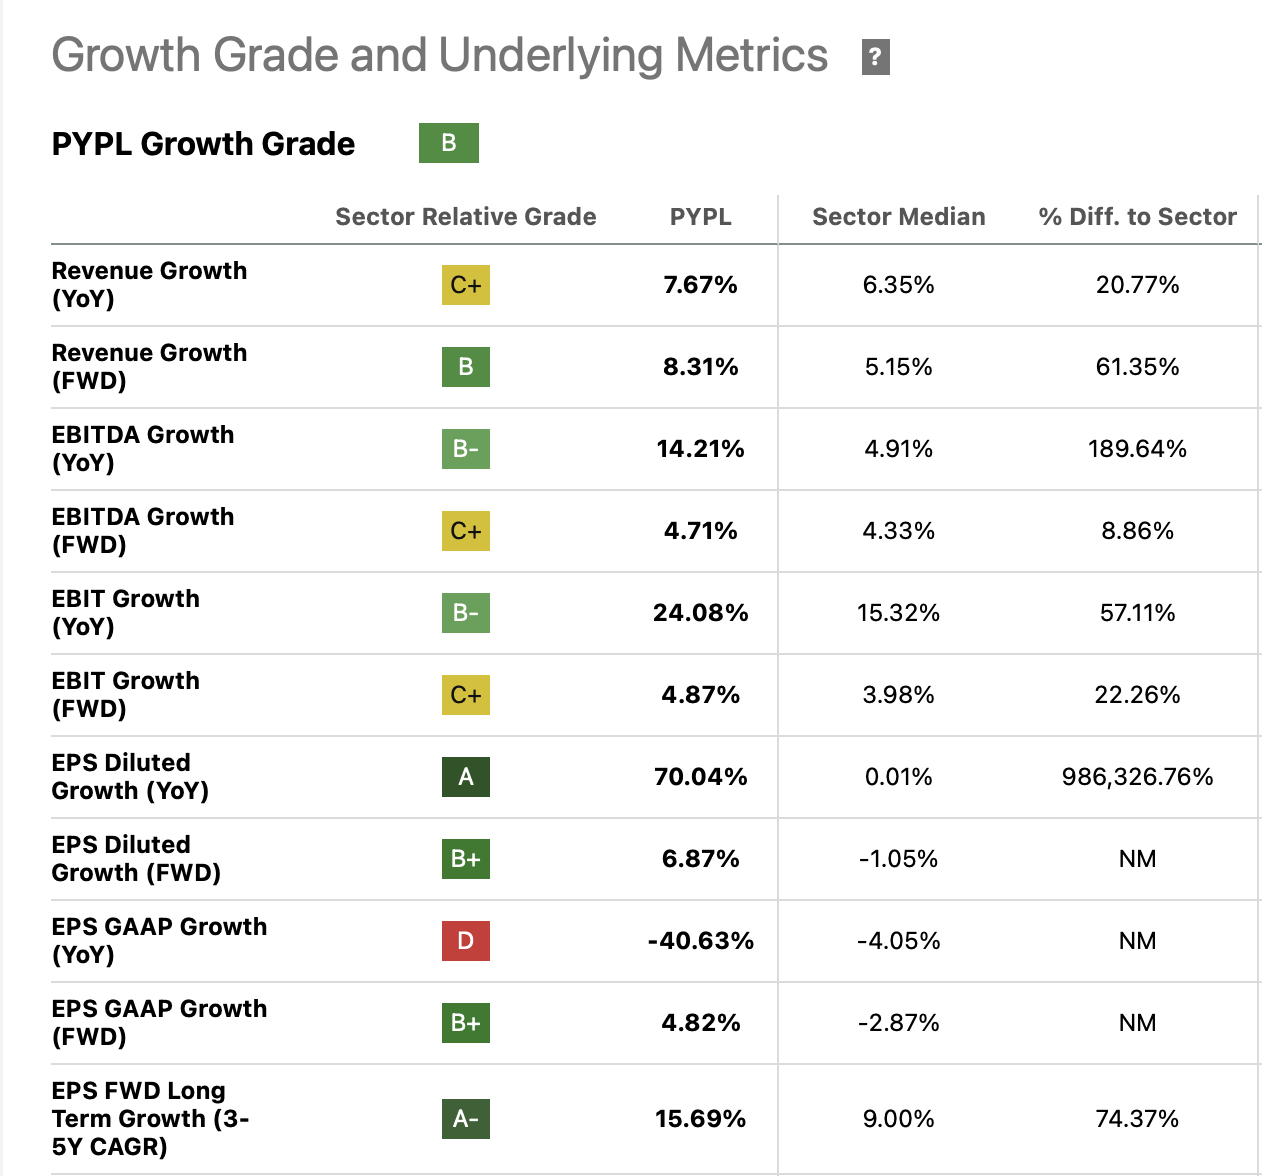
In this first scenario, which is also the most optimistic one, I aim to determine PayPal’s fair value based on analysts’ expectations. The first metric is revenue, which is expected to grow at a rate of 8.31%. The projected EPS growth rate, used to estimate net income, stands at 15.69% over the next five years.
Growth Estimates (Seeking Alpha)
For 2023, analysts anticipate revenue of $29.62 billion, and for 2024, it’s projected to reach $32.22 billion. As for EPS, analysts expect figures of $4.97 and $5.61, which could translate to net incomes of $5.36 and $6 billion, respectively.
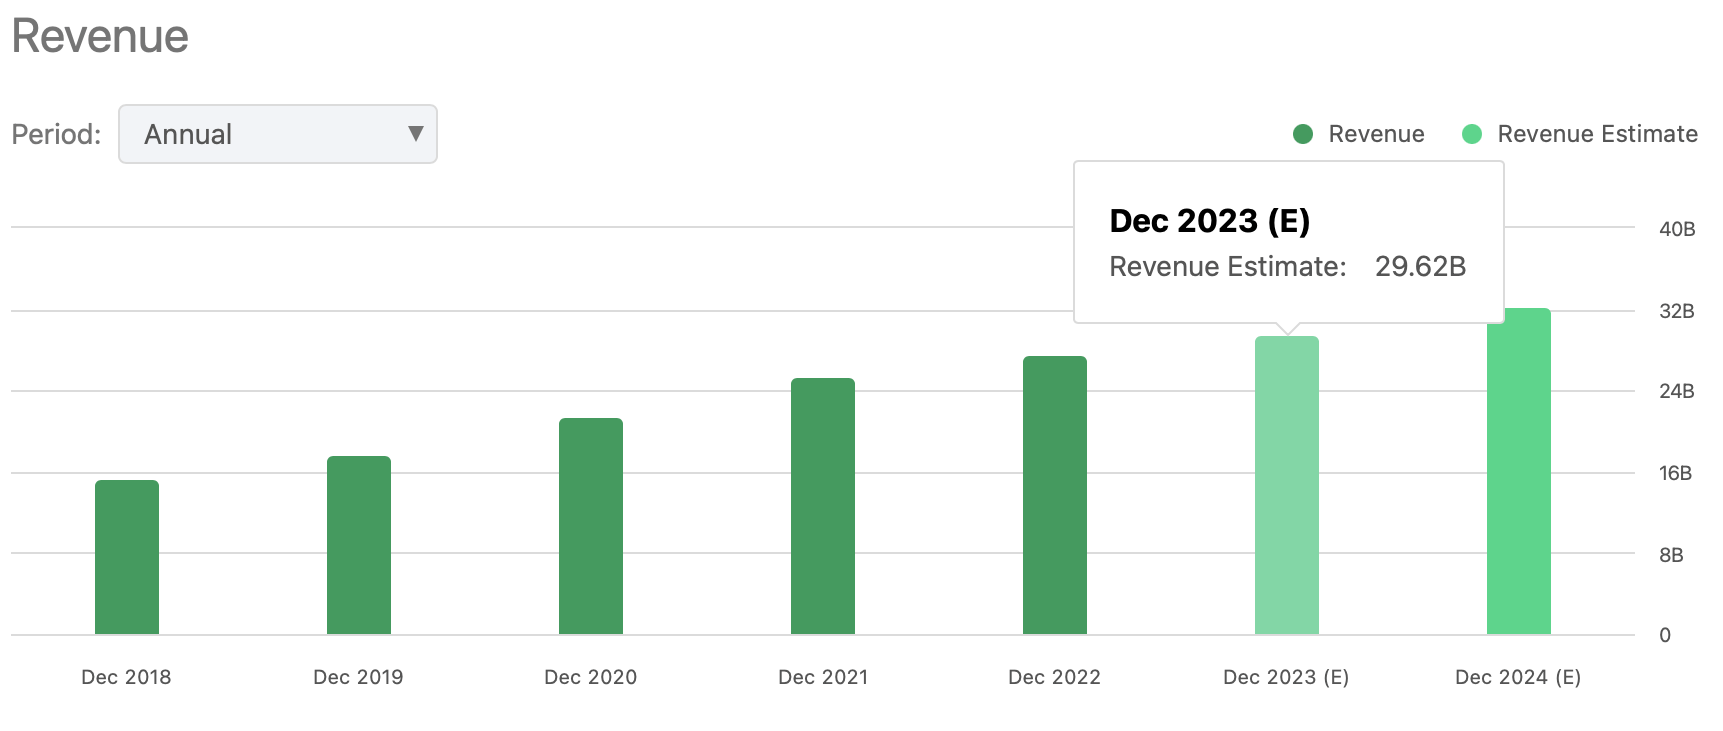
Revenue Estimates (Seeking Alpha)
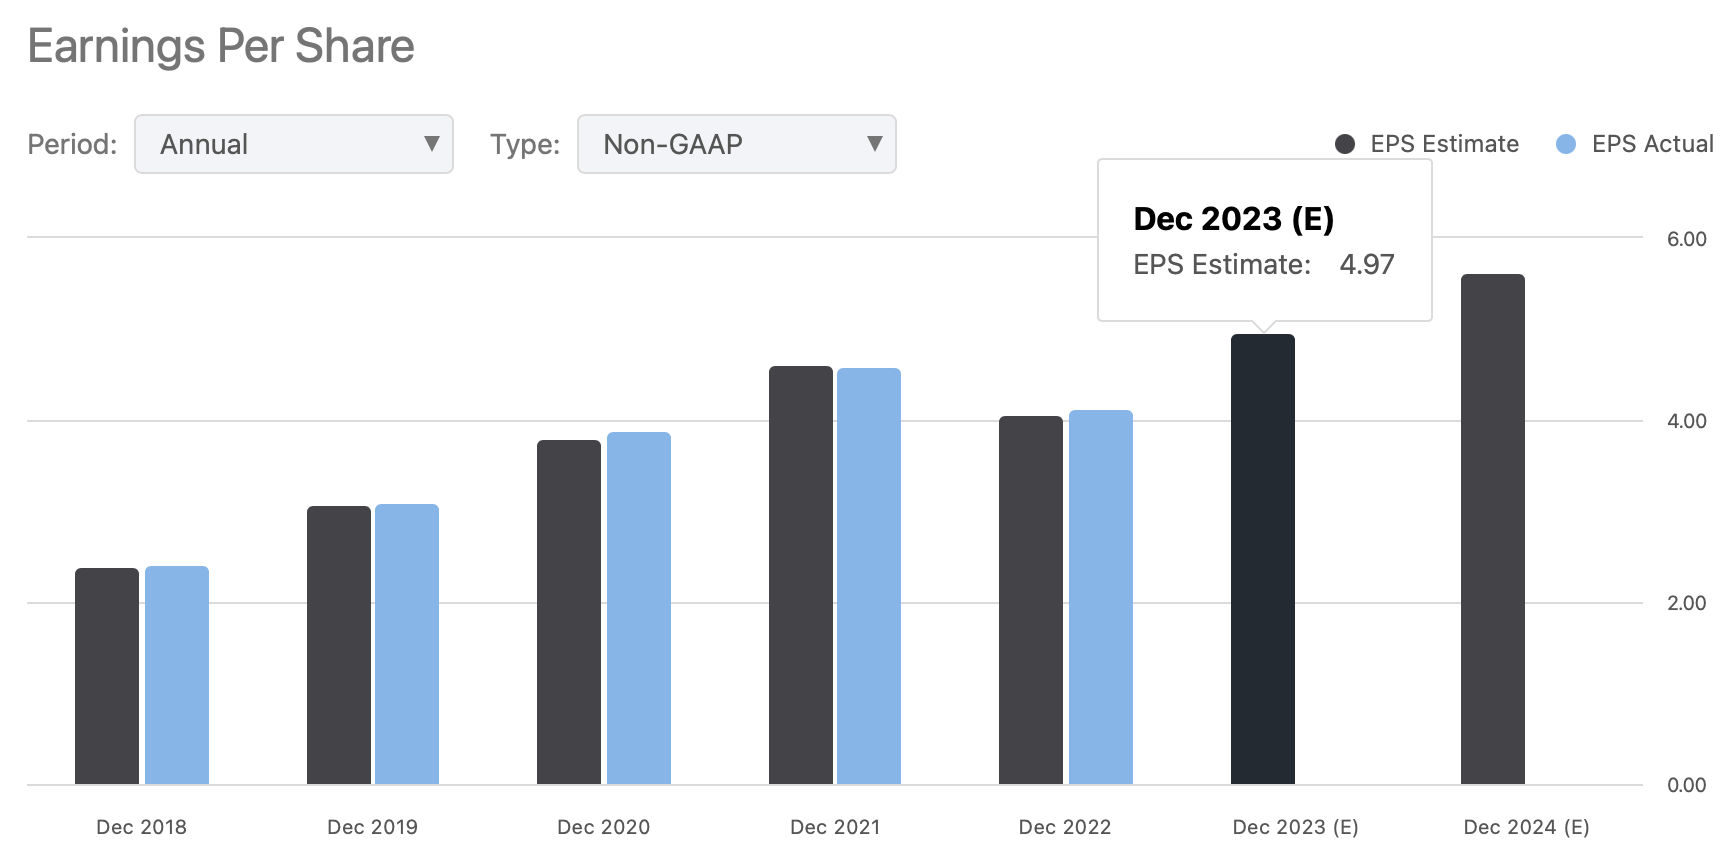
EPS Estimates (Seeking Alpha)
| Revenue | Net Income | Taxes | Operating Income | Plus D&A | Plus Interest | |
| 2023 | $29,670.0 | 5,367.00 | 1,372.75 | $6,739.8 | $7,169.61 | $7,479.26 |
| 2024 | $32,390.0 | 6,069.60 | 1,552.46 | $7,622.1 | $8,091.32 | $8,429.37 |
| 2025 | $35,101.0 | 7,058.94 | 1,805.51 | $8,864.5 | $9,373.00 | $9,739.33 |
| 2026 | $38,039.0 | 8,209.55 | 2,099.81 | $10,309.4 | $10,860.47 | $11,257.47 |
| 2027 | $41,222.9 | 9,547.71 | 2,442.08 | $11,989.8 | $12,587.02 | $13,017.25 |
| 2028 | $44,673.2 | 11,103.99 | 2,840.14 | $13,944.1 | $14,591.35 | $15,057.59 |
| ^Final EBITA^ |
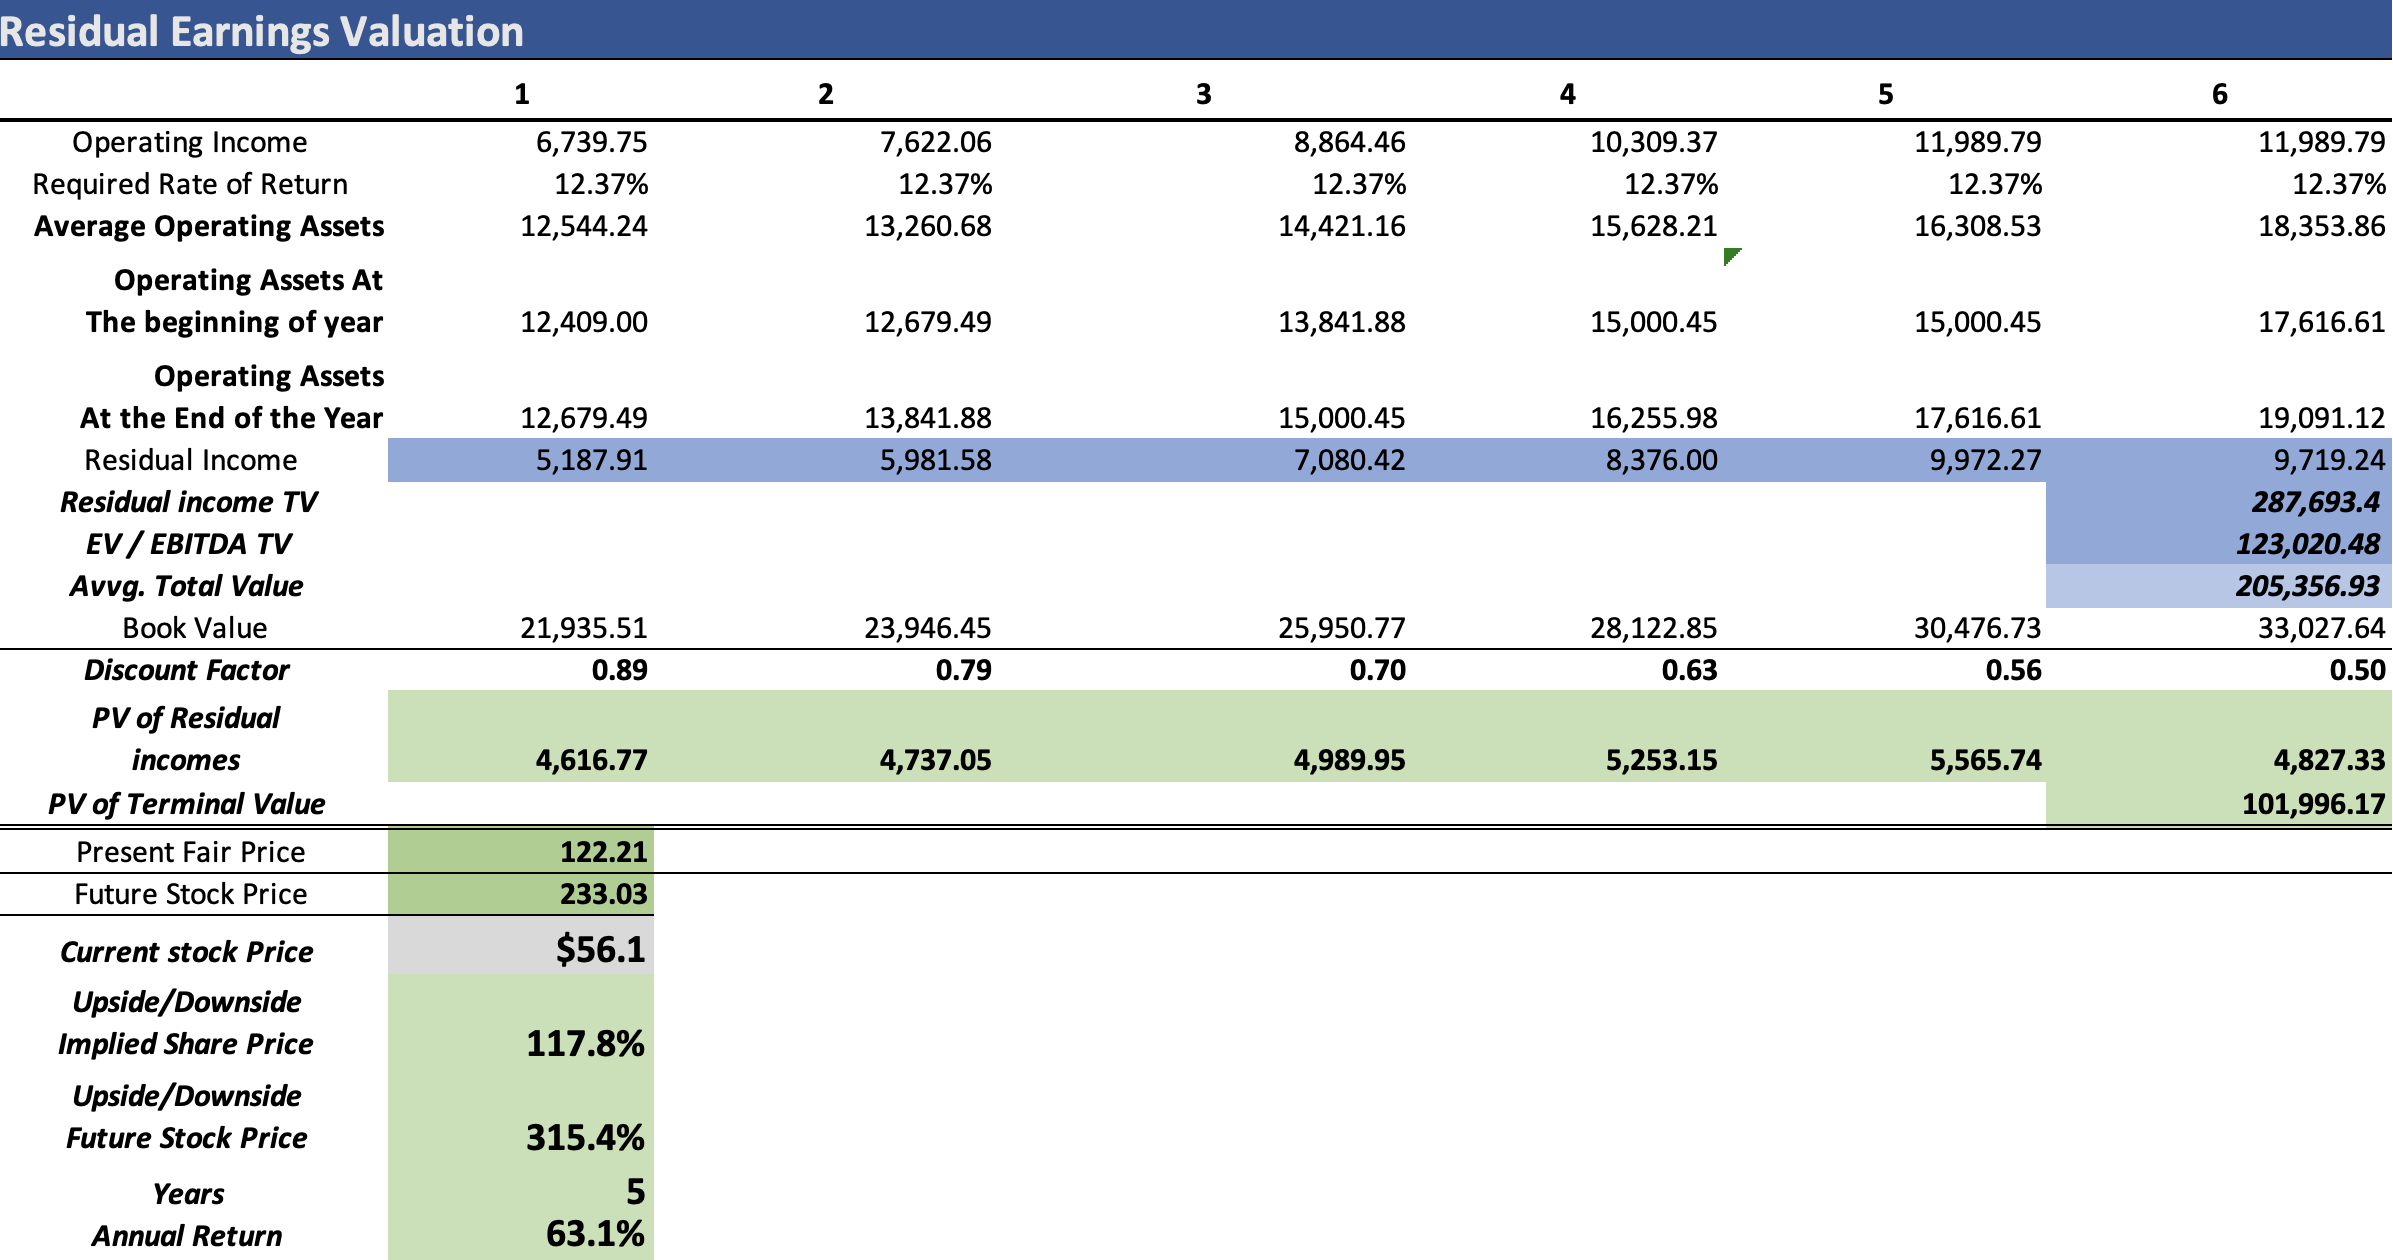
Author’s Calculations
As demonstrated, this model suggests that if PayPal achieves these growth figures, the present fair value would be $122.21, representing a significant 117.8% upside from the current stock price of $56.1. The future stock price of $231.03 implies annual returns of 63.1%, which is substantial.
Earnings growing at pace with Revenue
In this second model, I will continue to maintain the expected revenue growth rate of 8.31%. Operating income will maintain its 2017-2023 average margin of 15.86%, effectively implying that operating income will grow at the same pace as revenue, 8.31%.
| Revenue | Operating Income | Plus D&A | Plus Interest | |
| 2023 | $29,670.0 | $4,705.7 | $5,135.51 | $5,445.17 |
| 2024 | $32,390.0 | $5,137.1 | $5,606.31 | $5,944.36 |
| 2025 | $35,101.0 | $5,567.0 | $6,075.56 | $6,441.90 |
| 2026 | $38,039.0 | $6,033.0 | $6,584.09 | $6,981.09 |
| 2027 | $41,222.9 | $6,537.9 | $7,135.17 | $7,565.40 |
| 2028 | $44,673.2 | $7,085.2 | $7,732.39 | $8,198.63 |
| ^Final EBITA^ |
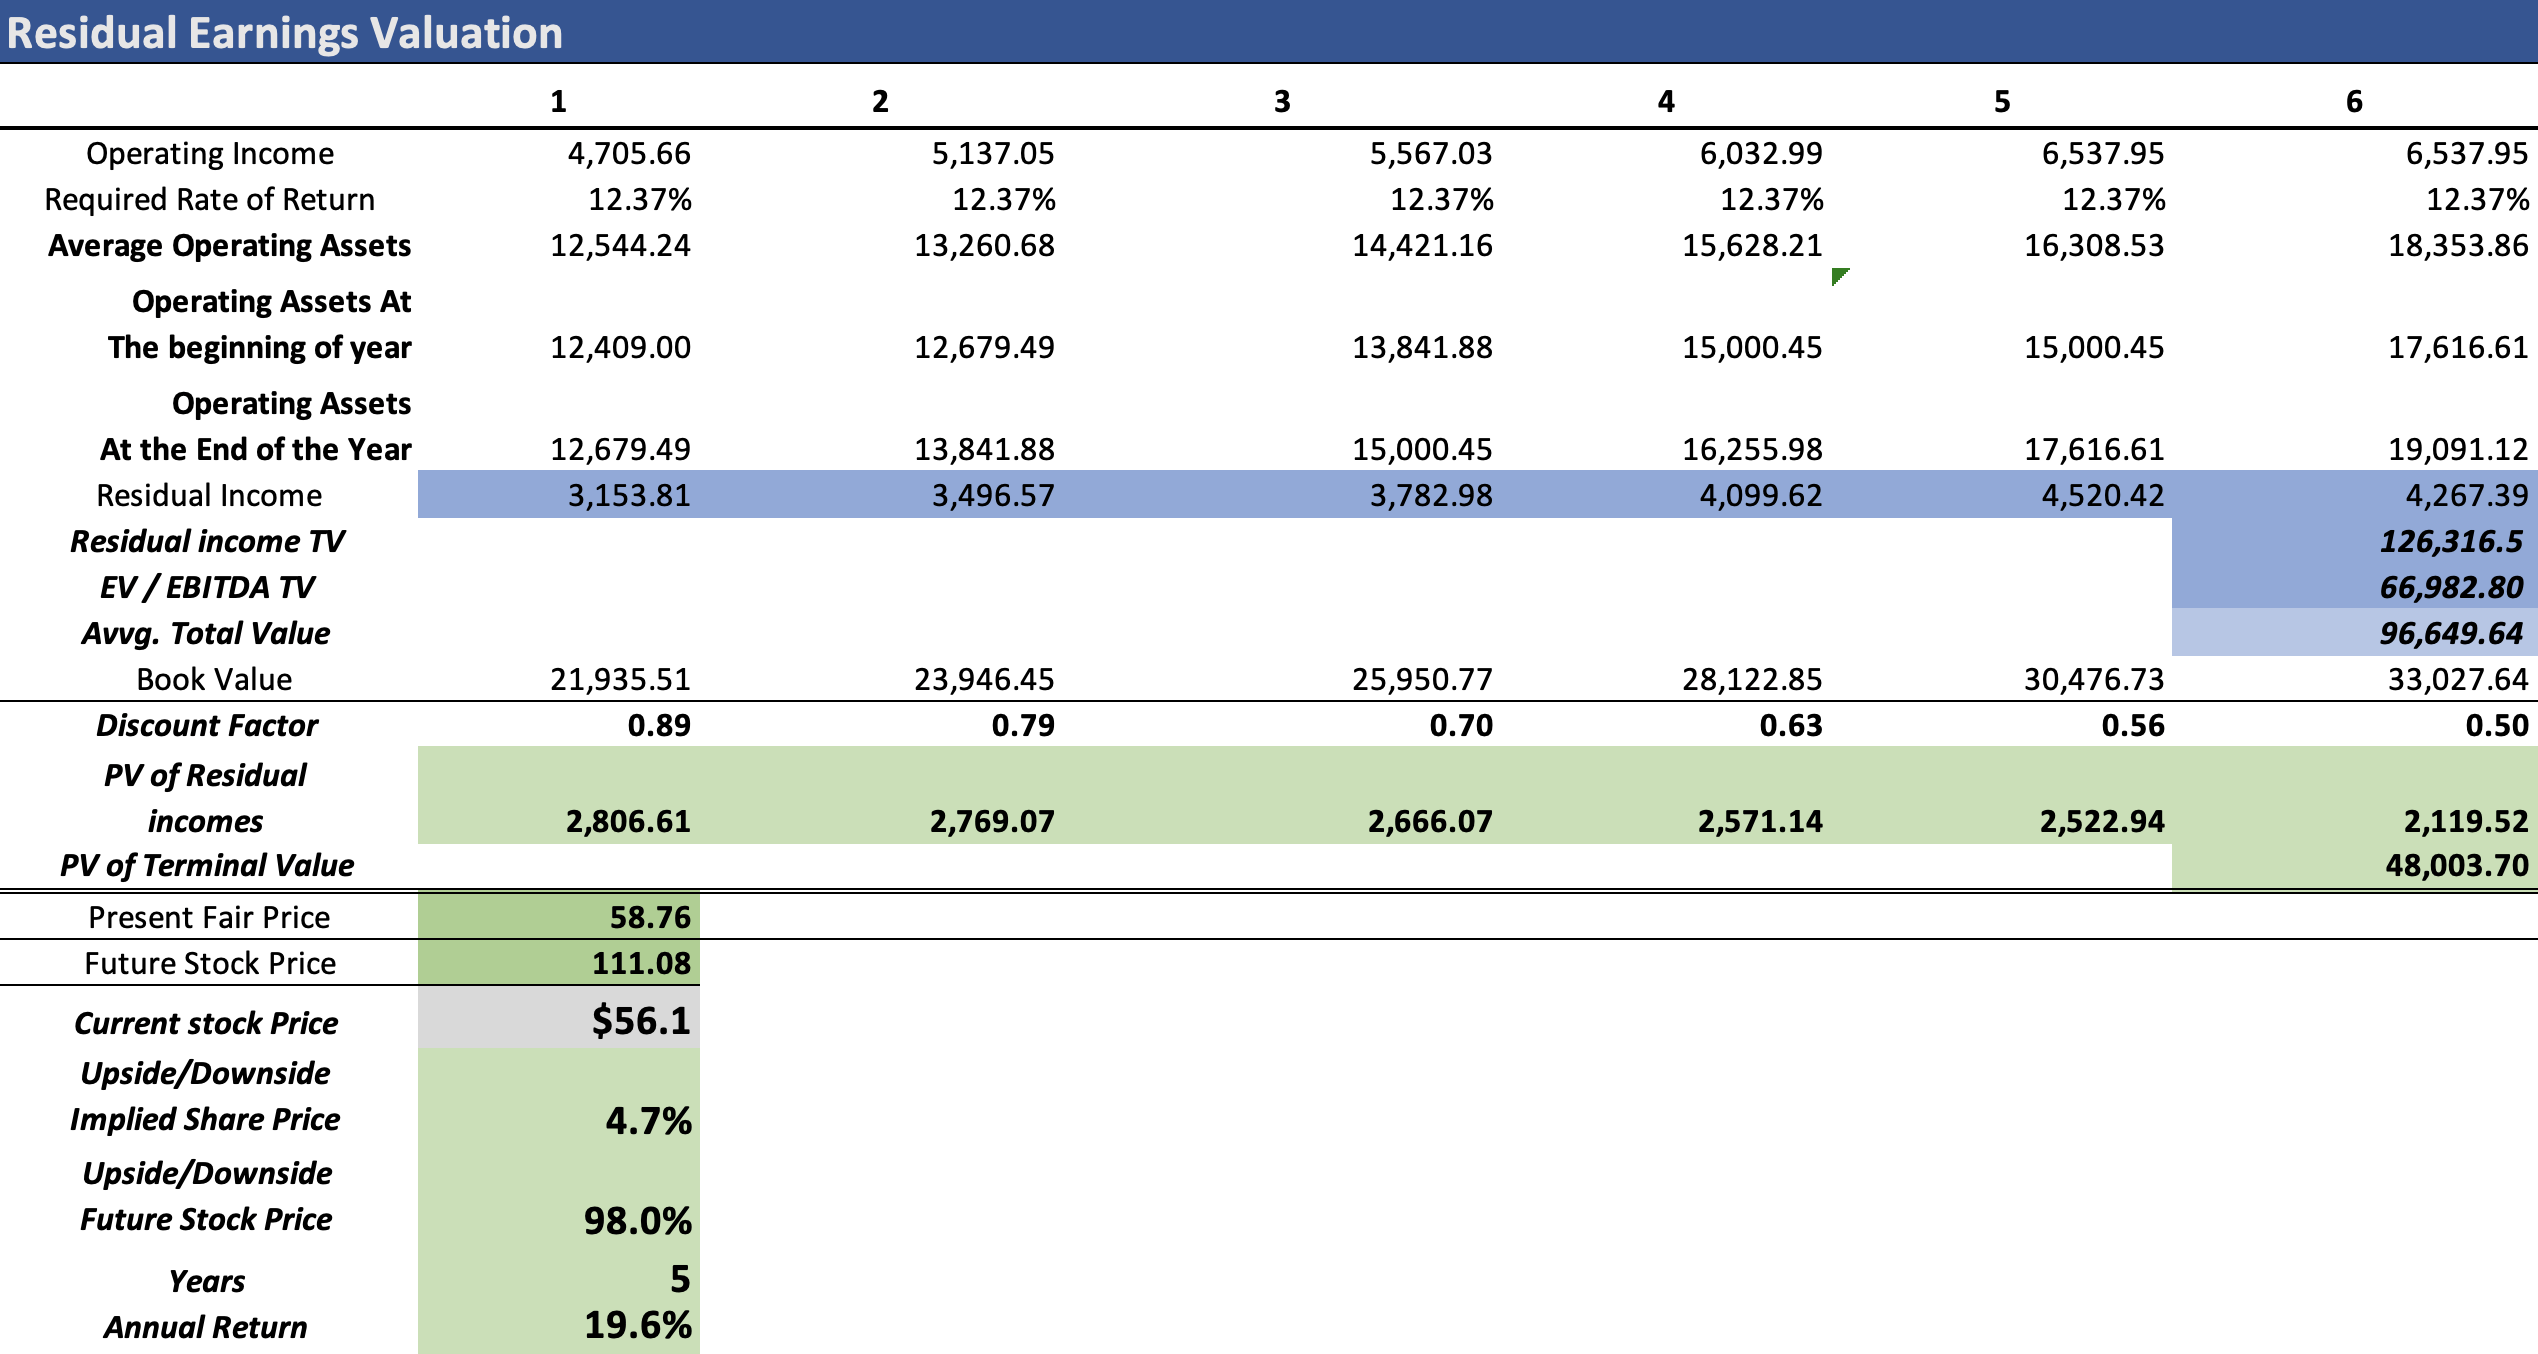
Author’s Calculations
This model suggests that if PayPal follows these growth figures, the present fair value would be $58.76, indicating a modest 4.7% upside from the current stock price of $56.1. The future stock price of $111.08 suggests annual returns of 19.6%, which, while not as substantial as the previous model, seems more realistically optimistic. The prior model would require PayPal to more than double its current net income of $3.7 billion, a significant challenge given the recent downturn from Q2’s TTM figure of $4.07 billion. Moreover, the EPS figures in the first model may be achievable through share repurchases, masking the actual figures that are on a downward trajectory.
Then why PayPal still falls despite it being hugely undervalued?
The major concern lies in the potential for rapid deterioration should such a scenario unfold. Expected user growth has already seen a significant decline, and this has a direct correlation with the revenue these companies can generate.
One striking observation from the data is the projected user growth of 5.85% in the 2023-2027 period, while revenue growth for 2023-2028 is estimated at 8.57%. This clear discrepancy implies that PayPal users would need to increase their spending significantly to help PayPal reach its revenue goals. The challenge arises from the fact that people primarily use PayPal for money transfers, and during tough economic times, this revenue source could diminish rapidly.
In addition, PayPal’s decision to enter the world of cryptocurrencies is a notable development. However, in adverse economic conditions, the revenue that PayPal derives from this venture could quickly decline. Furthermore, PayPal’s decision to repurchase shares might be perceived as a sign of desperation, and it has the potential to erode the company’s cash reserves. As evident in the overview section, PayPal has already confirmed plans to repurchase shares worth $5 billion in 2024. Meanwhile, as indicated in the financials section, the company’s current free cash flow stands at $2.5 billion, and even considering the 2020 figure of $5.19 billion, a share repurchase of such magnitude would equate to spending approximately 1 to 2 years’ worth of free cash flow on buying back shares.
Additionally, it’s worth noting that my models are all based on 6-year projections, while the majority of analysts tend to set targets for a 3-year timeframe. This difference significantly impacts the present fair value of stocks.
7.49% growth rate scenario
In this final model, I project PayPal’s value with a more modest 7.49% revenue growth rate. This rate is derived from the transaction volume growth projection of 5.85%, augmented by the 1.97% gap between total transaction volume and transaction volume per user for the 2019-2023 period.
For the period 2019-2023, the average transaction value per user grew at a rate of 11.76%, which was more at pair with the user growth rate registered in that period of 9.79% annually, a 1.97% gap.
| Revenue | Operating Income | Plus D&A | Plus Interest | |
| 2023 | $29,670.0 | $4,705.7 | $5,135.51 | $5,445.17 |
| 2024 | $31,892.3 | $5,058.1 | $5,520.16 | $5,853.01 |
| 2025 | $34,281.0 | $5,437.0 | $5,933.62 | $6,291.41 |
| 2026 | $36,848.7 | $5,844.2 | $6,378.05 | $6,762.63 |
| 2027 | $39,608.6 | $6,281.9 | $6,855.77 | $7,269.15 |
| 2028 | $42,575.3 | $6,752.4 | $7,369.27 | $7,813.61 |
| ^Final EBITA^ |
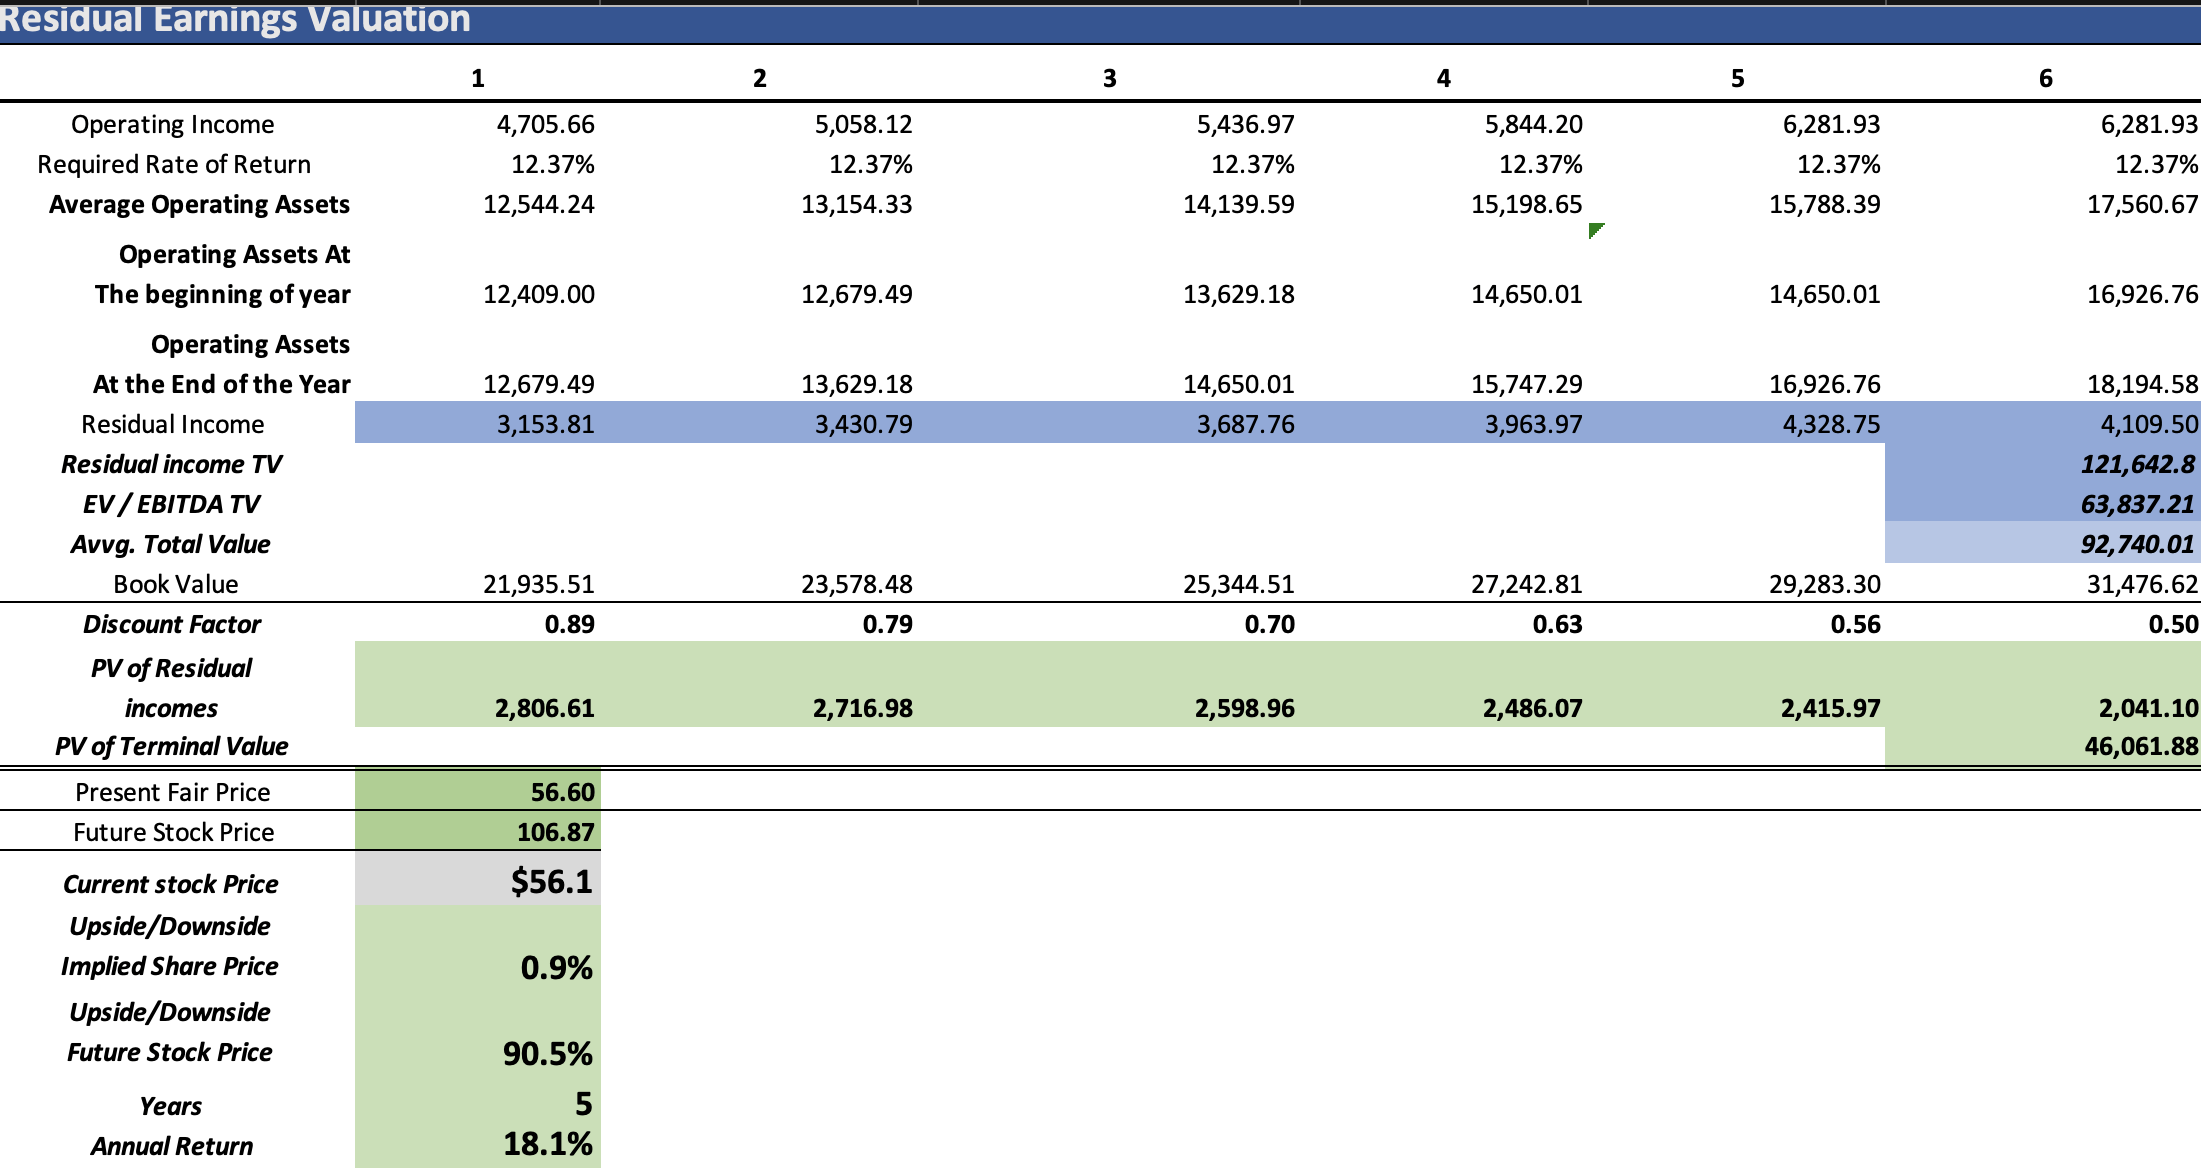
Author’s Calculations
As indicated by this model, if PayPal attains these growth figures, the present fair value would be $56.60, representing a minor 0.9% upside from the current stock price of $56.1. The future stock price of $106.87 suggests annual returns of 18.1%, just slightly less than what the previous model indicated. This scenario takes into account a more conservative growth rate and is grounded in a more cautious assessment of PayPal’s potential.
So what?
PayPal currently appears to be fairly valued, and in the near future, it may trade in a relatively flat pattern. As mentioned earlier, the growth in net income is insufficient to achieve the extremely optimistic valuation suggested in the first model. Additionally, with revenue only growing at 5.8%, questions arise about the feasibility of reaching the 8.31% revenue growth rate required in the second model.
Moreover, the financial decisions made by PayPal could potentially dampen the return rates projected by the last two models. Given these considerations, I am setting a target of $56.60 for PayPal and assigning it a “hold” rating.
It’s important to note that the first scenario’s potential is somewhat complicated by the Federal Reserve’s efforts to reduce purchasing power and the persistence of inflation, which continues to impact people’s finances. Therefore, in the near term, a downside seems more likely than a significant upside.
Risks to Thesis
The primary risk to this bearish thesis is the potential for PayPal to effectively encourage its users to significantly increase the volume of their transactions, ultimately achieving a sustained 14% total transaction volume growth by 2027.
Another potential upside is that PayPal could successfully reduce its expenses on the required scale to boost its EPS without resorting to share buybacks. This approach could have the most favorable impact on PayPal’s shares. Nevertheless, it’s essential to note that the already planned share repurchase program of $5 billion is set to reduce cash flow for 2024, which could pose a challenge.
However, it’s worth mentioning that the feasibility of the first scenario is somewhat complicated by the Federal Reserve’s efforts to reduce purchasing power and the persistent nature of inflation, which continues to impact people’s financial situations. Consequently, in the near term, a downside seems more likely than a significant upside.
Conclusion
In conclusion, the assessment of PayPal’s current financial position and future prospects reveals a nuanced picture. While optimistic growth scenarios have been considered, they appear to be tempered by several key factors. The declining trajectory of net income, coupled with challenges in achieving the necessary revenue growth, raises concerns about PayPal’s ability to meet the aggressive valuation targets presented in the models. Moreover, the company’s financial decisions, including a substantial share repurchase program, have the potential to hinder the envisioned returns. These considerations lead to a conservative target of $56.60 and a “hold” rating for PayPal, reflecting a cautious stance towards the company’s near-term performance. Given the uncertain economic landscape, characterized by the Federal Reserve’s efforts to reduce purchasing power and persistent inflation, a more restrained outlook for the stock’s immediate future is warranted.
Analyst’s Disclosure: I/we have no stock, option or similar derivative position in any of the companies mentioned, but may initiate a beneficial Long position through a purchase of the stock, or the purchase of call options or similar derivatives in PYPL over the next 72 hours. I wrote this article myself, and it expresses my own opinions. I am not receiving compensation for it (other than from Seeking Alpha). I have no business relationship with any company whose stock is mentioned in this article.
Seeking Alpha’s Disclosure: Past performance is no guarantee of future results. No recommendation or advice is being given as to whether any investment is suitable for a particular investor. Any views or opinions expressed above may not reflect those of Seeking Alpha as a whole. Seeking Alpha is not a licensed securities dealer, broker or US investment adviser or investment bank. Our analysts are third party authors that include both professional investors and individual investors who may not be licensed or certified by any institute or regulatory body.