Summary:
- North America contributes the most to PepsiCo, Inc. revenues and operating margin.
- The company generates only 5% from high-margin concentrate sales, compared to 56% of The Coca-Cola Company.
- FritoLay is the single most important contributor to operating margin of the company.
Fotoatelie
PepsiCo, Inc. (NASDAQ:PEP) is one of the leading international soft beverages and snacks powerhouses. It holds a portfolio of globally strong brands, all housed under three major brand-holding subsidiaries: PepsiCo, FritoLay, and Quaker Foods.
Much has already been written about and researched into what the company is and how it operates. As a result, I decided to digress from my usual discussion of the growth factors and focus more on some upsides and downsides that I see, with the ultimate aim of providing an alternative view on what may lie ahead for the company in terms of its financials and valuation.
Performance Dynamics
Revenue Growth Dynamics
Let us start by looking at TTM consolidated net revenue growth over the last five years (Figure 1).
Figure 2
Company 10-Qs/10-Ks and author’s calculations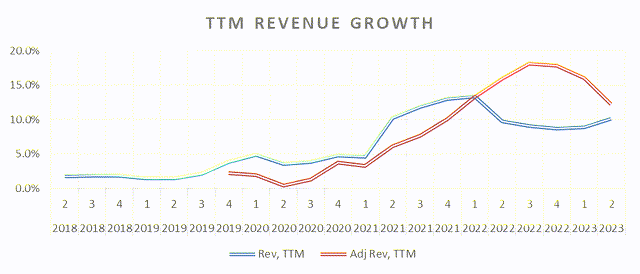
Over the 5-year period shown, the company has delivered a 6.9% CAGR GAAP revenue growth, rising to low double-digit growth in 2021, due to Pioneer Foods and Be & Cheery acquisition (see below for further discussion). The graph also shows adjusted TTM revenue (or what the company calls “organic” revenue but does not provide directly in absolute terms and which, therefore, had been reconstructed using quarterly growth rates), with growth dynamics that are quite similar to GAAP revenue above, except a little hump in 2022, and a 4Y CAGR of 8.5%.
Let us face it, PEP is virtually a mature company with a high level of revenues and global operations that has limited room for sustained double-digit growth in revenues of the kind that it posted over the last several quarters (especially, when considering the unsustainable pricing effect that played a major role in that), both from the existing markets and any new sales it could gain through the M&A activity.
To better see what lies ahead for the company, let us look at what comprises revenues and the drivers behind its recent growth.
PEP segments its revenues into 7 divisions: three for North America (FritoLay, Quaker Foods, and PepsiCo), followed by regional hubs of Latin America (LatAm); Europe; Africa, Middle East, and South Asia (AMESA); and, finally, Asia Pacific, Australia and New Zealand and China Region (APAC).
Let us look at Figure 2 and Table 1 below containing some important statistics around these divisions over the last 3 TTM years, ending Q2 2023.
Figure 2
Company 10-Qs/10-Ks and author’s calculations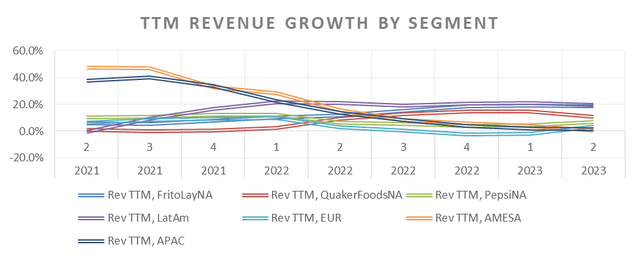
Table 1
Company 10-Qs/10-Ks and author’s calculations
There are several interesting trends that we can see here:
- Over the last 7 reporting quarters, LatAm has been the fastest-growing division on a GAAP basis, posting a 20% CAGR sales growth rate.
Most of that growth, however, can be attributed to price, rather than volume, impact. While it does show some pricing power on the part of the company, price-driven growth, apart from being unsustainable, inevitably dampens volume growth.
- Over the three-year period (ending Q1′ 2023), AMESA and APAC have had the highest cumulative growth rates of 71.5% and 58.5% (or 19.7% and 16.6% CAGR), respectively, largely driven by the acquisition of Pioneer Foods (South Africa) and Be & Cheery (China) in 2020. As the effect of the acquisition subsided, however, both AMESA and APAC divisions’ growth rates declined precipitously to low single-digit rates.
- Over the same period, the North American region has had the largest share of total net revenues, with steady growth rates (though, roughly, around mid-single-digit range on YoY basis) and the highest contribution to total net cumulative revenue growth (59% contribution, or 19.7 percentage points of 33.23% total). Once again, net pricing has been the most important factor explaining this growth.
- That brings us to Europe in what appears to be a gloomy story for the company. First, it has had the slowest cumulative sales growth rate among the 7 divisions of only 13% (4.2% CAGR). Second, and perhaps most importantly, are the heavy headwinds ahead for the division, given the Russia-Ukraine crisis and the important role the Russian market plays not only in the European division (32% of sales in FY’2022), but for the PEP overall – it is the third-largest country by sales (after the U.S. and Mexico), with 4.8% share. So far, PEP has incurred charges in FY’2022 worth $1.4bln on a pre-tax basis (FY’2022 10-K, p.69), largely driven by the impairment of intangible assets ($1.2bln). However, despite PEP suspending sales of beverages, capital investments and other activities to Russia, the country still accounts for a significant portion of the company’s global sales (as indicated earlier, it is almost 5% and placed third after the U.S. and Mexico). Considering that Russia brought in $4.1bln in GAAP sales in FY’2022 (largely due to dairy, baby food, and snacks products continuing to be offered), has $2.5bln in carrying value of long-lived assets (as of FY’2022-end with two major properties being convenient food and dairy plants, among others), further significant impairment charges cannot be completely ruled out.
Margin Dynamics
Let us first start with the gross margin (GM) looking at the Figure 3 below. Over the last 5 years, PEP’s GM has been rather stable, hovering around the 52%-55% mark, while its closest competitor The Coca-Cola Company (KO), but also Monster Beverage Corporation (MNST), has had a GM of approximately 60% (as a side note, that decline for the MNST in recent periods is the result of an abrupt rise in the aluminum prices and the company stocking up on alum cans used in its co-packaging operations – arguably, a short-term phenomenon). The major reason behind this is the fact that PEP has only 5% of its consolidated net revenues (FY’2022 10-K, p.69) coming from the high-margin concentrate sales. Compare that to KO, which has 56% (FY’2022 10-K, p.34) of net sales being attributed to concentrate sales, and MNST, which has all of its non-alcohol (98% of sales) and certain alcohol finished goods being manufactured by third-party bottlers and co-packers (FY’2022 10-K, p.9), and it will become clear why PEP has higher revenues, but lower GM, relative to KO.
At the other end of the spectrum, we have pure-play bottling and convenient food companies with a GM range of, roughly, 32%-42% and 25%-40%, respectively.
As a result, the only reason PEP has a GM higher than 42% is likely due to its high-margin snack food business of FritoLay (see Tables 2 and 3 below for details), substantiated by the fact that, overall, convenience foods have a 60% share of consolidated net revenues (FY’2022 10-K, p.69). But it also means that, because of company-owned bottlers driving 35% of consolidated net revenues, group-level GM is being dragged down and is unlikely to rise substantially above the 55% level.
Figure 3
Let us now switch to the operating margin (OPM) and look at its TTM performance over the last 5 years in Figure 4 below, which shows GAAP OPM (blue line); organic OPM, based on GAAP revenue (red line); and organic OPM, based on organic revenue (green line).
Figure 4
Company 10-Qs/10-Ks and author’s calculations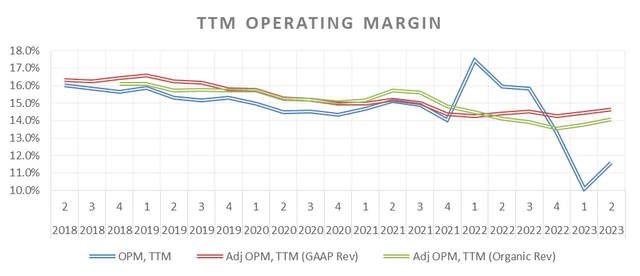
The first thing to note is that OPM, regardless of its calculation, has gradually trended downwards through FY’2021 and – excluding the GAAP-impacting one-off effects of the Juice Transaction (divestment of Tropicana, Naked, and other juice brands to PAI Partners) and the impairment charges related to SodaStream and Russia-Ukraine conflict in 2022 – currently hovers around the 14% mark. We can also look at the last three TTM years by division to see some more details behind these trends (refer to Tables 2 and 3 below and note that the figures are based, respectively, on blue and red lines, given that only 2 years of data is currently available for the green line):
Table 2
Company 10-Qs/10-Ks and author’s calculations
Table 3
Company 10-Qs/10-Ks and author’s calculations
First and foremost, North American region can be seen to explain, at least, 75% of total OPM composition both in Table 2 and Table 3; or, in other words, it is, by far, the largest contributor to group-level OPM. In fact, it is the high-margin North America convenience food business (FritoLay, in particular) that contributes the most – which makes it even more interesting seeing the gradual decline in its OPM that started in 2021, perhaps reflecting cost increases that were not fully offset by higher pricing. Meanwhile, the drastic drop in the total OPM (Table 2) that we can see (from 14.5% to 11.6%) can mostly be explained by the European region, stemming from the impairment charges related to SodaStream and Russia-Ukraine conflict; however, even when corrected for these charges, of 64 basis-point change in the total OPM (from 15.3% to 14.6%, Table 3), Europe, with 33bps, still contributed substantially to the overall drag, thereby yet again signifying a potential cloud on the horizon.
Let us finally zoom out and see how PEP stacks up against some of its competitors (Figures 5 and 6 below).
Figure 5
Figure 6
PEP, in addition to already having GM lower than that of KO, appears to have significant SG&A expense drag (Figure 1) – in fact, it has been continuously the highest across the indicated competitors and at a stable level of around 38%-39% of net consolidated revenues. That puts PEP on an OPM level more similar to pure-play bottlers and food companies than beverage companies like KO and MNST.
Valuation
To start with, the value drivers that we shall discuss below will center around my views on the company, based on the overall conclusions that can be reached on the topics discussed above – PEP is one of the world’s leading convenience food and soft beverages manufacturers, holding a portfolio of globally recognized brands, with a lucrative snacks business (which, in fact, makes it more a food, rather than a soft beverage, company), but faced with a limited long-term revenue growth and margin expansion potential, due to an already strong global footprint, some headwinds in the European region, and a beverage business model, focused more on building the top-line (via owning most bottling operations).
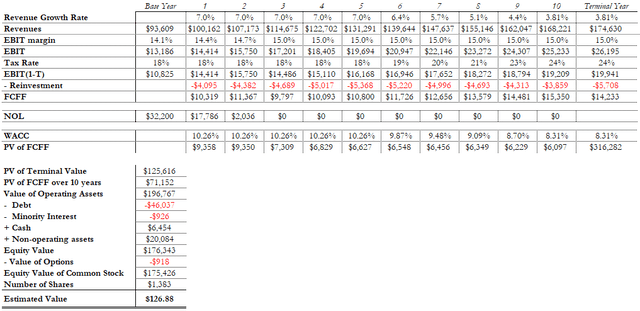
- Growth – as mentioned earlier, PEP has grown its GAAP revenues at a TTM 5-year CAGR of 6.9% (or 8.5% on an organic basis). Even though much of that growth occurred over the last 3 TTM years (impacted substantially by the pricing effects), I will assume that the company will be able to maintain a 7% growth over the following 5 years, before gradually subsiding to a terminal rate of 3.8% (a 10-Year U.S. Treasury Note).
- Profitability – despite the recent trend of the operating margin declining to 14% (both on GAAP and organic basis), I will assume PEP will be able to revert to a long-term OPM level of 15%.
- Reinvestment – this is a composite term that includes three important items: capital expenditures (including acquisitions and divestments), depreciation and amortization expenses, and working capital investments. For the purposes of valuation, the sales to reinvestment ratio will be used to project the future reinvestment activity of the company. By way of construction, a ratio of, say, 1.5 indicates that a company generates $1.5 in additional sales per each $1 reinvested. Consequently, the higher the ratio, the more efficient the company is at generating revenues, given its investing activities. For PEP, over the last three years (in TTM periods), the ratio hovered around 1.6, which is what will be used in the valuation model.
To calculate the reinvestment rate in the terminal period, we shall use the re-arranged sustainable growth formula at the stakeholder level:
Reinvestment rate = Sustainable growth / ROIC,
whereby the sustainable growth will equal the 10-year Treasury Note rate of 3.8% and an ROIC of 8.3% (equal to terminal period WACC):
Reinvestment rate = 3.8% / 8.3% = 45.8% (to be multiplied by the after-tax adjusted EBIT to arrive at an absolute value).
- Risk – using market values of equity and debt (including leases), we have the following:
|
Equity |
After-Tax Debt |
Capital |
|
|
Weight in Cost of Capital |
88.0% |
12.0% |
100% |
|
Component cost |
11.1% |
3.8% |
10.3% |
The equity component was calculated using the risk-free rate of 3.8%, ERP (geographically weighted by sales) of 8.72% and a levered bottom-up beta of 0.84. The pre-tax debt component was computed as the rating-implied default spread (for PEP it is A+, with corporate bonds of similar rating showing an average spread of 1.226% as of the latest available period) plus the risk-free rate:
Cost of equity = 3.81% + 0.84*8.72% = 11.1%
Cost of debt = (1.226%+3.81%) * (1-23.87%) = 3.83%
Consequently, the 5-year transitional WACC of 10.3% will be linearly adjusted downwards during the remaining five years to a terminal rate of 8.3%.
Apart from these major assumptions, the following have been applied in the model as well:
- Share count of 1,382.6mln (including RSUs);
- Marginal tax rate of 23.87% (weighted average of the marginal tax rates of the geographies PEP operates in);
- Value of debt of $46bln, including leases;
- Value of options of $918mln, based on 10.5mln stock options outstanding, average strike price of $124.63, average maturity of 6.08 years and standard deviation of 16% (FY’2022 10-K filing);
- The value of strategic investments held by the company and non-controlling interest in the amount of $20bln and $926mln, respectively, calculated as Q2’2023-end carrying values of $3bln and $140mln, respectively, each multiplied by an average P/B ratio of soft beverage companies of 6.6x.
The table below presents the model results (also note that base-year revenue and EBIT figures are organic, rather than GAAP):
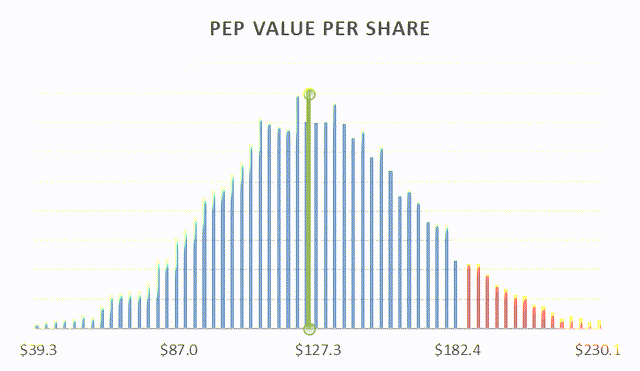
At current price per share of around $185 and the computed value per share of almost $127, the stock appears to be overvalued by about 32%. To account for the uncertainty factor in the main assumptions discussed above (such as higher revenue growth rates and OPM), the Monte Carlo simulation of 10-K trials has been conducted by applying probability distributions to base-case assumptions of revenue growth, operating margin, reinvestment ratio, and the WACC. The results are provided below:
Figure 7
Figure 7 shows the median value per share of $126 (vertical green line) and the area above the current $185 value per share (colored red). As a result of these simulations, given the distribution assumptions, it appears there is more than 90% chance the stock is overvalued at the current price of about $185.
Though this may turn out to be an unpopular opinion – after all, PEP is a common dividend-paying company, with many individual investors likely holding the stock over a very long period and having a low-cost basis – I hope this article will accomplish, at least, two things: provide an alternative view to the current shareholders; and inform new investors looking at purchasing the company’s shares.
Analyst’s Disclosure: I/we have no stock, option or similar derivative position in any of the companies mentioned, and no plans to initiate any such positions within the next 72 hours. I wrote this article myself, and it expresses my own opinions. I am not receiving compensation for it (other than from Seeking Alpha). I have no business relationship with any company whose stock is mentioned in this article.
Seeking Alpha’s Disclosure: Past performance is no guarantee of future results. No recommendation or advice is being given as to whether any investment is suitable for a particular investor. Any views or opinions expressed above may not reflect those of Seeking Alpha as a whole. Seeking Alpha is not a licensed securities dealer, broker or US investment adviser or investment bank. Our analysts are third party authors that include both professional investors and individual investors who may not be licensed or certified by any institute or regulatory body.


