Summary:
- PepsiCo is a great growth company with a high valuation, trading at 31.5x TTM P/E.
- The latest Q2 2023 results show strong growth in net revenue and organic revenue of 10.4% and 14%, respectively.
- PEP is a highly profitable business and deserves to trade at a premium, but I will wait for a quarter of weak growth and a pullback to become an investor.
Chinnachart Martmoh
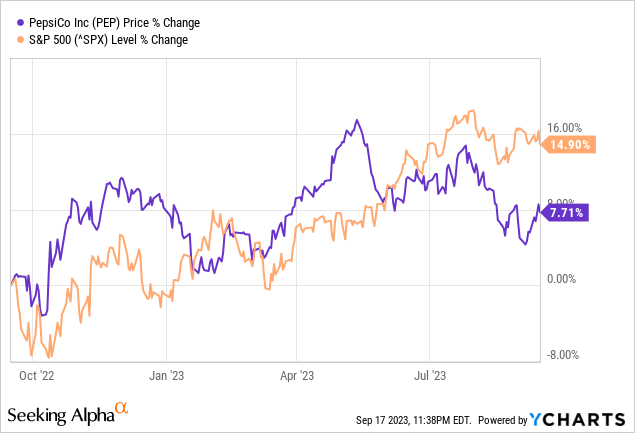
PepsiCo (NASDAQ:PEP) (Pepsi) is a great growth company and global consumer staple name that remains on my wishlist to buy on any market weakness. The company currently trades at a hefty 31.5x TTM P/E given the company’s great growth track record. With the latest Q2 2023 growth rates still looking strong and even above 5-year averages, the valuation remains high in this expensive market. This article will take a look at the latest quarterly results and potential shareholder yields investors could expect from Pepsi at current prices.
Great Growth in the Latest Q2 2023 Results
In Pepsi’s latest Q2 quarter, the company continued its robust growth with net revenue growth of 10.4% and organic revenue growth of 13.0%. COGS were kept under control with gross margins increasing 1.3% to 54.7% from 53.4% in Q2 2022. SG&A expenses grew at a high 15.6% rate in the quarter compared to Q2 2022 so inflation is hitting the company on multiple fronts. All of this led to core EPS increasing 15% to $2.09 in the quarter.
For the six month YTD period, net revenue growth was 10.3% ($3.7 billion) and organic core revenue growth was 13.6%. SG&A expenses of $15.8 billion for the six month period were only 11% higher ($1.6 billion) than the prior period’s $14.2 billion. This cost control helped more of the revenue gains reach the bottom line to drive core EPS increasing 16% to $3.59.
As laid out in table highlighted from the Q2 release below, the revenue gains were driven by pricing and partially offset by volume decreases in most areas. Asia Pacific was the main highlight to the positive with volumes up 7% in beverages compared to negative 4.5% volume growth in PepsiCo Beverages North America.
Revenue Growth Breakdown at Pepsi in Q2 2023 (from company Q2 2023 earnings release)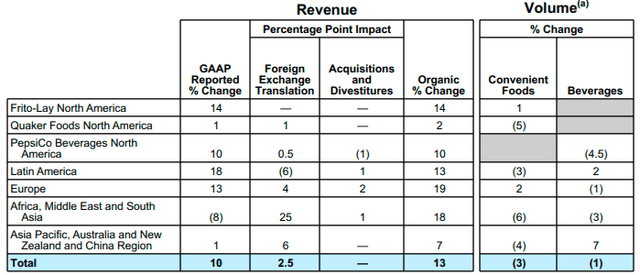
The company updated guidance to 10% organic revenue growth (previously 8%) and EPS growth of 12% in core constant currency terms (previously 9 percent). With core EPS of $6.79 reported for the full 2022 year, this 12% would imply $7.60 EPS for 2023 and a 23.7x forward P/E based on management’s guidance. With Pepsi’s Q3 2023 results scheduled to be released October 10th, I will be keeping an eye on the growth rates continuing with keen interest on the distinction between volume growth and price increases. The price led growth seen in recent quarters only goes part of the way to justifying the P/E multiple and I would like to see some volume increases in Q3.
A Highly Profitable and Growing Company
Pepsi’s global brand power has allowed the company to grow rapidly while maintaining a high level of profitability. Since 2018, the company has achieved average return on equity (ROE) and return on invested capital (ROIC) of 50.3% and 21.% respectively. One notable one-time item in the below graph adjusted is a net tax benefit of $3.71 per share in 2018 related to the related to the TCJ Act. The company’s latest core effective tax rate of 20% is used to build the normalized ROIC figure. This level of profitability is well above my rule of thumb of 15% ROE and 9% ROIC, allowing me to be confident that, in my opinion, the company is able to maintain and continue to increase its intrinsic value in the future.
Historical Profits and Growth at Pepsi (Compiled by author from company financials)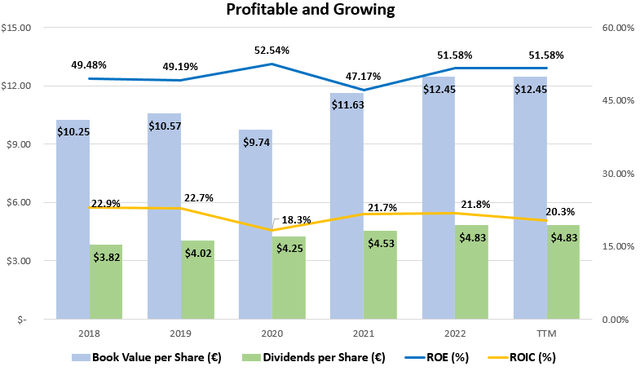
Strong Brand & Huge Excess Cash Flows
Strong businesses with wide moats such as Pepsi are able to generate cash beyond what is needed to fund operations. With capital expenditures and acquisitions taking up on average 41% and 13%, respectively, of cash flow from operations over the past five years, this leaves approximately 46% to be returned to investors in the form of dividends and share repurchases. With average cash flow from operations of $11.0 billion over the past three years, this 46% would imply free cash flow to shareholders of $4.8 billion for around an only 1.94% free cash flow yield at the current $247.5 billion market capitalization. While this might not seem like a high yield by itself, adding Pepsi’s high growth rates to be discussed next could bring this yield above my target 9% rate.
Cash Flow Analysis of Pepsi (compiled by author from company financials)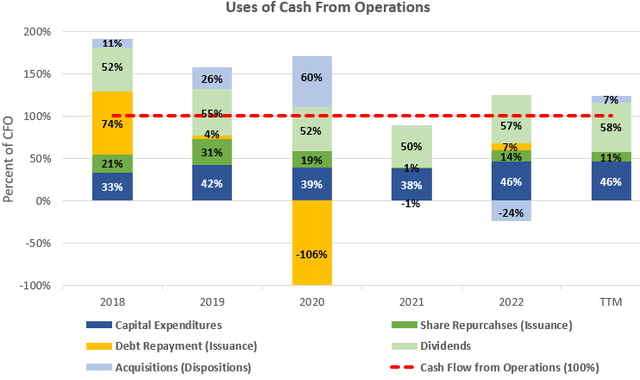
A Great Growth Story at a Fair Price
Pepsi is a great growth story with great global brands across beverage and snacking categories. Since 2018, the company has grown revenues per share at an impressive average rate of 8.4% but EPS (adjusted for the $3.71 per share in 2018 mentioned earlier) has only grown at an average rate of 2.7% as can be seen in the graph below. Dividend growth has been a little lower than these revenue gains at an average rate of 5.4% due to the payout ratio being an already high 85% in the TTM period. This dividend payout ratio shows only room for growth of EPS or revenue gains going forward.
Per Share Growth at Pepsi (compiled by author from company financials)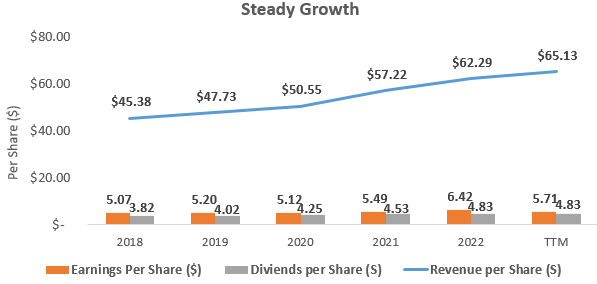
With these impressive growth rates, Pepsi is left trading at a high 31.5x TTM P/E but this starts to look slightly more reasonable in a P/E to growth ratio (PEG) of 3.8x and 4.1x based on the 8.4% revenue growth per share since 2018 and 7.7% sustainable growth rate (SGR). The SGR of 7.7% is calculated as the 50.3% average ROE mentioned earlier multiplied by 1 minus the dividend payout ratio of 85% in the TTM period.
The current PEG ratios are still above legendary investor Peter Lynch’s rule of thumb of a non-expensive business being under 2x, but are getting much more reasonable. A PEG ratio over 2x suggests that earnings growth is already more than built into the price and a PEG ratio of 1x suggests the company is fairly valued.
Getting a Sense of Valuation
Pepsi’s 31.5x TTM P/E ratio can also be expressed as 3.2% earnings yield but I also always like to examine the relationship between average ROE and price-to-book value in what I call the Investors’ Adjusted ROE. It examines the average ROE over a business cycle and adjusts that ROE for the price investors are currently paying for the company’s book value or equity per share. Pepsi has a great ROE but potential returns for investors depend on the multiple paid for the book value of equity in the public stock market.
With Pepsi earning an average ROE (adjustment for the 2018 taxes) of 50.3% since 2018 and shares currently trading at a price-to-book value of 14.4x when the price is $179.84, this would yield an investors’ Adjusted ROE of 3.5% for an investors’ equity at that purchase price, if history repeats itself. This is slightly below the 9% that I like to see, but adding the growth rates discussed earlier could increase this potential total return beyond my 9% target. Below is a table outlining the potential earnings yield estimates from this investors’ adjust ROE figure as well as the cash flow and earnings yields discussed.
Potential Shareholder Yields (compiled by author from market and company data)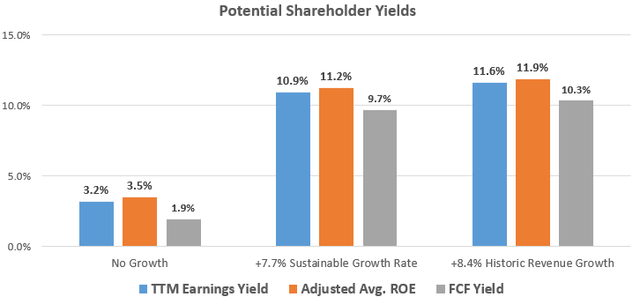
Takeaway for Investors
Pepsi is a great company with amazing global brands but remains expensive even when considering the growth. When taking Pepsi’s historic and most recent quarterly growth into account, Pepsi’s valuation only starts to look appealing. The 31.5x TTM P/E represents only a 3.2% earnings yield and the company currently trades at a very similar 3.5% investors’ adjusted ROE based on a historical analysis. While these yields are not much on their own to get excited about, adding Pepsi’s growth potential start to add up to some decent returns. While still expensive, Pepsi is on my radar for an investment if any further pullback occurs.
Analyst’s Disclosure: I/we have no stock, option or similar derivative position in any of the companies mentioned, and no plans to initiate any such positions within the next 72 hours. I wrote this article myself, and it expresses my own opinions. I am not receiving compensation for it (other than from Seeking Alpha). I have no business relationship with any company whose stock is mentioned in this article.
Disclaimer: While the information and data presented in my articles are obtained from company documents and/or sources believed to be reliable, they have not been independently verified. The material is intended only as general information for your convenience, and should not in any way be construed as investment advice. I advise readers to conduct their own independent research to build their own independent opinions and/or consult a qualified investment advisor before making any investment decisions. I explicitly disclaim any liability that may arise from investment decisions you make based on my articles.
Seeking Alpha’s Disclosure: Past performance is no guarantee of future results. No recommendation or advice is being given as to whether any investment is suitable for a particular investor. Any views or opinions expressed above may not reflect those of Seeking Alpha as a whole. Seeking Alpha is not a licensed securities dealer, broker or US investment adviser or investment bank. Our analysts are third party authors that include both professional investors and individual investors who may not be licensed or certified by any institute or regulatory body.
