Summary:
- Pfizer, yielding 5.6%, is an Ultra SWAN bargain with upside potential in the next year.
- Despite $70 billion in debt, Pfizer’s A- credit rating and stable cash flow ensure long-term stability and very strong dividend safety.
- Pfizer’s growth outlook includes a 5% long-term growth rate, with a 10% to 11% long-term return potential.
- While the risk profile is complex, S&P rates Pfizer an A credit rating and 81st-percentile risk management (the top 19% of global companies on managing risk).
- Pfizer’s 1, 2, and 5 year return potential is 41%, 55%, and 96% respectively, significantly more than the S&P, and you’re getting paid almost 6% in immediate yield.

dikushin
This article was coproduced with Dividend Sensei.
Bottom Line Up Front: Pfizer Is An Ultra SWAN Bargain Yielding 5.6%

Zen Research Terminal
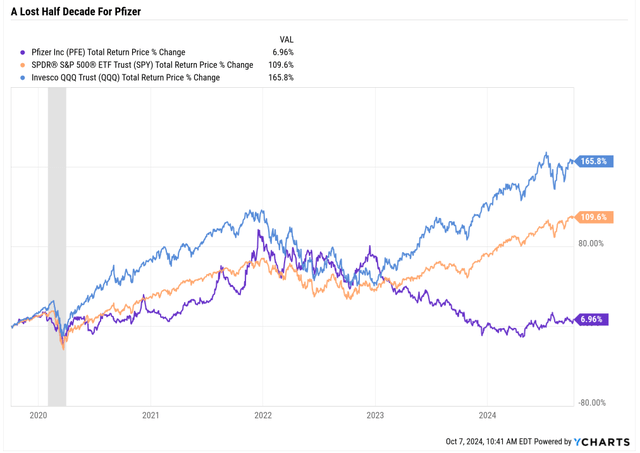
Pfizer (NYSE:PFE) offers a perfect example of how it’s always a market of stocks, not a stock market.
Ycharts
After going nowhere for five years, the data indicates Pfizer might be a coiled spring worth considering.
I’m not the only one who thinks that now might finally be the time to start buying this Ultra SWAN (sleep well at night) quality company.
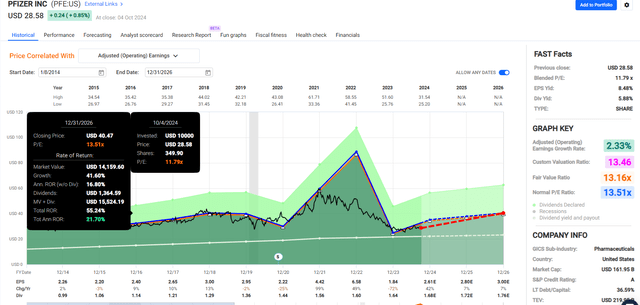
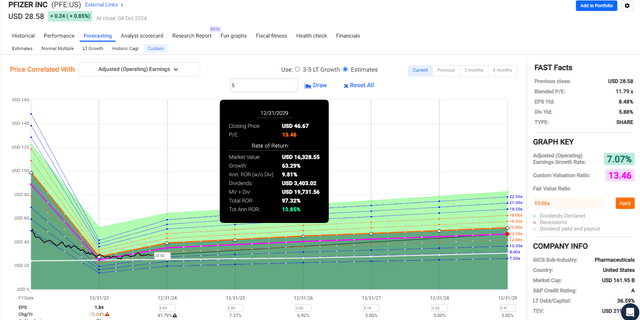
Pfizer Consensus 2026 and 2029 Total Return Potential
- Not a forecast.
- Consensus return potential.
- These are the expected returns if and only if these companies grow as expected and return to historical fair value by the end of 2026.
- Fundamentals would justify that.
3-Year Fundamentally Justified Upside Potential: 55% (22% CAGR) vs 25% S&P
FAST Graphs, FactSet
5-Year Fundamentally Justified Upside Potential: 97% (14% CAGR) vs 75% S&P (12% CAGR)
FAST Graphs, FactSet
So, let’s look at the three things investors need to know about Pfizer and its nearly 6% yielding opportunity.
As always, there are some important catches to be aware of before buying this stock.
Safety And Quality: Ultra SWAN Ultra Yield

Dividend Kings Zen Research Terminal
Pfizer will be upgraded to an Ultra Sleep Well at-night company in 2025 based on improvements in its fundamentals.
| Quality Score | Meaning | Max Invested Capital Risk Recommendation | Margin Of Safety Potentially Good Buy | Strong Buy | Very Strong Buy |
Ultra-Value Buy |
| 3 | Atrocious, Very High Bankruptcy Risk | 0% | NA (avoid) | NA (avoid) | NA (avoid) |
NA (avoid) |
| 4 | Terrible, High Bankruptcy Risk | 0% | NA (avoid) | NA (avoid) | NA (avoid) |
NA (avoid) |
| 5 | Very Poor | 0% | NA (avoid) | NA (avoid) | NA (avoid) |
NA (avoid) |
| 6 | Poor (very speculative) | 0.5% | 45% | 55% | 65% | 75% |
| 7 | Below-Average, Fallen Angels (speculative) | 1.0% | 40% | 50% | 60% | 70% |
| 8 | Average (Relative to S&P 500) | 2.5% (unless speculative or high risk than 1.0%) | 30% to 40% | 40% to 50% | 50% to 60% |
60% to 70% |
| 9 | Above-Average | 5% (unless speculative or high risk than 2.5%) | 25% to 35% | 35% to 45% | 45% to 55% |
55% to 65% |
| 10 | Blue-Chip | 7.5% (unless speculative or high risk than 2.5%) | 20% to 30% | 30% to 40% | 40% to 50% |
50% to 60% |
| 11 | SWAN (a higher caliber of Blue-Chip) | 10% | 15% to 25% | 25% to 35% | 35% to 45% |
45% to 55% |
| 12 | Super SWAN (exceptionally dependable blue chips) | 15% | 10% to 20% | 20% to 30% | 30% to 30% |
40% to 50% |
| 13 | Ultra SWAN (as close to perfect companies as exist) | 20% | 5% to 15% | 15% to 25% | 25% to 35% |
35% to 45% |
(Source: Dividend Kings Zen Research Terminal)
The Dividend King’s safety and quality scores are based on more than 1,000 fundamental metrics and calibrated to estimate the risk of a dividend cut in average and severe recessions since World War II.
| Rating | Dividend Kings Safety Score (Over 1,000 Metric Model) | Approximate Dividend Cut Risk (Average Recession) | Approximate Dividend Cut Risk In Pandemic Level Recession |
| 1 – unsafe | 0% to 20% | over 4% | 16+% |
| 2- below average | 21% to 40% | over 2% | 8% to 16% |
| 3 – average | 41% to 60% | 2% | 4% to 8% |
| 4 – safe | 61% to 80% | 1% | 2% to 4% |
| 5- very safe | 81% to 100% | 0.5% | 1% to 2% |
| Pfizer | 82% | 0.5% | 1.95% |
| S&P Risk Rating | 81% Risk Management Percentile, Excellent. | A stable outlook credit rating = 0.6% 30-year bankruptcy risk | 20% or Less Max Risk Cap |
(Source: Dividend Kings Zen Research Terminal)
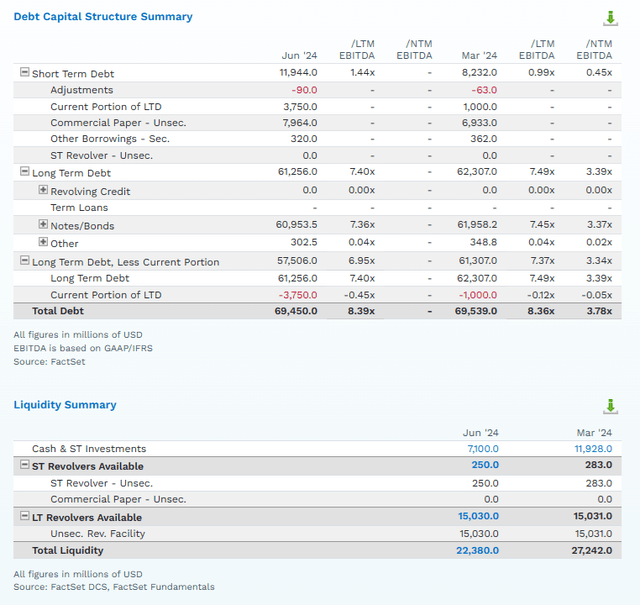
While Pfizer’s debt of almost $70 billion appears alarming, the bond market and rating agencies aren’t worried.
FactSet
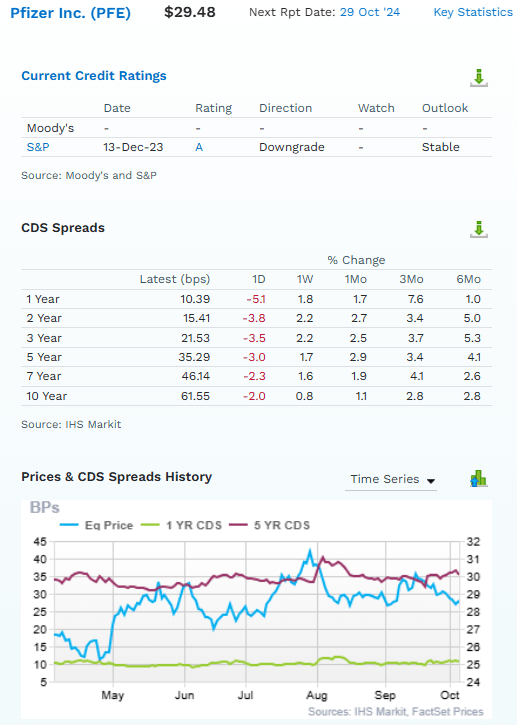
How do I know?
FactSet
All three rating agencies rate PFE A- or better.
| Rating Agency | Credit Rating | Outlook | 30-Year Default/Bankruptcy Risk |
| S&P | A | Stable | 0.60% |
| Fitch | A | Stable | 0.60% |
| Moody’s | A2 (A- equivalent) | Stable | 2.50% |
| Average | A | Stable | 1.23% |
(Sources: Rating Agencies)
Credit default swaps are traded insurance policies against bond defaults and tell us the real-time default (bankruptcy risk) of a company going to zero within a specific period.
For example, In the next 10- years, there’s a 0.6155% probability of PFE going bankrupt in the next decade, and the stock to zero.
That’s consistent with an A- credit rating.
The fundamental risk of default is stable (up 2.8% in the last six months).
When the price is volatile, and the fundamental risk is stable, you can buy with confidence, knowing that the thesis is unlikely to break.

FactSet
The bond market is confident that PFE will still be around and paying its bonds in 2063, which is why its 39-year bonds yield just 5.28%, factoring in default risk.
How can the bond market (and rating agencies) be so confident in Pfizer’s stability and balance sheet in the face of $70 billion worth of debt?
Pfizer Balance Sheet Consensus Forecast
| Year | Total Debt (Millions) | Cash | Net Debt (Millions) | Interest Cost (Millions) | EBITDA (Millions) | Operating Cash Flow (Millions) | Average Interest Rate |
| 2023 | $75,449 | $37,558 | $53,096 | $1,403 | $10,805 | $9,300 | 1.86% |
| 2024 | $74,136 | $6,434 | $52,896 | $2,916 | $22,278 | $18,755 | 3.93% |
| 2025 | $70,819 | $6,158 | $48,706 | $2,705 | $23,846 | $20,317 | 3.82% |
| 2026 | $68,409 | $7,281 | $43,845 | $2,571 | $24,668 | $21,206 | 3.76% |
| 2027 | $67,531 | $8,917 | $36,882 | $2,489 | $24,662 | $21,338 | 3.69% |
| 2028 | $60,883 | $13,698 | $36,560 | $2,510 | $22,942 | $19,724 | 4.12% |
| 2029 | $58,933 | $20,672 | NA | $2,328 | $24,403 | $19,183 | 3.95% |
| Annualized Growth (2024-2029) | -4.0% | -9.5% | -7.2% | -1.0% | 1.8% | 0.5% | 0.1% |
(Source: FactSet)
Pfizer’s net debt is falling at 7%, a rate that would cut it in half every decade.
Its long-term borrowing costs are expected to remain stable at around 4%.
- 10-year median return on capital: 80%
Pfizer Leverage Consensus Forecast
| Year | Debt/EBITDA | Net Debt/EBITDA (3 Or Less Safe According To Credit Rating Agencies) |
Interest Coverage (8+ Safe) |
| 2023 | 6.98 | 4.91 | 6.63 |
| 2024 | 3.33 | 2.37 | 6.43 |
| 2025 | 2.97 | 2.04 | 7.51 |
| 2026 | 2.77 | 1.78 | 8.25 |
| 2027 | 2.74 | 1.50 | 8.57 |
| 2028 | 2.65 | 1.59 | 7.86 |
| 2029 | 2.41 | NA | 8.24 |
| Annualized Change | -16.2% | -20.2% | 3.7% |
(Source: FactSet)
Pfizer’s cash flow is relatively stable, outside of the once-in-a-lifetime (200%) Pandemic sales boom, and that’s what matters to bond investors, rating agencies, and prudent long-term investors.
As long as PFE’s long-term debt-to-cash flow ratio is under 2, rating agencies don’t care if its debt is $7 billion or $7 trillion.
| Credit Rating | Safe Net Debt/EBITDA For Most Companies | 30-Year Default/Bankruptcy Risk |
| BBB | 3.0 or less | 7.50% |
| A- | 2.5 or less | 2.50% |
| A | 2.0 or less | 0.66% |
| A+ | 1.8 or less | 0.60% |
| AA | 1.5 or less | 0.51% |
| AAA | 1.1 or less | 0.07% |
(Rating Agencies)
Microsoft (MSFT) is an AAA-rated company. As long as its cash flow is stable (recurring revenue model) and the debt-to-cash flow ratio is 1.1 or less, Microsoft could take on $1 trillion-plus in net debt and remain an AAA-rated company.
What about the dividend profile?
Dividend Profile Consensus
| Year | Dividend | EPS | EPS Payout Ratio |
| 2010 | 0.72 | 2.23 | 32.3% |
| 2011 | 0.8 | 2.31 | 34.6% |
| 2012 | 0.88 | 2.19 | 40.2% |
| 2013 | 0.96 | 2.22 | 43.2% |
| 2014 | 1.04 | 2.26 | 46.0% |
| 2015 | 1.12 | 2.2 | 50.9% |
| 2016 | 1.2 | 2.4 | 50.0% |
| 2017 | 1.28 | 2.65 | 48.3% |
| 2018 | 1.36 | 3 | 45.3% |
| 2019 | 1.44 | 2.95 | 48.8% |
| 2020 | 1.52 | 2.22 | 68.5% |
| 2021 | 1.56 | 4.42 | 35.3% |
| 2022 | 1.60 | 6.58 | 24.3% |
| 2023 | 1.64 | 1.84 | 89.1% |
| 2024 | 1.68 | 2.65 | 63.4% |
| 2025 | 1.72 | 2.86 | 60.1% |
| 2026 | 1.71 | 3 | 57.0% |
| 2027 | 1.76 | 3.07 | 57.3% |
| 2028 | 1.78 | 2.85 | 62.5% |
| Total/Annualized (2023 to 2028) | 1.7% | 2.8% | 67.4% |
(Source: FactSet)
Pfizer’s dividend is expected to grow slowly for the next few years as it normalizes its earnings and brings the payout ratio down to a safe sub-60 % level.
- Rating agencies say the average payout ratio since 2010 is 50.4% vs. 60% or less safe.
Growth Outlook: Improving, But It’s Not A GLP1 Growth Rock Star

FactSet
PFE’s big growth spike is courtesy of a recovery from an epic once-in-a-lifetime event, the 200% sales spike from COVID-19 vaccines, that will never be repeated.
If you exclude the 2023 earnings collapse (-73%), the median growth consensus is 5.0%.
- Range of -3% to 58.6% CAGR long-term growth forecasts.
That’s why the median consensus is useful. It isn’t affected by the outlier forecasts that are almost certainly going to be proven wrong.
Rolling Returns Since 1985

Portfolio Visualizer
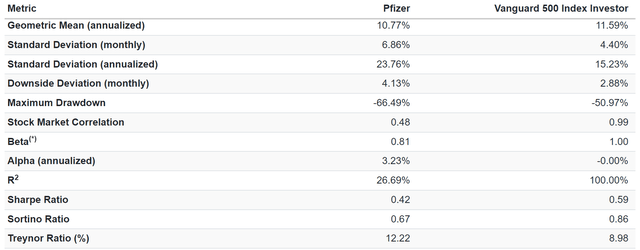
While PFE’s historic 11% annual returns since 1985 aren’t that impressive compared to the S&P, it achieved those with 19% less volatility.
Adjusted for volatility, it beat the market by 3% over the last four decades.
Portfolio Visualizer
Per unit of volatility, it generated 12.2% of excess total returns compared to risk-free bonds (Treynor ratio), which is 50% more than the S&P 500’s 9%.
In other words, for 40 years, PFE has done an admirable job of providing a source of growing income and relatively low-volatility double-digit returns.
Portfolio Visualizer
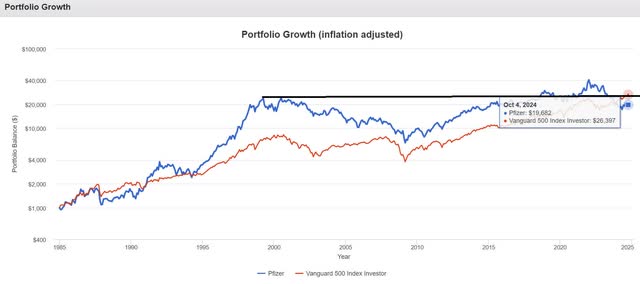
Adjusted for inflation, PFE has delivered 20X returns since 1985. If you paid 70X earnings in the 2000s tech bubble peak, you’re still underwater 24 years later.
- Crazy valuations are extremely dangerous. You can lose money for decades (assuming the company survives).
Analysts now expect 5% long-term growth from PFE (slightly below the 6% Moody’s expects from the pharma industry), a 5.6% yield + 5% growth = 10.6% long-term growth, plus a modest valuation bump for the next 10 to 20 years.
In other words, based on the best available data, PFE investors can realistically expect similar 10% to 11% long-term returns for the next 10 to 20 years.
Valuation: A Great Company At A Great Price

Dividend Kings Zen Research Terminal
PFE trades at a 25% discount to historical fair value and offers 41% upside potential in the next 12 months.
It’s a potentially very strong buy with the ultra value buy (Buffett-style “fat pitch”) at $25.77, a 35% historical discount.
The FCF yield is relatively low because of the temporary decrease in free cash flow associated with the big decrease in COVID-19 vaccine revenue.
However, as you can see, the valuations are expected to rapidly improve as free cash flow recovers strongly in the coming years.
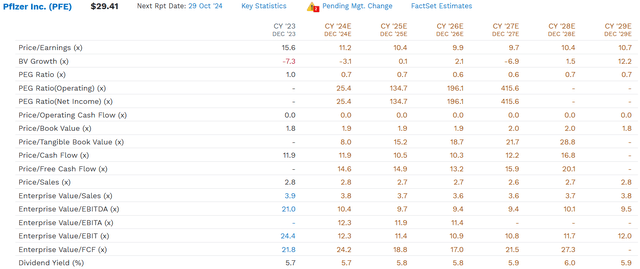
FactSet
PFE is not a traditional deep-value stock regarding FCF yield (free cash flow/enterprise value), so it’s not a traditional Buffett-style bargain.
- Low EV/FCF multiples are the best value strategy of the last 33 years.
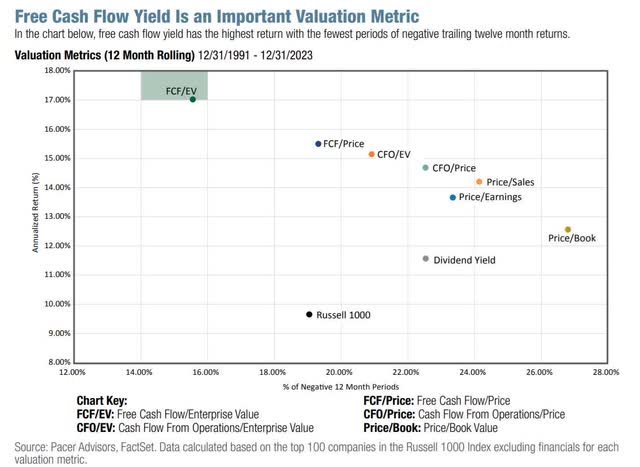
Pacer Funds
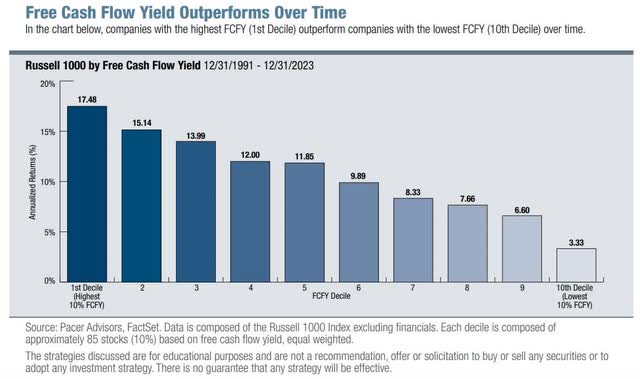
Pacer Funds
Risks To Consider: Why Pfizer Isn’t Right For Everyone
Like any company, Pfizer faces numerous risks, including:
Risk Summary
• Generic competition.
• Potential drug pricing policy changes by governments.
• An increasingly stringent Food and Drug Administration (FDA).
• Stronger negotiating power of managed-care companies and pharmacy benefit managers.
• More challenging new-drug development in several disease areas.
• Risk-conscious FDA.
• Access to essential services (tied to potential US policy reform on drug pricing).
• Exposure to Medicare reforms reflected in the Inflation Reduction Act.
• Product governance risks (e.g., off-label marketing, litigation related to side effects).
• Potential for lower drug prices due to the negotiation power of managed-care companies and pharmacy benefit managers.
• Exposure to Medicare channel for essential drugs (Eliquis, Ibrance, Xtandi), generating almost 25% of total sales.
• Morningstar estimates annual legal costs to be close to 1% of adjusted net income.
• Medicare For All (5% risk over the next decade) according to Morningstar.
And these are hardly the entire list.
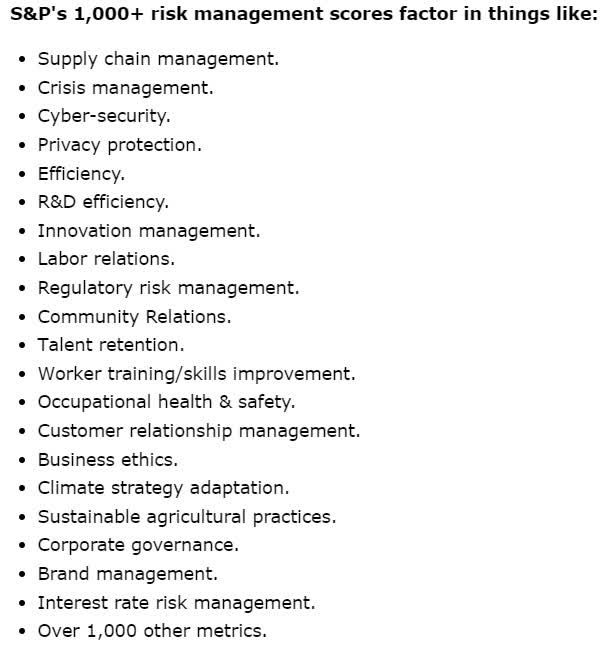
S&P
S&P’s credit ratings include its comprehensive long-term risk management model, which compares a company against the industry leader in each risk metric.
- 100% is calibrated to the No. 1 rated company in each risk metric.
The total risk management rating represents “% of optimal risk management” or “as close to perfect risk management as can be reasonably expected.”
| S&P LT Risk Management Score | Rating |
| 0% to 9% | Very Poor |
| 10% to 19% | Poor |
| 20% to 29% | Suboptimal |
| 30% to 59% | Acceptable |
| 60% to 69% | Good |
| 70% to 79% | Very Good |
| 80+% | Exceptional |
| Pfizer | 59% Optimal |
| Global Percentile | 81% (Top 19% of global companies) |
(Source: S&P)
For context:
- Dividend Aristocrat Average: 67th percentile (top 33% global companies).
- S&P Weighted Average: 72nd percentile (top 28% global companies).
Pfizer’s risk management is very strong, which should help long-term income investors keep their faith during inevitable volatility, and there are plenty of such periods.
Portfolio Visualizer
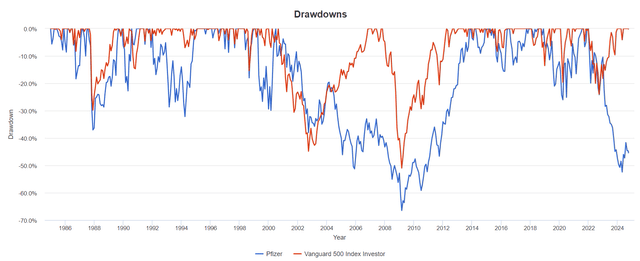
Pfizer’s bear markets since 1985 have been impressive in their severity and a lot worse than you’d imagine from a defensive, low-volatility healthcare stock.

Portfolio Visualizer
There have been many market corrections where PFE fell more than the market.

Portfolio Visualizer
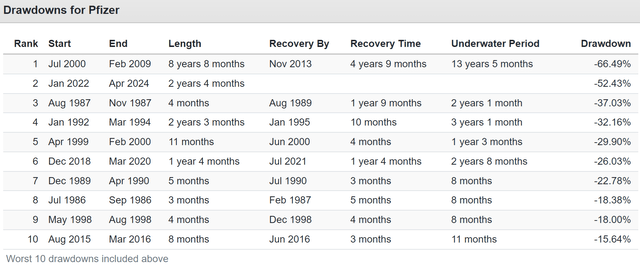
PFE investors have occasionally had to wait years before recovering from bear markets, including 13.5 years after the tech bubble took its PE to almost 70.
Portfolio Visualizer
And, of course, these bear markets hide the severity of some declines.
10 Worst Years For Pfizer Since 1985
| Pfizer | Vanguard 500 Index Investor | ||
| Year | Inflation | Return | Return |
| 2023 | 3.35% | -41.22% | 26.11% |
| 2004 | 3.26% | -22.31% | 10.74% |
| 2002 | 2.38% | -22.16% | -22.15% |
| 1999 | 2.68% | -21.50% | 21.07% |
| 1987 | 4.43% | -21.37% | 4.71% |
| 2008 | 0.09% | -16.85% | -37.02% |
| 2001 | 1.55% | -12.49% | -12.02% |
| 1992 | 2.90% | -11.97% | 7.42% |
| 2005 | 3.42% | -10.62% | 4.77% |
| 2022 | 6.45% | -10.42% | -18.23% |
| Average | 3.05% | -19.09% | -1.46% |
| Median | 3.02% | -16.88% | -4.22% |
(Source: Portfolio Visualizer)
Idiosyncratic bear markets are the hallmark of individual stock investing.
You have to be ready for an individual stock you own to fall 41% in the same year the market is up 26%.
10 Best Years For Pfizer Since 1985: What Makes The Terrible Years Worth It
| Pfizer | Vanguard 500 Index Investor | ||
| Year | Inflation | Return | Return |
| 1991 | 3.06% | 112.75% | 30.22% |
| 1997 | 1.70% | 81.93% | 33.19% |
| 1998 | 1.61% | 68.94% | 28.62% |
| 2021 | 7.04% | 66.74% | 28.53% |
| 1995 | 2.54% | 66.70% | 37.45% |
| 2000 | 3.39% | 43.07% | -9.06% |
| 1996 | 3.32% | 33.96% | 22.88% |
| 1988 | 4.42% | 29.23% | 16.22% |
| 2011 | 2.96% | 28.77% | 1.97% |
| 2013 | 1.50% | 26.22% | 32.18% |
| Average | 3.15% | 55.83% | 22.22% |
| Median | 3.01% | 54.89% | 28.58% |
(Source: Portfolio Visualizer)
This is the upside of the downside. The best years usually follow the worst years, including a 113% gain in 1991, when the S&P was up 30%.
But annual returns hide the true nature of volatility, so let’s look at monthly returns.
5% Worst Months For Pfizer Since 1985
| Pfizer | Vanguard 500 Index Investor | ||
| Year | Month | Return | Return |
| 1987 | 10 | -24.01% | -21.73% |
| 2009 | 1 | -17.67% | -8.41% |
| 1999 | 4 | -17.07% | 3.85% |
| 1998 | 8 | -15.16% | -14.47% |
| 1986 | 9 | -14.71% | -8.31% |
| 2020 | 6 | -14.38% | 1.98% |
| 2009 | 2 | -13.72% | -10.66% |
| 1990 | 2 | -13.12% | 1.27% |
| 1992 | 1 | -13.10% | -1.88% |
| 2023 | 1 | -13.02% | 6.27% |
| 2005 | 10 | -12.94% | -1.68% |
| 2002 | 9 | -12.27% | -10.87% |
| 1987 | 11 | -11.60% | -8.19% |
| 1993 | 7 | -11.19% | -0.42% |
| 2000 | 2 | -10.99% | -1.91% |
| 1993 | 2 | -10.96% | 1.36% |
| 2022 | 2 | -10.91% | -3.00% |
| 1999 | 12 | -10.52% | 5.98% |
| 2022 | 8 | -10.45% | -4.09% |
| 2019 | 7 | -10.34% | 1.43% |
| 2020 | 2 | -10.26% | -8.24% |
| 2000 | 7 | -10.16% | -1.50% |
| 2005 | 1 | -10.15% | -2.45% |
| 2022 | 1 | -10.10% | -5.19% |
| Average | -12.87% | -3.79% | |
| Median | -12.40% | -3.04% |
(Source: Portfolio Visualizer)
PFE’s average 5% worst monthly decline is a 13% fall in one month, though the worst monthly return since 1985 is twice that severe.
Note how the market’s average decline in these terrible months is 25%, as bad as PFE, and there are some months when the market is flat or rising, including in December 1999 when PFE was down 11%, and the market was up 6%.
- Market envy risk (FOMO)
5% Best Months For Pfizer Since 1985: What Makes The Terrible Months’ Worth It
| Pfizer | Vanguard 500 Index Investor | ||
| Year | Month | Return | Return |
| 1991 | 12 | 26.55% | 11.41% |
| 2021 | 11 | 23.93% | -0.71% |
| 2020 | 7 | 18.83% | 5.63% |
| 1990 | 7 | 18.13% | -0.35% |
| 1997 | 10 | 18.09% | -3.35% |
| 1991 | 2 | 17.59% | 7.15% |
| 1985 | 11 | 17.54% | 6.94% |
| 2020 | 4 | 17.52% | 12.81% |
| 1990 | 5 | 17.23% | 9.69% |
| 1988 | 1 | 17.16% | 4.17% |
| 1997 | 6 | 16.02% | 4.45% |
| 2000 | 4 | 15.21% | -3.00% |
| 2020 | 11 | 15.17% | 10.94% |
| 2009 | 5 | 15.01% | 5.62% |
| 1986 | 2 | 14.47% | 7.58% |
| 1989 | 7 | 14.35% | 9.01% |
| 1998 | 4 | 14.17% | 1.01% |
| 1997 | 4 | 14.12% | 5.96% |
| 2000 | 3 | 13.81% | 9.75% |
| 1986 | 6 | 13.72% | 1.67% |
| 1998 | 9 | 13.71% | 6.41% |
| 2024 | 5 | 13.53% | 4.95% |
| 1985 | 5 | 13.20% | 6.03% |
| 1998 | 3 | 12.64% | 5.10% |
| Average | 16.32% | 5.37% | |
| Median | 15.19% | 5.80% |
(Source: Portfolio Visualizer)
Why own individual stocks? Because it allows you to make 24% in a month when the S&P is down 3%.
That’s the upside of stock picking, zig when the market zags.
Bottom Line: Pfizer: A 6% Yielding Ultra SWAN Bargain Opportunity With A Catch
If you understand the nature of Pfizer — that it’s not a historical market beater and likely won’t be long term — then you understand the opportunity PFE presents today.
After a multi-year bear market caused by the once-in-a-lifetime pullback in revenue growth caused by the Pandemic Vaccine bonanza, Pfizer is trading at one of the best valuations in decades.
As its growth improves, that creates a coiled spring opportunity that includes:
- 5.7% yield today.
- 10% to 11% long-term income growth potential.
- 41% upside potential in the next year.
- 55% upside potential in the next two years.
- 100% upside potential in the next five years.
- 10% to 11% long-term return potential (but with 19% lower volatility than the S&P).
Suppose you’re looking for Ultra SWAN Ultra Yield in today’s market, trading near record highs. In that case, PFE is a potentially attractive opportunity to earn Buffett-like (21% CAGR) returns from a blue-chip bargain hiding in plain sight.
Author’s Note: Brad Thomas is a Wall Street writer, which means he’s not always right with his predictions or recommendations. Since that also applies to his grammar, please excuse any typos you may find. Also, this article is free: written and distributed to assist in research while providing a forum for second-level thinking.
Analyst’s Disclosure: I/we have no stock, option or similar derivative position in any of the companies mentioned, and no plans to initiate any such positions within the next 72 hours. I wrote this article myself, and it expresses my own opinions. I am not receiving compensation for it (other than from Seeking Alpha). I have no business relationship with any company whose stock is mentioned in this article.
Seeking Alpha’s Disclosure: Past performance is no guarantee of future results. No recommendation or advice is being given as to whether any investment is suitable for a particular investor. Any views or opinions expressed above may not reflect those of Seeking Alpha as a whole. Seeking Alpha is not a licensed securities dealer, broker or US investment adviser or investment bank. Our analysts are third party authors that include both professional investors and individual investors who may not be licensed or certified by any institute or regulatory body.
Sign Up For A FREE 2-Week Trial
Join iREIT® on Alpha today… for more in-depth research on REITs, mREITs, Preferreds, BDCs, MLPs, ETFs, Builders, and Asset Managers. You’ll get more articles throughout the week, and access to our Ratings Tracker with buy/sell recommendations on all the stocks we cover. Plus unlimited access to our multi-year Archive of articles.
Here are more of the features available to you. And there’s nothing to lose with our FREE 2-week trial. Just click this link.
And this offer includes a FREE copy of my new book, REITs for Dummies!

