Summary:
- Southwest Airlines stock has underperformed the S&P 500 by about 100% since the beginning of the pandemic.
- The historical earnings pattern of Southwest Airlines shows that it is a deeply cyclical stock.
- Southwest Airlines has experienced similar drawdown periods in the past, and the current decline could potentially be as long as the one that started in 2000.
- In this article, I share the price at which I would be willing to buy Southwest Airlines stock.
BanksPhotos
Introduction
It has been a while since I’ve written about an airline stock. In fact, Southwest Airlines (NYSE:LUV) was the last one, and that article came out on March 6th, 2020, at the beginning of the pandemic. It was a bearish article titled “Re-Evaluating My Bearish Southwest Airlines Sentiment”. It, amazingly, was the only bearish article written in the year-and-a-half leading into the heart of the pandemic published on SA. Here is the conclusion of the article:
My 2018 rotation was a success with Southwest, but I think the price is likely to fall much farther from here. For investors who like the long-term prospects of the business who are waiting with cash to buy the stock, I wouldn’t get interested until it’s in the mid-$20s price-wise, which is what we would expect from a moderate recession. If the coronavirus is clearly devastating the industry and wider economy in a few months, wait until the government steps in with a bailout. The odds are very high that will happen, given the unusual nature of the cause of the decline.
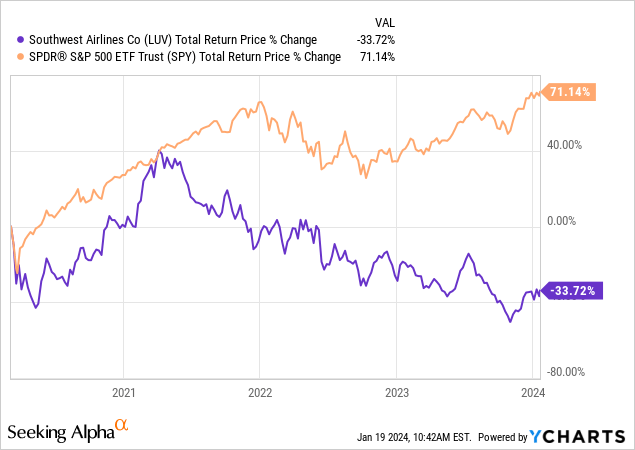
Here is how the stock has performed since that “sell” article:

The stock bottomed at $22.47 in March 2020 and rallied after the government bailout. Now it’s back down around the $30.00 level and has underperformed the S&P 500 by about 100%. (As a side note, the folks who called out Warren Buffett for selling his airline stocks and buying Berkshire stock instead around April 2020, have been proven exceptionally wrong about Buffett making a mistake.)
We’ve now had a few years for airlines to regain profitability and for some of the post-COVID boom to wear off. Southwest stock is getting more interesting now. In this article, I’ll share my approach to deep cyclical stocks like LUV, and the price I’m aiming to potentially buy the stock.
Southwest Airlines Earnings Cyclicality
I always start my stock analyses by examining the historical earnings patterns of a business. I’ve found that about 80% of the time, history is a good guide to the future unless something has significantly changed. Additionally, the historical earnings pattern can tell me how cyclical the business’s earnings have been, and this will determine what sort of analysis I’ll perform on the stock. If earnings are really cyclical, I’ve found they aren’t a very useful valuation metric.
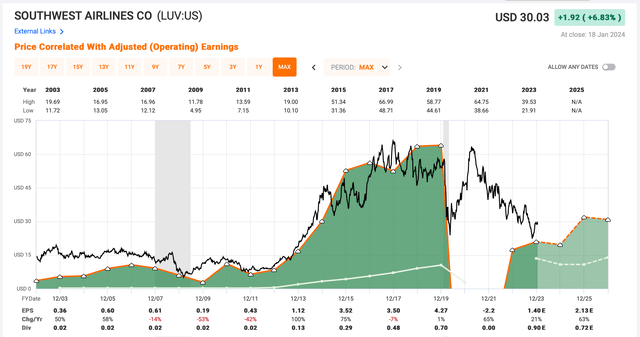
The dark green shaded area in the FAST Graph represents LUV’s earnings per share. We can see that during the Great Recession earnings fell by 2/3rds from about 0.61 per share in 2007 to .19 per share in 2009. Usually, if earnings have fallen more than -50% I consider them deeply cyclical, and LUV meets that standard.
When a business is deeply cyclical, I don’t use earnings to value the stock. Instead, I use historical stock price patterns. The reason for this is that earnings metrics like P/E ratios will often give precisely the wrong view to investors and can look quite low at the beginning of a big stock price decline and look absolutely miserable near the bottom of a cyclical drawdown. For example, in January 2010, which would have been a great time to buy the stock, the P/E ratio was about 60. When earnings peaked in 2007 the P/E was under 22. The P/E gave precisely the opposite reading for medium-term stock returns than what actually ended up happening.
So for Southwest, instead of earnings, I will examine historical price patterns, which tend to be a better guide.
LUV’s Historical Price Patterns
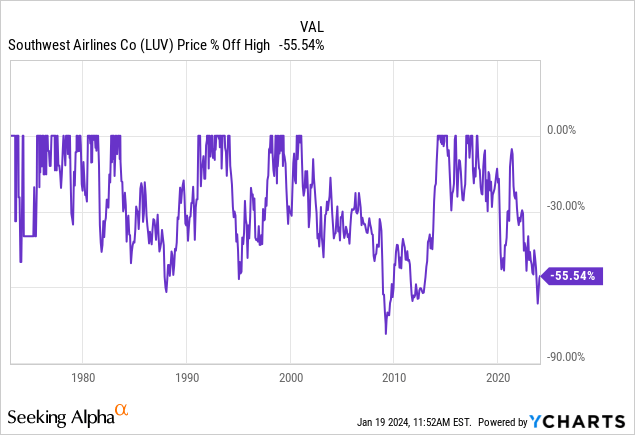
Once I determine a business is cyclical, I examine the stock’s historical drawdowns.

We can see that Southwest is in the midst of a fairly similar drawdown period it has experienced historically. But it should be noted that this one has by far been the worst in terms of earnings. It is a very similar decline to the one that started in 2000 and didn’t bottom until 9 years later. If we experience a recession before the stock price recovers this time, the downcycle could be just as long and deep. Southwest stock hasn’t recovered since I wrote my first warning on the stock in 2018, so we are already about 6 years into their current bear market. (This is why I usually aim for very low buy prices with stocks like this one.)
Some of the key factors current LUV shareholders might want to consider are the speed at which the stock price could fall, how deep the plunge could be, and how long they might expect the stock to stay below the price at which it is today. Over the past 50 years, LUV has had ten sell-offs of 35% or more as depicted in the table below:
| ~Year | ~Time until bottom | ~Duration | ~Depth |
| 1973 | 4 months | 6 months | -50% |
| 1974 | 6 months | 18 months | -60% |
| 1978 | 4 months | 8 months | -37% |
| 1981 | 4 months | 15 months | -49% |
| 1984 | 6 months | 18 months | -46% |
| 1985 | 2.5 years | 6 years | -59% |
| 1994 | 1 year | 4 years | -60% |
| 1999 | 6 months | 18 months | -38% |
| 2001 | 8 years | 14 years | -78% |
| 2018 | 5+ years | ? | -66% so far |
After reviewing the stock at the request of one of my subscribers last month, I noticed that earnings had started to recover and were positive again, and we just might be in the early stages of recovery. Examining LUV’s history, I think buying after a -65% decline off the high is reasonable. It actually fell below that level a month or two ago, but I was still avoiding airlines at that time so I didn’t notice it had briefly crossed that -65% threshold. But this tells us it certainly can fall that deeply.
Returns After Previous Historical Drawdowns
Typically, with deep cyclical investments, I plan to buy a stock when it is a certain percentage off its highs, and then sell it when it recovers that old high. The thinking behind this is that if investors were willing to pay a certain amount for a stock in the past, then if those conditions arise again, they will probably be willing to pay that price again. So, I have some reason to believe that history is likely to repeat itself. I do have additional factors I consider, and I will include those in a follow-up article if I end up buying the stock in the future. For now, what I want to know is what sort of returns I might expect if I buy LUV at certain levels off its high price. I only want to buy it if I think the returns will be superior to the market.
I’ve shared this data in the past, so I’m going to quote that past data below for buying at -35% and -60% levels:
Given what we know from Southwest’s past cycles, I’m going to backtest entry points after -35% and -60% declines. Investing after a -35% decline would have gotten us into all 9 of Southwest’s previous major declines. Embedded in that entry point is the secular bull story that airlines have now consolidated, fuel prices stay lower for longer, more people want to fly, etc. Investing after a -60% decline would have gotten us into 3 out of the 9 major downturns.
The table below shows the results one would have had they invested after a -35% decline in price during Southwest’s previous downturns. The returns in the table do not include dividends. I annualized the returns and then compared them to the S&P 500 if bought and sold on the same dates, annualized. The goal is to see if historically buying after a -35% decline would be an alpha-producing strategy, so the last column is the alpha produced by the investment annualized relative to the S&P 500. All the percentages should be treated as estimates and are based on the approximate months held. If one buys after a ~35% decline and sells after the stock makes a full recovery, it produces a ~55% simple return, so that is the simple return for each of the investments in the table below. I have excluded the years from the 1970s because the stock was so thinly traded during those years, but they would have produced solid alpha.
Year the Decline Began Purchase Date Sell Date Months Held Annualized Gains S&P 500 Annualized Gains Annualized Alpha to the S&P 500 1981 7/29/81 9/1/82 14 47.14% -7.24% 54.38% 1984 7/16/84 7/8/85 12 55.00% 26.60% 28.40% 1985 5/1/86 1/18/91 56 11.79% 8.85% 2.94% 1994 5/16/94 1/20/98 44 15.00% 32.78% -17.78% 1999 9/22/99 7/24/00 10 66.00% 14.08% 51.92% 2001 7/10/02 2/24/14 139 4.75% 8.69% -3.94%
From 1980 onward, Southwest has been a mixed bag in terms of producing alpha if one invested after a -35% decline off the highs. In 1994 it would have significantly underperformed the S&P 500, and in 2001 it took over a decade to recover its previous highs and also underperformed the S&P 500 during that time period. As a general rule, I want cyclical investments to recover within 5 years, so the 2001 downturn is a major issue for me, and I’ll examine that downturn more closely in a moment.
But first, let’s see what sort of effect making a second investment after a -60% drawdown in 1994, and 2001 would have had. In this table, I will add an additional column that shows the time-weighted annualized alpha if both purchase points are included.
Year the Decline Began Purchase Date Sell Date Months Held Annualized Gain S&P 500 Annualized Gain Annualized Alpha to S&P 500 Combined Time-Weighted Annualized Alpha to S&P 500 1994 12/20/94 1/20/98 37 48.65% 37.00% 11.65% -4.34% 2001 11/19/08 2/24/14 63 28.57% 25.69% 3.98% -1.47%
Alright, the good news is that buying LUV after -60% would have produced great returns and produced alpha during the 1994 and 2001 downturns. Additionally, the 63 months held during the decline that began in 2001, is pretty close to my 60-month preferred time horizon because even though the downturn started in 2001, we wouldn’t have bought until 2008. The bad news is that when we combine this with an equally weighted purchase after a -35% decline, we still would have underperformed the S&P 500 during both downturns.
One can see from the data above why I’ve always been slow to buy LUV. When buying -60% off its highs, the stock still would have outperformed the S&P 500, but only if one didn’t make an earlier purchase.
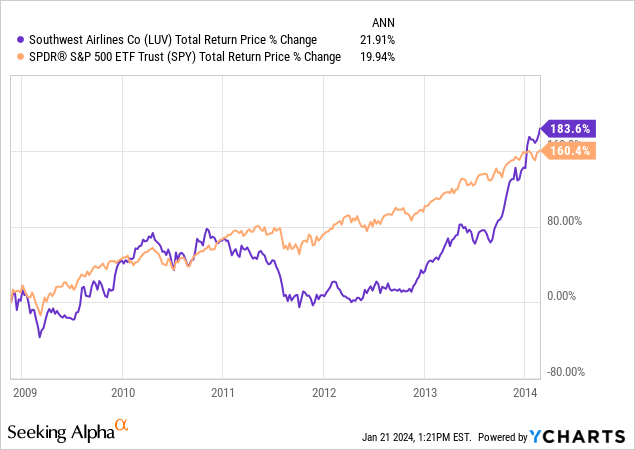
LUV did fall deeper than -60% in 2008 and we have already seen the extra weakness during the current downturn, so let’s backtest quickly with a chart of what would have happened if we bought in 2008/9 at the -65% level.

Purchasing LUV at just a little lower price would have produced returns that narrowly beat the S&P 500 and also produced about a 22% CAGR*. So, historically there is at last some evidence that -65% has been a good level at which to buy the stock.
*Just a quick note, that this is a compounded growth rate while the annualized returns in my tables are simple and not compounded.
Conclusion
Putting all this information together, my buy price for Southwest Airlines stock is $23.45 per share. Sometimes readers misread my “buy prices” as target prices or predictions about where the stock will trade. They are not. My buy prices are the prices at which I think 1) have a reasonable chance of occurring (reasonable being 10% to 20% chance), 2) have a margin safety, and 3) have a high probability of producing the future returns I want (usually a 15% medium-term CAGR or better). In this article, I’ve shown via history why the buy price has a reasonable chance to hit and also recover in a timely manner, thereby producing the level of returns I’m after. I tend to aim for a bigger margin of safety and higher returns than most investors. However, I think investors with different goals can still use the methodology I shared in the article. If I end up buying this one, I’ll write a follow-up article explaining the method in more detail.
Analyst’s Disclosure: I/we have a beneficial long position in the shares of BRK.B either through stock ownership, options, or other derivatives. I wrote this article myself, and it expresses my own opinions. I am not receiving compensation for it (other than from Seeking Alpha). I have no business relationship with any company whose stock is mentioned in this article.
Seeking Alpha’s Disclosure: Past performance is no guarantee of future results. No recommendation or advice is being given as to whether any investment is suitable for a particular investor. Any views or opinions expressed above may not reflect those of Seeking Alpha as a whole. Seeking Alpha is not a licensed securities dealer, broker or US investment adviser or investment bank. Our analysts are third party authors that include both professional investors and individual investors who may not be licensed or certified by any institute or regulatory body.
If you have found my strategies interesting, useful, or profitable, consider supporting my continued research by joining the Cyclical Investor’s Club. It’s only $40/month, and it’s where I share my latest research and exclusive small-and-midcap ideas. Two-week trials are free.

