Summary:
- Procter & Gamble is a global leader in consumer goods with strong brands, consistent growth, and excellent dividend safety metrics, making it a buy.
- Procter & Gamble’s EPS growth, cost-saving measures, and market dominance support its long-term growth prospects.
- The company’s solid dividend history, strong balance sheet, and high credit rating underscore its financial stability and dividend safety.
- Procter & Gamble has a forward P/E ratio of ~24.4X, suggesting potential for moderate upside despite current market concerns.
RobsonPL
Procter & Gamble is a global leader in branded consumer goods. It has many leading brands and dominant market share. However, it continues to grow by innovating, marketing, and improving productivity. Moreover, the firm is a Dividend King and Aristocrat with excellent dividend safety metrics and consistent growth. I currently view Procter & Gamble as a buy.
Overview of Procter & Gamble
The Procter & Gamble Company (NYSE:PG) was founded in 1837, making it one of the world’s oldest packaged consumer goods brands. Today, the firm produces and sells though five operating segments: Beauty; Grooming; Health Care; Fabric & Home Care; and Baby, Feminine & Family Care. It owns well-known global brands like Pampers, Gillette, Old Spice, Olay, Head & Shoulders, Pantene, Crest, Oral-B, Cascade, Tide, Downy, Mr. Clean, Swiffer, etc. Interbrand lists two of its brands, Pampers, and Gillette, among the top 100 global brands.
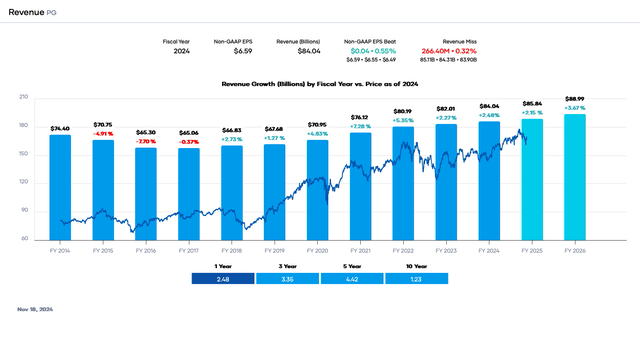
Total revenue was more than $84,039 million in fiscal 2024 and $83,905 million in the last twelve months (“LTM”). The firm’s fiscal year usually ends on June 30th.
Revenue and Earnings Growth
The firm reported mixed first-quarter fiscal year 2025 results on October 18th, 2024, that missed revenue but surpassed earnings per share (“EPS”) estimates.
Revenue decreased about 1% to $21,737 million but missed analyst estimates by a large amount of $240 million, and non-GAAP diluted EPS of $1.93 beat estimates by $0.03 on higher margins, lower expenses, and productivity savings. Importantly, organic sales growth was positive at +2% on organic volume growth of +1%. However, this was flat sequentially and showed a significant slowdown year-over-year. Of the five segments, Beauty performed the worst with a sales decline of -2%, while Baby, Feminine & Family Care had flat sales. The remaining three segments experienced organic sales growth.
As a result, the share price trended down before reversing in early November. That said, the share price has increased ~15.7% year-to-date and ~12% in the last twelve months.
Procter & Gamble Investor Relations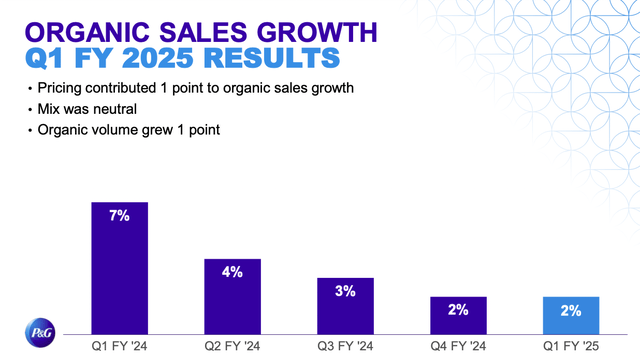
Procter & Gamble’s top line has risen since fiscal year (“FY”) 2017 after experiencing a decline between FY 2014 and FY 2017. The firm operates in a competitive space, but it trimmed roughly 100 brands, focusing on the 65 that account for the great majority of its sales and profits. The strategy was largely successful, as growth returned and market share increased. The 10-year average revenue growth rate is 12%, while the 5-year growth rate is greater at 4.4%, illustrating the approach’s success.
Procter & Gamble’s growth is primarily organic, and because of its size and market dominance, the firm makes few acquisitions. Growth occurs primarily through price increases, greater volumes, more market share, and geographic expansion of brands. Brand extensions and packaging innovation lead to incremental gains fortified by an extensive marketing budget. Additionally, the business model is seemingly not difficult to execute at scale.
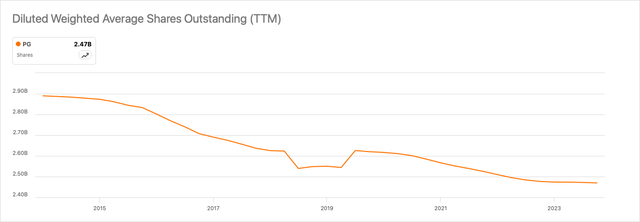
Likewise, EPS has risen in most years in the past decade, except in fiscal 2015 and 2016 when the firm struggled with revenue growth. EPS has climbed faster than revenue because of improving margins and productivity. Procter & Gamble periodically undergoes large cost savings programs. The last one was for $10 billion. The EPS growth is boosted by consistent share repurchases, significantly reducing the share count by approximately 400 million since fiscal year 2014. Consensus estimates are for $6.95 per share in fiscal year 2025, a ~5.5% increase from fiscal 2024. However, the long-term growth average is higher at 7.8% for five years.
Portfolio Insight Seeking Alpha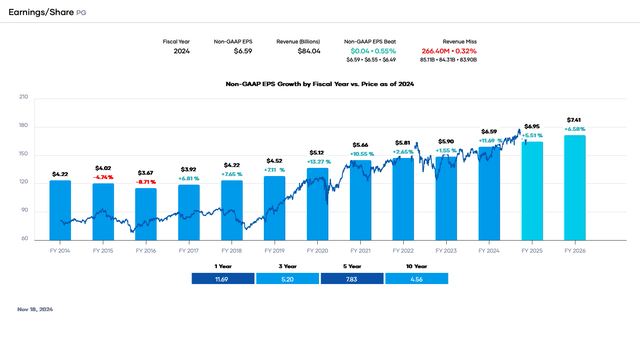
Despite near-term challenges caused by inflation and stressed consumers, Procter & Gamble should continue its slow but steady top and bottom-line growth. The firm’s consistency in generating revenue and EPS growth during good times and bad is remarkable. Moreover, its prodigious free cash flow (“FCF”) allows it to invest in the business while still returning cash to shareholders. That said, continuing economic weakness in China will likely affect the Beauty segment’s sales volumes.
Recent Challenges and Risks
Procter & Gamble’s main challenges are inflation and competition. Inflation directly impacts sales because consumers seek to buy cheaper brands or hold off on purchases altogether. Competition is also a challenge from other branded companies and private-label brands. That said, the firm has fended off competition and increased its market share successfully in the past.
Besides the above issue, Procter & Gamble faces risks from foreign exchange volatility and potential trade wars resulting from tariffs.
Competitive Advantages
Procter & Gamble’s competitive advantage is its brands, scale, and innovation. The firm’s brands are well-known in their respective markets due to years of marketing and brand-building efforts. A new competitor would have to spend vast sums of money to replicate it. The firm spends about $8 billion annually on marketing. Next, Procter & Gamble has a scale that keeps manufacturing, distribution, and other unit costs lower. Lastly, the company spends about 2% to 3% of sales on R&D, which is about $2 billion yearly. Few competitors can match that amount.
Dividend Analysis
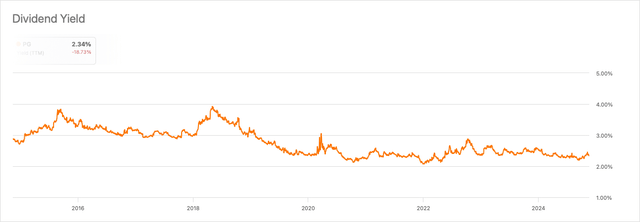
Procter & Gamble’s dividend yield has been relatively constant since the pandemic. The forward yield is around 2.4%, slightly below the 5-year average of 2.45%.
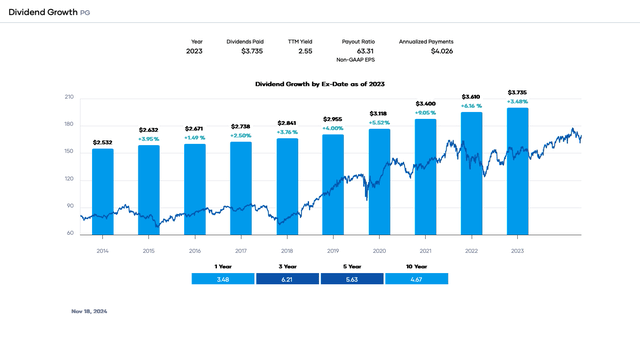
Procter & Gamble is also a Dividend King and Dividend Aristocrat, with a 68-year streak of increases. Because of the ~63% trailing payout ratio, the growth rate is usually in the low-to-mid single digits. The long-term average of roughly 4.7% matches the 10-year EPS rate.
The dividend is supported by solid safety. The forward payout ratio is around 58%, based on an estimated 2025 EPS of $6.95. This value is less than my target of 65%. The firm usually generates in excess of $13 billion in FCF, which easily pays the dividend requirement of $9,467 million. The FCF has usually ranged between $13 billion and $16.5. Assuming an FCF of $15,000 million in this fiscal year gives a dividend-to-FCF ratio of 63%, better than our target percentage of 70%.
Yet another plus is Procter & Gamble’s fortress balance sheet. It carries $10,409 million of short-term and current long-term debt and $25,744 million of long-term debt. It is offset by about $12,156 million in cash and equivalents. However, the leverage ratio is only 1.0X. Procter & Gamble’s historical operational performance and consistency have resulted in the credit rating agencies issuing an AA-/Aa3 high-grade investment grade rating.
Lastly, Procter & Gamble receives an ‘A+’ dividend quality grade from Portfolio Insight, placing it in the 95thpercentile. It measures earnings performance, revenue performance, dividend performance, profitability, and financial strength. At the same time, the Seeking Alpha Quant system gives a ‘B+’ for safety, an ‘A+’ for growth, and an ‘A+’ for consistency.
The bottom line is that Procter & Gamble’s dividend safety is excellent.
Valuation
Procter & Gamble’s share price is up in 2024 but down from its all-time high because of investor fears about inflation, competition, and political risks. However, greater expected EPS in fiscal 2025 and the recent share price weakness have caused the forward price-to-earnings (P/E) ratio to drop to ~24.4X with the 5-year and 10-year ranges.
Analysts estimate the company will earn at least $6.95 per share in fiscal 2025. We will use 23X as a reasonable, fair-value multiple within the 5-year range, accounting for inflation and competition. As a result, our fair value estimate is $159.85. The present share price is ~$169.54, indicating that Procter & Gamble is somewhat overvalued.
Applying a sensitivity calculation using P/E ratios between 22X and 24X, we obtain a fair value range from $152.90 to $166.80. Hence, the stock price is approximately 102% to 111% of the fair value estimate.
Estimated Current Valuation Based On P/E Ratio
|
P/E Ratio |
|||
|
22 |
23 |
24 |
|
|
Estimated Value |
$152.90 |
$159.85 |
$166.80 |
|
% of Estimated Value at Current Stock Price |
111% |
106% |
102% |
Source: Dividend Power Calculations
How does this calculation compare to other valuation models? Portfolio Insight’s blended fair value model, combining the P/E ratio and dividend yield, estimates a fair value of $172 per share. The two-model average is ~$169.93, indicating that Procter & Gamble is fairly valued at the current price.
Wall Street analysts have an average price target of $178.48, 5.27% higher than the current value and more than our two-model average. However, analysts are divided in their ratings with 11 strong buys, four buys, 11 holds, and one sell. In addition, the Seeking Alpha Quant system rating is a hold at 3.28 because of valuation, growth, and earnings revisions. However, the profitability score is an ‘A+’ and the momentum score is a ‘B,’ suggesting the company may surprise to the upside.
Final Thoughts
Procter & Gamble has historically been an outstanding dividend growth investment because of its long-term growth, recession resistance, and consistency. It may well be one of the safest dividend growth stocks. With time, the firm grows slowly and steadily, maintaining strong profitability and FCF. In turn, this permits it to pay an increasing dividend and repurchase shares. The firm is probably fairly valued, but it is rarely undervalued. Because of its reasonable yield, solid dividend safety metrics, balance sheet, and consistent growth, I view Procter & Gamble as a buy.
Analyst’s Disclosure: I/we have a beneficial long position in the shares of PG either through stock ownership, options, or other derivatives. I wrote this article myself, and it expresses my own opinions. I am not receiving compensation for it (other than from Seeking Alpha). I have no business relationship with any company whose stock is mentioned in this article.
Seeking Alpha’s Disclosure: Past performance is no guarantee of future results. No recommendation or advice is being given as to whether any investment is suitable for a particular investor. Any views or opinions expressed above may not reflect those of Seeking Alpha as a whole. Seeking Alpha is not a licensed securities dealer, broker or US investment adviser or investment bank. Our analysts are third party authors that include both professional investors and individual investors who may not be licensed or certified by any institute or regulatory body.
