Summary:
- Prudential Financial offers a yield above 4% which beats key peers, and two quarters of YoY growth in insurance and annuities sales is a positive.
- The firm is among the top 5 in life insurance and has a diversified business model across the scope of life insurance and retirement.
- The valuation presents a mixed picture as the stock is undervalued to key peers on forward P/E but overvalued on EV/EBITDA.
- Downside risk could come from the stock trading well above its 200-day SMA, from investors selling off from the summer lows.
- Recent exposure to hurricane risk in the US will not be an impact since the firm is not a property/casualty insurer.
Joe Hendrickson
A Diversified Financial Firm Trading Above Moving Averages
The seasons are already changing this mid-October so let’s see if my prior bullish call on Prudential Financial (NYSE:PRU) will change too this month.
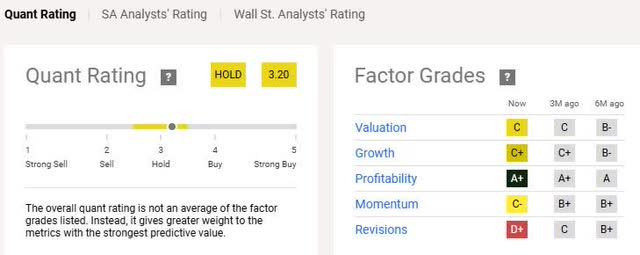
The SA quant system is calling it a hold, a baseline I will jump from today and attempt to get more granular in discussing 5 key factors like valuation, growth, profitability, momentum, and analyst revisions, with emphasis on how these factors could impact this stock in the future.
Prudential, who “provides insurance, investment management, and other financial products and services in the United States and internationally”, according to its SA profile, is currently showing momentum slightly below the S&P500 index in terms of 1 year price return, and besides being up +44% since my initial rating in June 2023, it is also trading about +8.5% above its 200-day SMA.
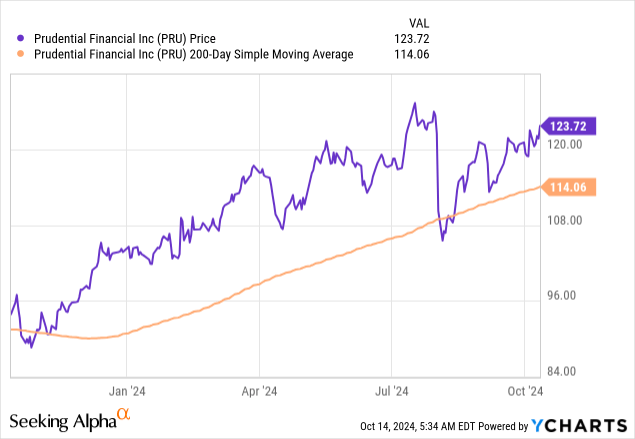
The weakness to current buyers I think this could pose is the effect of prior investors potentially selling off at this price point to take capital gains, considering the huge price spread vs this summer, unless there is adequate support from bullish buyers to keep pushing that price up.
Heading towards Q3 earnings results at the end of this month, the analyst estimates show 9 downward revisions and just 2 upward ones, which I think may keep a lot of current buyers at bay, so this article also hopes to uncover what could be driving those revisions and whether a buy at this juncture is still justified.
Q2 Saw Top & Bottom Line Growth
Let’s jump into talking briefly about its Q2 results reported back in August. We can see from the income statement that top-line revenue grew on a YoY basis to $14.88B (when comparing quarters ending June 2024 vs June 2023).
Net income also grew YoY to $1.19B, despite a YoY jump in policy benefit payouts.
The income statement data gives me a framework to understand what drivers impact the top-line as well as the bottom-line. For instance, nearly 60% of top-line revenue is coming from insurance/annuity premiums, while about 32% comes from interest/dividends on assets, and only about 7% comes from asset management fees.
So, when thinking about future growth, I am looking for current or recent growth in new insurance and annuities policies since this could drive future premiums which are this firm’s biggest revenue driver. The 2nd biggest revenue driver, the asset portfolio, is impacted by interest rates, so I would keep an eye on Fed rate decisions since it impacts future interest income but also bond values.
On the cost side, a major impact comes from policy benefits paid out, and since Prudential is not primarily a property/casualty insurer but more of a life insurer, I am looking if there are any seasonal spikes in such benefit payouts. It appears from the income statement that the quarters ending March (Jan – March) have seen a spike in benefits at the end of the winter period typically.
In his Q2 remarks, the firm’s CEO Charles Lowrey said the following which highlights the firm’s diversified business model:
Our fundamentals are strong, supported by our financial strength and our integrated investment, insurance, and retirement capabilities that fuel our growth. Prudential is well positioned to address the growing needs of our customers around the world with solutions and products that help them protect their life’s work and live better lives, longer.
From the income statement data, we can see all of the major revenue drivers grew on a YoY basis, and in the next section I discuss some of my forward-looking views.
Future Potential: Multi-Segment Revenue Drivers
To gauge this firm’s future potential, let’s take a look at Q2 growth in sales in its core business of life insurance, since I showed earlier how insurance premiums have the biggest impact to this firm’s top-line revenue, and I mentioned that an insurance policy sold today can contribute to future revenue flows tomorrow rather than being a one-time purchase, since policyholders have to keep paying premiums more than just once usually.
For one, in Q2 results we can see the “individual” life segment overall saw YoY growth in sales across all three subsegments (variable, universal, term life).
I think this could be a driver of future insurance premiums revenue because assuming the majority of these new policyholders stay with Prudential it could drive future premiums for the firm in the insurance segment.
Prudential – individual life sales (company Q2 presentation)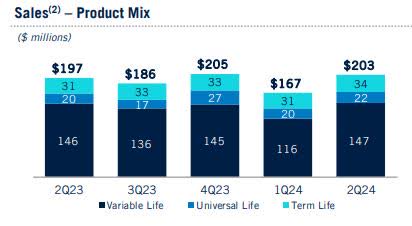
In these categories (variable, universal, term life) of insurance the YoY growth was not a one-time event, since I saw YoY growth in their Q1 results too, across these same 3 categories:
PRU – q1 YoY insurance growth (company q1 results)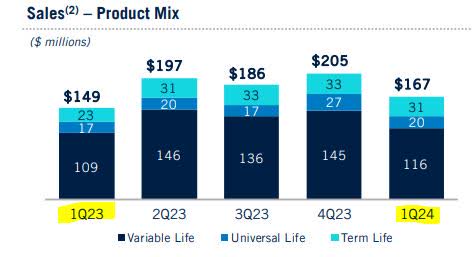
Further, the firm’s Gibraltar Life segment also has seen YoY growth in sales in Q2, and the sales are coming from multiple channels (independent agents, consultants, banks), which is a sign of Prudential’s vast distribution capacity.
This segment too could then contribute to growth in future premiums revenue for this reason.. growth in recent policy sales.
Prudential – Gibraltar Life sales (company Q2 presentation)
In addition, besides individual insurance, in the “group” life insurance segment the company in their Q2 results said that “year-to-date sales of $424 million increased 13% from prior year-to-date, driven by growth in group life, disability, and supplemental health.”
The firm’s CEO even struck a positive tone in his Q2 comments:
In the second quarter, we continued to see positive momentum across our businesses, driven by robust sales in our U.S. and International Businesses.
One cannot ignore another major business of Prudential, and that is retirement strategies. According to the firm’s Q2 presentation, we can see positive net flow of monies to Prudential on a YoY basis, which I think could drive future revenue in this segment through fees.
Prudential – retirement strategies (company Q2 presentation)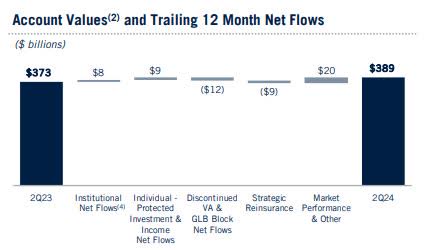
This is further testament to this being a highly diversified firm, that goes beyond just selling traditional life insurance plans.
Finally, I think it’s important to mention again the role of benefit payouts as they can impact future earnings. Knowing that Prudential can be exposed to seasonal swings in life insurance payouts, we also know that as primarily a life insurer they are not exposed to property/casualty claims, and with that said I don’t expect future earnings to be impacted by payouts related to major weather events like we saw recently with Hurricane Milton in the US.
Echoing this viewpoint is an Oct. 9th article on Prudential from Investors Business Daily:
The insurer is expected to face little direct exposure to the aftermath of Hurricane Milton since it doesn’t offer property insurance. Meanwhile, a number of other property insurers could experience significant volatility to their stocks from the storm.
Key Market Role in Life Insurance & Annuities
In terms of Prudential’s market share and positioning vs competitors, in the life insurance segment itself it was listed by financial website Bankrate (updated Oct. 2024) as #4 in the US, with New York Life taking the top spot. A June 2024 article from Investopedia also placed Prudential at the fourth spot with 5.64% market share (as of 2023).
I also want to highlight the popularity of annuities products (which is not the same as a life insurance policy) and the tailwind this industry has seen in this regard, which I think has positively impacted Prudential and will continue doing so.
For instance, S&P Global reported back in June that “the Prudential Insurance Company of America led the US life industry in both group annuity and total-filed direct premiums and considerations, propelled by pension risk transfer transactions.”
Further, back in March an article from life insurance trade association LIMRA pointed to the following data:
For the second consecutive year, annuity sales have surpassed previously held records, largely due to broader engagement with independent distribution. Rising interest rates have made annuities very attractive to a larger group of investors who are served by independent advisors and broker dealers.
So, I think the continued appeal of annuities due to their role as an income source could continue propelling business for Prudential in the future, and that is also good for its future share price.
Since the data makes mention of rising interest rates as an appeal to invest in annuities, I think it will take a series of Fed rate cuts before we see any serious reduction in interest rates across the board. It does not change the fact that an annuity product can provide income, while a life insurance policy is a death benefit payout, so annuities I think will continue to have appeal as a potential income-producing investment. This is Prudential’s opportunity to grow and eat up market share.
Net Income Margin Trailing Behind Key Peers
Using peer data, the following worksheet I created compares the net income margin of Prudential vs 4 peers: Equitable (EQH), MetLife (MET), Aflac (AFL), and Sun Life Financial (SLF). I picked these 4 peers in order to get more granular than simply comparing to the overall sector which is broad, as these 4 firms have robust life insurance businesses like Prudential.
I consider this net income margin a fundamental business metric as an indicator of what percent of revenue the company is keeping after expenses.
PRU – net income margin vs peers (author worksheet)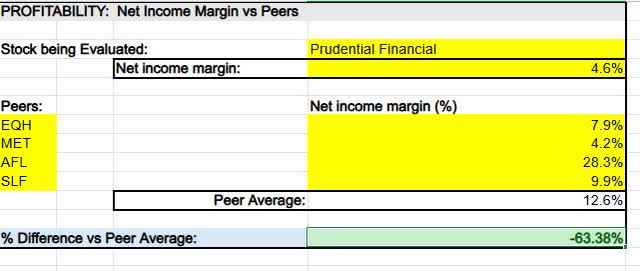
From the data I compiled above on net income margin, we can see that Prudential trails behind the key peer average by over 63%, which I think could be an indicator of an ineffective cost structure and should matter to investors when thinking about what this stock could do in the future, particularly since 3 key peers with similar product lines have a much better profit margin.
What I’ll be looking for in Q3 and Q4 management remarks, therefore, is what steps they are taking to reduce costs, for example, as I think this is a weakness that could contribute to further analyst hesitation on this stock.
4.2% Dividend Yield Beats Key Peers, While Dividend a Proven Grower
For many investors whose goal may be dividend income, I wanted to include this section to highlight some interesting points about Prudential.
For instance, its dividend yield sits at +4.2%, with a quarterly payout of $1.30/quarter.
Comparing the yield to its 4 key peers mentioned earlier, here is what I found:
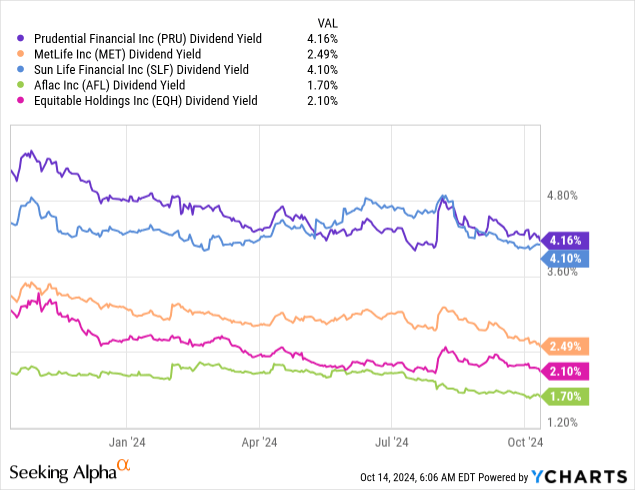
From the data, we can see that Prudential beats all 4 key peers on dividend yield, which tells me as a investor I can get a better return from dividend income buying PRU right now than from these peers.
Further, in terms of proven dividend growth, when looking at growth data for 10 years it is evident that Prudential has consistently and steadily grown dividends every year.
Though that is not a guarantee of future dividends, the case can be made that there is a stronger probability of continued dividend sustainability and growth looking ahead, supported by expected earnings growth I mentioned earlier.
This should add confidence to dividend-income investors who may be thinking to add Prudential to their dividend portfolio, particularly at a yield above 4%.
Small Debt-to-Equity Ratio & Huge Asset Portfolio
Now we’ve come to talk about some more risk topics and two that come to mind for a financial-sector firm like this is their debt, capital, and liquidity situation.
To keep it simple, here is their debt-to-equity ratio vs the 4 key peers:
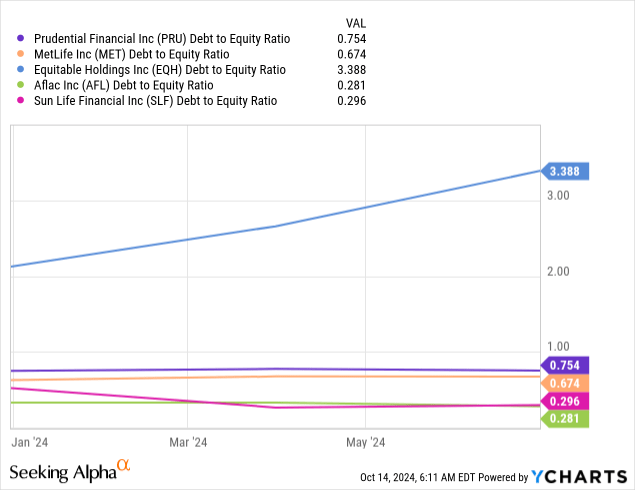
With a DTE ratio of just 0.75, Prudential is in line with several peers on the low end of the scale, as the chart shows, which I think is a positive strength.
However, another debt-related metric to consider is long-term debt since it creates interest-expense obligations for the firm, and from balance sheet data we see that LT debt has grown YoY to $26.5B.
At the same time, I would point out that the firm boasts of $4.4B of “highly liquid” assets, according to its Q2 presentation, “AA” rated capital strength, and a diversified investment portfolio.
Unlike a manufacturing business, whose largest asset class may be property/plant/equipment, we can see from Prudential’s balance sheet that its biggest asset is +$311B worth of debt securities, which is significant because the firm can earn interest income on such assets. However, if they are highly liquid and available for sale securities then the firm can sell them if needed to raise cash, though sometimes this could incur a capital loss.
I would not expect a firm to be able to sell a factory as quickly as they can a fixed-income asset like a bond, for example, if cash needs to be raised.
Now that we have an indication that this firm has a relatively low debt-to-equity in the context of its peer group, along with a large book of liquid assets, next let’s have a closer look at the risk exposure of their investment portfolio.
Asset Risk Exposure: Could Be Impacted by Fed Rate Decisions
Here is a look at the firm’s asset portfolio, from their Q2 presentation:
Prudential – asset portfolio (Prudential)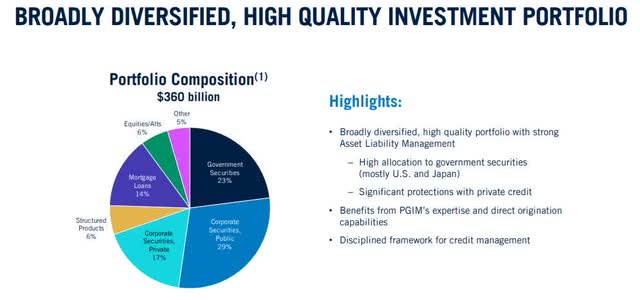
This portfolio the firm touts as broadly diversified seems to have almost 1/4th exposure to government securities, and almost 1/3rd to corporate fixed-income securities, while only 6% in equities.
I think that could expose this firm to greater interest-rate risk and Fed rate decisions, as falling interest rates could boost underlying bond values but also can drive interest income down as well, impacting future revenue. A more balanced asset portfolio in my opinion would have more exposure to dividend-paying equities and somewhat less in fixed-income.
What we know, and I have highlighted in the last few articles, is the Fed cut its target interest rate last month, and CME Fedwatch shows an over +95% probability of further cuts in November, setting the stage for what could be a period of extended interest rate declines after the heights of the last few years. This I think could boost the value of bonds in the heavily fixed-income driven portfolio, due to inverse relationship between interest rates and bond values.
One cannot ignore the portfolio’s 14% exposure to mortgage loans, so taking a closer look it seems that it is mostly tied to industrial or apartment properties, and less than 2% of it is exposed to office property, which in the last year has had many articles written about it due to the risk of holding office loans. For example, Inc Magazine wrote back in February that “billions in defaults now looking more likely.”
Prudential – mortgage loans (company q2 presentation)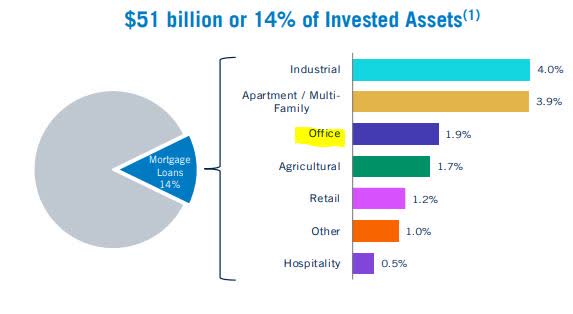
A Mixed Valuation Picture vs Key Peers
Earlier I mentioned the stock is trading well above its moving average, but in addition to that I want to discuss valuation too and the two metrics to use will be comparing the forward P/E ratio and the EV/EBITDA to peers.
First, here is a look at the fwd P/E ratio vs the 4 key peers:
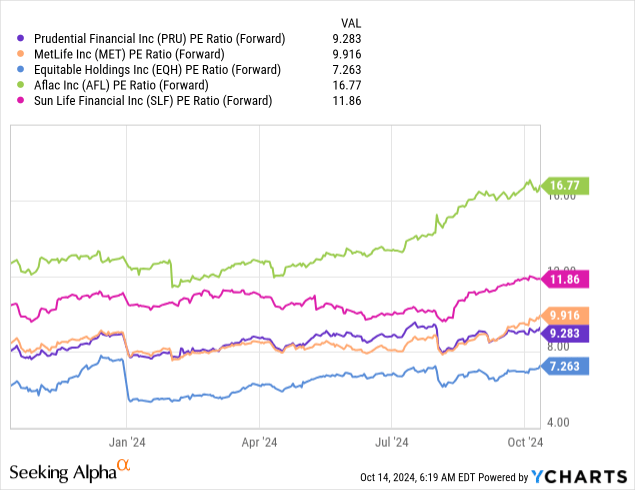
Using that data, I created the following worksheet:
PRU – fwd PE vs peers avg (author worksheet)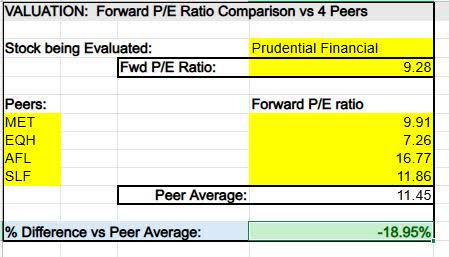
We can see from this study that Prudential is nearly 19% undervalued to this peer average when it comes to forward earnings multiples, and indicator that the market is less confident about future earnings potential, despite the fact that analyst consensus estimates call for YoY EPS growth of nearly 15% at the end of this fiscal year.
Further, from peer data available on SA we can compare the trailing EV/EBITDA as follows:
PRU – ev to ebitda vs peers (author worksheet)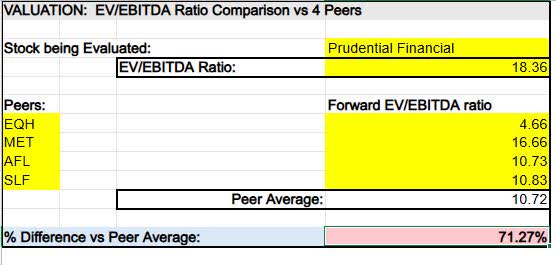
From this worksheet I made, the story it tells is that Prudential’s EV/EBITDA (TTM) is over 71% above this peer average, and indicating that the enterprise value is 18x the EBITDA for this firm.
According to Nasdaq, “As with P/E, a lower EV/EBITDA ratio than the average for the market and/or the particular industry in which a company operates is considered to indicate that the stock is probably undervalued.”
So, in this case Prudential stock is undervalued on forward earnings multiples but overvalued on EBITDA, presenting a mixed picture when it comes to valuation of this stock.
Risk Score: Low
Using a risk chart I created, here is a brief recap of 3 potential downside risks I mentioned in today’s article and their probability/impact to this firm.
PRU – risk chart (author worksheet)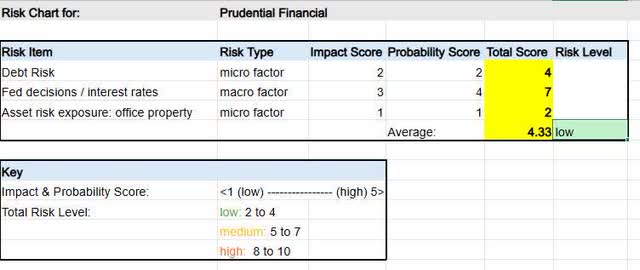
From this risk chart, I determined the risk profile for this firm is low. The contributing factors to this risk score are their low debt-to-equity ratio and low exposure to riskier office property assets, while a factor that could increase risk is interest rate exposure and Fed decisions.. as it can impact both the income received on the firm’s fixed-income portfolio but also the value of underlying bonds. Fed decisions also are an external factor outside the firm’s control or management, yet can have an impact.
Wrap Up SWOT Analysis: Bullish Rating Reaffirmed
To bring it all together for today’s discussion, here is my SWOT analysis which visualizes my research outcomes today:
PRU – Swot analysis updated (author worksheet)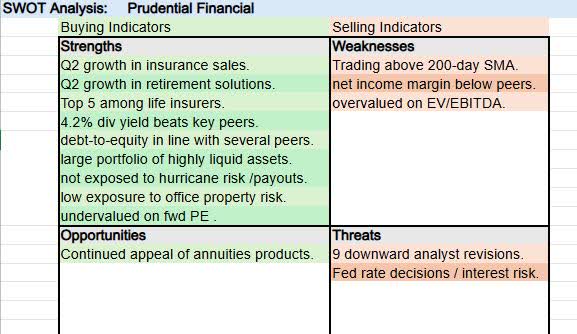
From this SWOT, there are 10 buying indicators (strengths and opportunities) vs 5 selling indicators (weaknesses and threats) which I’ve evidenced through examples in today’s article.
Hence, my conviction is to reaffirm my earlier buy rating on this stock again and disagree with the SA quant system this time.
I am convinced that the 9 downward analyst revisions are a contributing factor as to why one may be cautious right now, and are driven by some of the weaknesses and threats I mentioned above, however fundamentally it remains a great dividend-income opportunity with further upside potential in a long-term sense.
Analyst’s Disclosure: I/we have no stock, option or similar derivative position in any of the companies mentioned, and no plans to initiate any such positions within the next 72 hours. I wrote this article myself, and it expresses my own opinions. I am not receiving compensation for it (other than from Seeking Alpha). I have no business relationship with any company whose stock is mentioned in this article.
Seeking Alpha’s Disclosure: Past performance is no guarantee of future results. No recommendation or advice is being given as to whether any investment is suitable for a particular investor. Any views or opinions expressed above may not reflect those of Seeking Alpha as a whole. Seeking Alpha is not a licensed securities dealer, broker or US investment adviser or investment bank. Our analysts are third party authors that include both professional investors and individual investors who may not be licensed or certified by any institute or regulatory body.

