
Summary:
- Qualcomm’s diversification strategy is showing positive signs, with growth in the Automotive and IoT segments outpacing the Handset segment.
- Despite concentrated geographic revenue exposure and customer concentration, this exposure may still benefit margins through rising QCT exposure.
- The company faces short-term growth headwinds in 2024, but significant growth potential is seen in IoT and Automotive segments, driving long-term revenue growth.
AutumnSkyPhotography
In our previous analysis, of Qualcomm Incorporated (NASDAQ:QCOM), we highlighted its Automotive segment with an increasing market share of 28% market share in 2023 and a 24.8% growth rate driven by the positive market outlook and increased automaker customers. We believe the company’s Snapdragon Digital Chassis platform leads in terms of product breadth and performance, and we expect it to outpace the market growth with a CAGR of 28.1%.
In this analysis, we revisited Qualcomm, focusing on its diversification strategy. According to Qualcomm’s CEO, this strategy is proving effective. However, the company’s revenue growth in H1 2024 fell short of our full-year expectations, achieving a growth rate of 3.9% YoY compared to our previous projection of 13.64%. Thus, we examined whether the company is successfully executing its diversification strategy and its potential for future success. Currently, 67% of Qualcomm’s revenue comes from its Handset segment, while 33% is from its non-Handset segment. Firstly, we compared the growth rates of the handset and non-handset segments to assess the effectiveness of Qualcomm’s diversification strategy. We also evaluated the benefits of diversification beyond growth, considering factors such as geographic breakdown, customer concentration, and profitability margins. Next, we explored the significance of diversification for Qualcomm’s growth outlook and the sustainability of its Handset segment by evaluating Qualcomm’s competitiveness in the smartphone application processor (AP) market. Finally, we focused on Qualcomm’s IoT and Automotive segments to determine their potential to drive long-term growth and become significant contributors to overall company growth. We updated and analyzed the breakdown of its IoT segments and assessed the growth prospects of new IoT developments, such as AI PC processors (NPUs) by comparing them with Intel and AMD, AR/VR market specifications with competitors like Apple, and WiFi specifications with competitors. We used these comparisons to forecast Qualcomm’s market growth potential.
Benefits of Diversification Strategy
Based on Qualcomm’s annual report, the company’s diversification strategy represents its push to diversify its main handset business segment and expand into markets beyond mobile handsets. The company highlighted an increasing portion of sales derived from segments besides mobile handsets, especially automotive and IoT. We analyzed whether it is achieving its diversification strategy by comparing the company’s revenue breakdown and growth performance. Furthermore, we also examined whether its diversification strategy benefits the company in factors such as geographic breakdown, customer concentration and profitability margins.
We first compiled the company’s revenue breakdown over the past 4 years with its latest results up to H1 FY2024 and each segment’s growth performance.
Product Segments
Company Data, Khaveen Investments
|
Qualcomm Revenue Segment Breakdown ($ bln) |
2020 |
2021 |
2022 |
2023 |
H1 2024 |
Average 4Y |
|
Handset |
12,533 |
20,477 |
28,825 |
22,570 |
12,867 |
|
|
Growth % YoY |
13.0% |
63.4% |
40.8% |
-21.7% |
8.5% |
23.9% |
|
Automotive |
714 |
1,098 |
1,500 |
1,872 |
1,201 |
|
|
Growth % YoY |
4.4% |
53.8% |
36.6% |
24.8% |
33.0% |
29.9% |
|
IoT |
3,246 |
5,443 |
7,351 |
5,940 |
2,381 |
|
|
Growth % YoY |
13.3% |
67.7% |
35.1% |
-19.2% |
-22.5% |
24.2% |
|
QTL |
5,028 |
6,320 |
6,358 |
5,306 |
2,778 |
|
|
Growth % YoY |
9.5% |
25.7% |
0.6% |
-16.5% |
10.2% |
4.8% |
|
QSI |
36 |
45 |
31 |
28 |
16 |
|
|
Growth % YoY |
-76.3% |
25.0% |
-31.1% |
-9.7% |
14.3% |
-23.0% |
|
Reconciling items |
1,974 |
182 |
134 |
104 |
81 |
|
|
Total |
23,531 |
33,566 |
44,200 |
35,820 |
19,324 |
|
|
Growth % YoY |
-3.1% |
42.6% |
31.7% |
-19.0% |
3.9% |
13.1% |
Source: Company Data, Khaveen Investments
Based on the chart and table above, the company’s Handset segment continues to remain its largest segment accounting for 66.9% of revenue in H1 2024 and has increased by 5% over the past 5 years, therefore indicating the company still has a strong dependency on the Handset segment.
However, its QTL segment’s share of revenue, which relates to licensing revenue for the rights to use its chips, had declined by 9% over the period. In our past analyses, we highlighted the struggles the company had been having with Apple (AAPL) over licensing fees as the companies were embroiled in legal battles with Apple alleging the company charging excessive licensing fees and had withheld paying the company fees until a settlement in 2019 where Apple would continue licensing Qualcomm chips for 6 years, but the payment terms of the deal were undisclosed, and we believe this may have been unfavorable to Qualcomm given the lackluster growth performance.
Its Automotive segment now accounts for 6% of total revenues, which is still low and is its second-smallest segment besides QSI. However, the automotive segment has the strongest growth with the highest average among its segments of 30% and grew positively in double digits every year in the past 4 years and accelerated in H1 2024. In our previous analysis, we highlighted the company’s market share gain strength in the automotive ADAS SoC market with competitive advantages in terms of product breadth and performance with its Snapdragon Digital Chassis platform, and projecting it to outperform the market CAGR of 18.7% by a factor of 1.5x for a total growth of 28.1% which is fairly in line with its H1 performance.
In IoT, however, the segment share of revenue had increased slightly by 1.8% to 2023 but declined in H1 2024 as its performance continued to remain weak compared to the other segments, which outpaced its growth as we previously highlighted the segment “experienced elevated channel inventory due to decreased demand influenced by broader macroeconomic weakness” according to management. Besides, management also stated from its earnings briefing, that its IoT segment caters to various end-market applications such as consumer and industrial networking. In our previous analysis, we highlighted the slowdown in industrial activity impacting DAO chipmakers in the industrial market.
Overall, we believe Qualcomm has become more diversified over the past 4 years due to the increasing % share of revenue in both Automotive and IoT segments. From 2019 to 2023, the Automotive segment grew from 3.5% to 5.2% of revenue, whereas the IoT segment grew from 14.8% to 16.6% of revenue respectively. We believe this is positive for Qualcomm with the increased exposure to the Automotive and IoT segments due to the higher average growth of both segments compared to the Handset segment (23.9%) and the company’s total average revenue growth (13.1%).
Geographic Revenue
To determine whether Qualcomm’s diversification strategy benefits the company in terms of geographic diversification, we examined its revenue breakdown below.
|
Qualcomm Revenue Geographic Breakdown ($ bln) |
2020 |
2021 |
2022 |
2023 |
Average |
|
China (including HK) |
14,001 |
22,512 |
28,119 |
22,382 |
|
|
Growth % YoY |
20.6% |
60.8% |
24.9% |
-20.4% |
21% |
|
Vietnam |
0 |
3,114 |
6,063 |
4,551 |
|
|
Growth % YoY |
– |
– |
94.7% |
-24.9% |
35% |
|
South Korea |
2,964 |
2,368 |
3,164 |
3,272 |
|
|
Growth % YoY |
23.5% |
-20.1% |
33.6% |
3.4% |
10% |
|
United States |
1,129 |
1,406 |
1,482 |
1,259 |
|
|
Growth % YoY |
-59.3% |
24.5% |
5.4% |
-15.0% |
-11% |
|
Others |
5,437 |
4,166 |
5,372 |
4,356 |
|
|
Growth % YoY |
-27.4% |
-23.4% |
28.9% |
-18.9% |
-10% |
|
Total |
23,531 |
33,566 |
44,200 |
35,820 |
|
|
Growth % YoY |
-3.1% |
42.6% |
31.7% |
-19.0% |
13% |
Source: Company Data, Khaveen Investments
Company Data, Khaveen Investments
According to its annual report, the company records revenues based on the location where the company’s products are delivered. From the table, China represents its largest geographic segment, accounting for 62% of revenues in 2023 and had increased from 59.5% in 2020. In 2019, its China revenues were affected by a dispute with Huawei over licensing fees and had not recorded any licensing revenues from Huawei in the fourth quarter of that financial year based on its 2019 annual report. At the same time, the company also recorded a revenue gain of $4.7 bln following its settlement with Apple for licensing fees in 2019, which was recorded in its US and Other segments.
Furthermore, its revenues to Vietnam grew the strongest, and accounts for 12.7% of its total revenue, its second-largest region, rising from 9% in 2021 and was previously undisclosed before 2021. We believe this is because the company’s smartphone customers, such as Samsung (OTCPK:SSNLF) and Apple manufacture their smartphones in Vietnam with Apple expanding production in the country in 2022. Moreover, the remaining smaller segments, Korea, the US and Others had underperformed.
Overall, we believe the company’s revenue based on geographic breakdown has not become more diversified due to the high share of revenues from China and Vietnam. From 2019 to 2023, China grew from 48% to 62% of revenue whereas from 2021 to 2023, Vietnam grew from 9% to 13% of revenue, highlighting higher geographic concentration of revenue. However, we believe the higher exposure to China and Vietnam is better for Qualcomm, as the average revenue growth rate from China and Vietnam grew 21% and 35% respectively while the US and Others contracted growth of around -10% and South Korea grew only 10%.
Customer Concentration
Furthermore, to determine whether the company’s diversification strategy benefits the company in terms of customer concentration, we examined the company’s top customer revenue contribution from its annual report below.
|
Customer Revenue % Total Revenue |
2019 |
2020 |
2021 |
2022 |
2023 |
|
Customer (w) |
24% |
19% |
23% |
21% |
27% |
|
Customer (w) Revenue ($ mln) |
4,652 |
4,096 |
7,678 |
9,254 |
9,643 |
|
Growth % |
-11.9% |
87.5% |
20.5% |
4.2% |
|
|
Customer (x) |
15% |
10% |
14% |
21% |
21% |
|
Customer (x) Revenue ($ mln) |
2,907 |
2,156 |
4,674 |
9,254 |
7,500 |
|
Growth % |
-25.9% |
116.8% |
98.0% |
-18.9% |
|
|
Customer (y) |
10% |
12% |
13% |
<10% |
<10% |
|
Customer (y) (Maximum Revenue) |
1,938 |
2,587 |
4,340 |
4,407 |
3,572 |
|
Growth % |
33.5% |
67.8% |
1.5% |
-18.9% |
|
|
Customer (z) |
<10% |
10% |
<10% |
<10% |
N/A |
|
Customer (z) (Maximum Revenue) |
1,938 |
2,156 |
3,338 |
4,407 |
N/A |
|
Growth % |
11.2% |
54.9% |
32.0% |
-100% |
|
|
Total Revenue % (Maximum) |
59% |
51% |
60% |
62% |
58% |
|
Total Revenue ($ mln) (Maximum) |
11,435 |
10,994 |
20,033 |
27,322 |
20,715 |
|
Growth % |
-4% |
82% |
36% |
-24% |
|
|
Qualcomm Total Revenue Growth % |
-3.06% |
42.65% |
31.68% |
-18.96% |
Source: Company Data, Khaveen Investments
Based on the table above, the company’s revenue concentration from its top 4 undisclosed customers in total appears to remain fairly stable between 51% to 62%. However, its customer ‘w’, its largest customer’s share of revenue had increased from slightly to 27% in 2023, the highest over the period, while its second-largest customer (customer ‘x’) also shows a stable rise to 21% of revenue in 2023. Whereas customer ‘y’ share of revenue decreased to below 10% in 2023 and the customer ‘z’ share of revenue was not mentioned. We believe Customer ‘z’ could likely be Huawei following the revocation of its license to export chips by the US government to Huawei and management recently confirming that Huawei no longer purchasing its chips, which may have led to the rise in customer revenue concentration of the top 2 customers. Additionally, we believe two of the top customers for the company are Apple and Samsung. Furthermore, we believe the customer could be the other top smartphone makers such as Vivo, Oppo, Xiaomi (OTCPK:XIACF) or Lenovo (OTCPK:LNVGY).
Overall, we believe the top 4 company’s customers are related primarily to the Handset segment which includes Apple, Samsung, and Huawei before it stops purchasing chips from Qualcomm, thus a lower total revenue contribution would indicate an improving customer concentration level for the company. However, our analysis shows its top 4 customers revenue contribution continues to remain high at 58% of revenues, though is 1% lower compared to 2019, thus indicating its diversification strategy had not had a significant impact on improving the company’s customer concentration level. That said, we believe the exposure of the top 4 customers is beneficial for Qualcomm as the average growth rate for the top 4 customers is 22.6% whereas the average growth rate for Qualcomm was 13.1%, suggesting that the top 4 customers were significantly contributing to Qualcomm’s revenue growth for the past 4 years.
Profitability
Moreover, to determine whether the company’s diversification strategy benefits the company in terms of profitability, we examined the company’s segment EBT Margin.
|
EBT by Segment ($ mln) |
2019 |
2020 |
2021 |
2022 |
2023 |
Average |
|
QCT EBT |
2,143 |
2,763 |
7,763 |
12,837 |
7,924 |
|
|
QCT EBT Margin |
15% |
17% |
29% |
34% |
26% |
24% |
|
QCT Revenue |
14,639 |
16,493 |
27,019 |
37,677 |
30,382 |
|
|
QCT Revenue % Total Revenue (excl reconciliation items) |
76% |
77% |
81% |
86% |
85% |
81% |
|
QTL EBT |
2,954 |
3,442 |
4,627 |
4,628 |
3,628 |
|
|
QTL EBT Margin |
64% |
68% |
73% |
73% |
68% |
69% |
|
QTL Revenue |
4,591 |
5,028 |
6,320 |
6,358 |
5,306 |
|
|
QTL Revenue % Total Revenue (excl reconciliation items) |
24% |
23% |
19% |
14% |
15% |
19% |
|
QSI EBT |
344 |
-11 |
916 |
-279 |
-12 |
|
|
QSI EBT Margin |
226% |
-31% |
2036% |
-900% |
-43% |
258% |
|
QSI Revenue |
100 |
152 |
36 |
45 |
31 |
|
|
QSI Revenue % Total Revenue (excl reconciliation items) |
0.4% |
0.8% |
0.2% |
0.1% |
0.1% |
0.2% |
|
Total EBT |
5,441 |
6,194 |
13,306 |
17,186 |
11,540 |
|
|
Company EBIT Margin |
33% |
26% |
29% |
33% |
24% |
29% |
Source: Company Data, Khaveen Investments
Based on the table above, the company’s QCT segment’s operating margins, which includes Handset, IoT, and Automotive segments, have been rising over the past 5 years from 15% in 2019 to 26% in 2023, which may indicate higher margin for the company’s IoT and Automotive segments which had been outpacing the growth of the Handset segment. We believe that the smartphone market is maturing and is highly competitive with low average profit margins for the smartphone makers as covered in our past analyses. However, the company’s QTL segments are superior and stable compared to its QCT margin because the QTL segment licenses Qualcomm’s IP portfolio and is a Service, and thereby does not have direct production costs. Despite QTL’s superior margins, QTL’s share of revenue has been decreasing from 2019 to 2023, from 24% to 15% due to QTL’s lower growth rate.
Therefore, we believe this indicates QCT segment growth is more sustainable than QTL as QCT’s average revenue growth rate was higher (24%) and share of revenue grew from 76% in 2019 to 85% in 2023, whereas we believe QTL segment revenue growth could be less sustainable due to the dispute between Qualcomm and customers over its licensing fees practices. Additionally, management highlighted that “there is a cap on the total ASPs up to which the royalty rates, the percent royalty rate applies”, indicating a limit to its growth. Moreover, the QSI segment margin was highly volatile but insignificant as it represents a very small portion of revenue. Overall, the company’s operating margin decreased over the period despite the rise in the QCT operating margin, as the QTL segment’s share of revenue declined and weighed on its total operating margin due to its much higher margin compared to QCT.
Overall, while QTL’s margin is higher compared to QCT, we believe the diversification strategy is positive for the company as we believe that QCT’s segment growth would be more sustainable, compared to its QTL segment with an average past growth (24%) that is nearly 5x higher compared the QTL segment (5%).
Conclusion
Overall, we believe the company’s diversification strategy shows progress with the increasing share of IoT and Automotive revenues. We believe this is positive for the company’s growth with the higher exposure in these segments, as the Automotive and IoT segments have grown faster than Handset revenues. Despite this, Handset remains the dominant segment, accounting for 63% of total revenue, while Automotive and IoT contribute 5% and 17% respectively. Geographically, we determined the company has not become more diversified as China remains the largest region, which is unsurprising given China’s role as a major global manufacturing hub. Despite that, we believe its exposure to its two largest geographic regions (China and Vietnam) is positive for the company’s growth as it has grown significantly by an average of 21% and 35% respectively, higher than all other segments and its total company growth. Furthermore, we believe the company’s diversification has not improved its customer concentration with top customers still accounting for 58% of revenues, down just 1% since 2019. However, we believe this high exposure to top customers is beneficial, as their average growth rate is 22.6%, compared to Qualcomm’s overall 13.1%. Finally, while the company’s total operating margin has not improved due to declining QTL revenues, the QCT segment’s operating margins have increased, which, we believe, is due to the growth of the IoT and Automotive segments compared to Handset. We believe the diversification strategy is positive for the company as we believe the QCT’s segment growth to be more sustainable compared to its QTL segment with an average past growth (24%) that is nearly 5x higher compared to the QTL segment (5%).
Qualcomm Smartphone AP Outlook and Competitiveness
Moreover, we then examined why there is diversification significant to Qualcomm’s growth outlook and the sustainability of its Handset segment growth outlook by determining if Qualcomm is still competitive in the smartphone AP market by comparing its AP capabilities.
Stagnant Smartphone Market Growth
|
Smartphone Market Projections (‘mln’) |
2019 |
2020 |
2021 |
2022 |
2023F |
2024F |
2025F |
2026F |
2027F |
Average |
|
Total Unit Shipments |
1,371 |
1,293 |
1,353 |
1,202 |
1,158 |
1,127 |
1,102 |
1,084 |
1,042 |
|
|
Growth % |
-2.40% |
-5.70% |
4.60% |
-11.10% |
-3.60% |
-2.70% |
-2.20% |
-1.70% |
-3.80% |
-2.80% |
Source: Company Data, Khaveen Investments
We summarized our previous analysis of our outlook of the smartphone market in Apple where we analyzed the slowing smartphone market over the past 10 years “which indicates it is a maturing market and is attributed to factors such as the increasing average life of smartphones due to reasons such as lack of consumer appeal to new upgrades and longer software update support for old phones”. Additionally, we projected the smartphone market shipment growth using our model which factors in population growth, smartphone penetration rate and replacement rate, for a total of 5-year average forward growth of -2.8%. Moreover, the average smartphone price is only projected to grow at a CAGR of 6.3% through 2028. Therefore, we believe this does not bode well for Qualcomm’s growth outlook in the Handset segment.
Competitiveness
Furthermore, we compiled the company’s market share in the smartphone AP market for the past 5 years to determine if Qualcomm’s market share had changed and to analyze the underlying reasons behind such changes. To determine Qualcomm’s market share, we calculated Qualcomm’s chipset shipments relative to the global smartphone chipset and compared Qualcomm’s shipments to its 2 closest competitors by shipments, including MediaTek and UNISOC.
IDC, Counterpoint Research, Khaveen Investments
Based on the chart, Qualcomm’s unit market share of the smartphone chipset has been consistently declining every year, from a high of 43.8% in 2020 to 35.4% in 2023. Furthermore, Qualcomm’s competitor, UNISOC had been rapidly increasing its market share from a low of 6.5% in 2020 to a high of 16.4% in 2023, representing a 9.9% increase in smartphone shipment market share, the largest among the 3 main competitors by smartphone chipset shipments. MediaTek also gained market share in Q1 2024 after stagnating over the past periods. In 2023, MediaTek’s flagship Dimensity 9000 series achieved revenue surpassing $1 bln and secured design wins with major smartphone makers (Vivo, Oppo, Xiaomi, and Redmi). Therefore, we believe this indicates Qualcomm’s eroding competitiveness in the smartphone AP market.
Furthermore, we compiled and compared the company’s smartphone AP capabilities in terms of benchmark score against MediaTek and UNISOC by compiling the average AnTuTu benchmark score for chips released in the past 4 years, categorizing it by premium and low-mid end range. Furthermore, we calculated the average revenue per shipment estimates as a proxy for its pricing comparison. Based on the average performance benchmark score in 2024 and our calculated average revenue per shipment, we derived the performance per pricing for each company to compare their chipset value. Additionally, we updated the RF modem capabilities from our previous analysis in terms of peak download and upload speed. Finally, we ranked the companies and then projected Qualcomm’s handset segment growth based on market projections for the smartphone AP market and its relative competitive factor score.
AnTuTu, IDC, Company Data, Khaveen Investments
Based on the table above, Qualcomm continues to lead in terms of performance with the highest average performance benchmark across the premium and low-mid-end range, followed by MediaTek (OTCPK:MDTTF) and UNISOC. Additionally, Qualcomm’s superior chipset performance is also indicated by its RF modem capabilities, which continue to remain higher than MediaTek and UNISOC. Therefore, we believe this indicates Qualcomm’s performance advantage remains as covered in our previous analysis. However, Qualcomm’s pricing is also higher than competitors, which we believe reflects its performance advantage over MediaTek and UNISOC, which is similar to our previous analysis as we identified that Qualcomm targets the premium market segment. In terms of value, as measured by performance per pricing, MediaTek has the highest, followed by UNISOC. We ranked the companies based on performance and pricing, with Qualcomm leading, followed by MediaTek and UNISOC. However, we ranked UNISOC as the most competitive in terms of pricing, followed by MediaTek and Qualcomm. Overall, we believe all 3 companies ranked equally overall, with Qualcomm having a solid performance advantage but lacking pricing competitiveness while UNISOC has the most attractive pricing but the lowest in terms of performance whereas MediaTek is in between both companies in pricing and performance.
Outlook
|
Qualcomm Revenue Projections ($ bln) |
2023 |
2024F |
2025F |
2026F |
2027F |
|
Handset |
22,570 |
24,488 |
25,302 |
26,143 |
27,012 |
|
Growth % |
-21.7% |
8.5% |
3.3% |
3.3% |
3.3% |
Source: Company Data, Khaveen Investments
Overall, we believe Qualcomm’s diversification strategy to diversify from the Handset segment is significant as we highlighted the maturing smartphone market with a lengthening product life cycle and forecasted a CAGR of -2.8% for smartphone shipment growth through 2028, which does not bode well for the Qualcomm’s end market growth outlook.
IDC, Company Data, Khaveen Investments
Additionally, we highlighted the increasing competitiveness of MediaTek and UNISOC in terms of unit market share over the past 5 years. However, based on the market share chart above of the company’s smartphone AP revenue share, Qualcomm’s market share has been relatively stable in 2023 compared to 2022, as well as MediaTek and UNISOC.
We believe Qualcomm remains on top with a solid performance advantage in smartphone AP, but we also highlighted the pricing attractiveness of its competitors, as well as the lower pricing, compared to Qualcomm. Overall, we forecasted Qualcomm’s Handset segment growth based on a competitive factor score of 1x, as its performance advantage is offset by its higher pricing compared to competitors, with a market forecast CAGR of 3.3% based on our derived projections of the smartphone unit shipment and ASP growth forecast of 6.3% for a total growth forecast of 3.3% beyond 2024, which we based on its H1 YoY growth rate. We believe our competitive factor score of 1x remains appropriate given the stable market revenue share of Qualcomm despite its decreasing unit market share, as the company has higher pricing compared to competitors.
IoT and Automotive Segments
Finally, we focused on its IoT and Automotive segments and determined whether they could drive the company’s long-term growth and become significant drivers of total company growth as the company focuses on these segments for its diversification strategy.
IoT Segment
|
Qualcomm IoT Segment Revenue ($ mln) |
2022 |
2023 |
|
Wi-Fi Revenue |
1,483 |
1,198 |
|
Growth % |
-19.2% |
|
|
XR Revenue |
225 |
182 |
|
Growth % |
-18.2% |
|
|
PC CPU Revenue |
1,393 |
1,199 |
|
Growth % |
-13.9% |
|
|
Other IoT |
4,251 |
3,361 |
|
Growth % |
-20.9% |
|
|
Total IoT |
7,351 |
5,940 |
|
Growth % |
35.1% |
-19.2% |
Source: Company Data, Khaveen Investments
Firstly, we compiled and updated our revenue breakdown of its IoT segment from our previous analysis. Based on the table, we calculated Qualcomm’s revenue growth for the IoT segment was down across the entire segment with its Wi-Fi revenue, XR, PC CPU, and other IoT revenue declining by double digits. Based on our previous analysis and the first section, the decline was attributed to the end market weakness with elevated inventories among its customers.
Notwithstanding, the company highlighted several product developments across the IoT segment, such as in Wi-Fi, XR, and AI PCs with NPU chips. Thus, we then analyzed the growth prospects of its new IoT segment developments such as AI PC processors (NPUs) and determined its competitiveness by comparing with Intel and AMD, AR/VR by comparing its specifications with competitors, Wi-Fi by comparing its specifications with competitors and determined the comparison factor score to forecast its growth in excess to the market.
AI PCs (NPUs)
Qualcomm has been venturing into the Arm-based CPU market, as we previously covered, following the launches of Snapdragon 8cx Gen 3 and 7c+ Gen 3 in 2021. Recently, Qualcomm further directed its focus on AI PCs with the upcoming mid-2024 launch of the Snapdragon X Elite and X Plus, which features its Arm-based Oryon cores. Furthermore, the company highlighted that it had secured design wins among PC makers, including “HP (HPQ), Acer (OTC:ACEYY), ASUS (OTCPK:ASUUY), Dell (DELL), HONOR, Lenovo, Microsoft Surface, Samsung and Xiaomi”. In our latest analysis of Intel (INTC), we highlighted the AI PC CPUs of Intel with its Ultra processor series, as well as AMD Ryzen AI.
To determine whether Qualcomm has any advantages against Intel and AMD’s AI CPUs, we compiled their latest announced NPUs by maximum TOPS, maximum Multithread Frequency, process technology and maximum number of cores.
|
NPU Comparison |
Launch Date (Expected) |
Maximum TOPS |
Max Multithread Frequency |
Process Technology |
Cores |
Ranking (Average) |
Factor Score |
|
Intel (Lunar Lake) |
Sept 2024 |
48 |
3.3 GHz |
3 nm |
8 |
2.0 |
1.0 |
|
Qualcomm (Snapdragon X Elite) |
Jun 2024 |
45 |
3.8 GHz |
4 nm |
12 |
1.8 |
1.1 |
|
AMD (Ryzen AI 300) |
Jul 2024 |
50 |
2.0 GHz |
4 nm |
12 |
1.8 |
1.1 |
Source: Company Data, Khaveen Investments
Based on the table, we believe the specifications of the NPUs between Qualcomm, Intel and AMD are fairly similar with minor differences. In terms of TOPs, AMD’s latest chips have the highest TOPS but are closely followed by Intel and Qualcomm. Despite that, Qualcomm Snapdragon X Elite has the highest multithread frequency and is tied with AMD in terms of core count and process technology. Intel’s advantage lies in its process technology leveraging its new 3nm process, which is a generation ahead of Qualcomm and AMD. Overall, the specifications of competitors vary, with some companies having advantages in some areas and disadvantages in others. Furthermore, based on our ranking, we derived an average score of 1.8 for Qualcomm, which is tied with AMD while Intel follows closely at 2. Therefore, we expect Qualcomm, Intel and AMD to all benefit from the growth of AI PCs, which we highlighted has a market forecast CAGR of 67.1%.
Wi-Fi Segment
Furthermore, in Wi-Fi chips, we updated our comparison from our previous analysis to include Qualcomm’s new FastConnect 7900 chip in terms of peak speed, streams, spectrum support, modulation, multi-link, Bluetooth, Advanced Dual Bluetooth, Snapdragon Sound, LE Audio, Qualcomm aptX support, security support and channel bandwidth.
Company Data, Khaveen Investments
From the chart above, we see that Qualcomm’s new Wi-Fi chip falls short in peak speed compared to MediaTek and Broadcom, both of which offer higher peak speed performance. However, Qualcomm shines in terms of additional features that other competitors lack such as Snapdragon Sound, as Qualcomm aptX support and has the highest security support, on top of more common features including spectrum support, multi-link, Bluetooth, Advanced Dual Bluetooth, and channel bandwidth. Due to the unique Qualcomm features and security advantage, we ranked Qualcomm slightly higher than competitors with a competitive factor score of 1.2x, which we applied in our market forecast projections at a forward average of 11.4% for a total average revenue forecast of 13.3% for the company.
XR Segment
Company Data, Khaveen Investments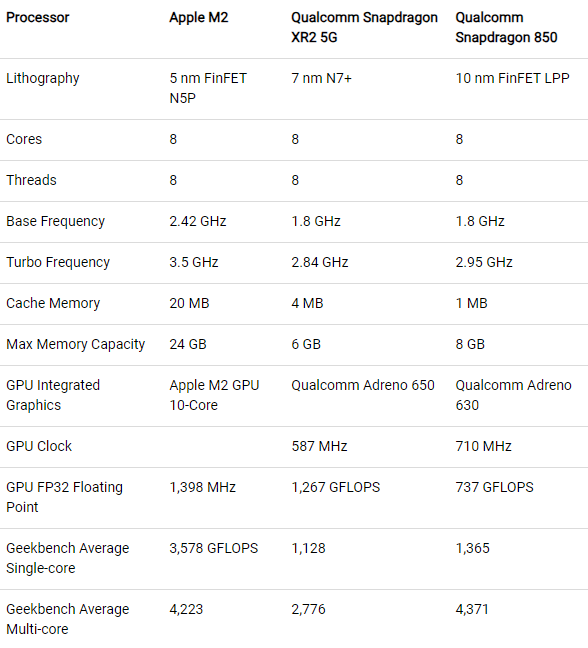
In the XR segment, we previously analyzed Apple’s Vision Pro and compared its chipset with competitors, highlighting that the top companies in the XR market such as Meta (META), Pico, and Microsoft (MSFT) use Qualcomm’s chips. Apple is the only company using its own chip, and Sony uses a custom-developed chipset by MediaTek, whose specifications are not disclosed. Furthermore, Meta (64%) is the market leader followed by Pico (7%) with a combined market share of 71% in Q1 2024. Therefore, we believe that Qualcomm currently remains the main chip supplier for XR devices in the world, and we continue to expect to capitalize on the XR market growth drivers as previously analyzed with a forecast average growth rate of 42.24% based on the average market forecasts from IDC, Counterpoint Research, Mordor Intelligence, Frost & Sullivan and Precedence Research.
Automotive Segment
In our last coverage, we analyzed Qualcomm’s automotive segment which, we believe, is closing the gap with ADAS automotive semicon market leader Intel Mobileye (MBLY), capturing a 28% market share in 2023 and achieving the highest growth rate among competitors at 24.8%, driven by a positive market outlook and a significant increase in automaker customers, highlighting Qualcomm’s competitive advantage. Additionally, Qualcomm’s Snapdragon Digital Chassis platform excels in both product breadth and performance metrics, resulting in a competitive factor score of 1.5x and projecting a growth rate of 28.1% for the automotive segment. Based on the company’s latest earnings, the company highlighted Snapdragon Digital Solutions resulting in a $45 bln design win pipeline, a significant increase of $15 bln from September 2022 ($30 bln). Furthermore, management also pointed out that within Snapdragon Digital Solutions, ADAS represented a third of design wins and had seen “tremendous success” and was a key factor in increasing the pipeline to $45 bln. Thus, we believe that this further supports our expectations for the company to sustain current growth and is on track to meet management’s revenue target of $4 bln for its Automotive segment in 2026, in line with our previous projections, due to Snapdragon’s Digital Solutions competitive strengths and the $15 bln increase (50% increase) in design win pipeline within the last 18 months.
Outlook
|
Qualcomm Revenue Projections ($ mln) |
2023 |
2024F |
2025F |
2026F |
2027F |
|
Wi-Fi Revenue |
1,198 |
1,321 |
1,525 |
1,734 |
1,972 |
|
Growth % |
-19.2% |
10.3% |
15.5% |
13.7% |
13.7% |
|
XR Revenue |
182 |
258 |
367 |
523 |
743 |
|
Growth % |
-18.2% |
42.2% |
42.2% |
42.2% |
42.2% |
|
CPU Revenue |
1,199 |
2,004 |
3,080 |
4,402 |
5,915 |
|
Growth % |
67.1% |
53.7% |
42.9% |
34.4% |
|
|
Other IoT |
3,361 |
2,605 |
2,978 |
3,403 |
3,856 |
|
Growth % |
-40.4% |
-22.49% |
14.30% |
14.30% |
13.30% |
|
Total IoT |
5,940 |
6,188 |
7,950 |
10,063 |
12,487 |
|
Growth % |
-19.2% |
4.2% |
28.5% |
26.6% |
24.1% |
|
IoT % of Total Revenue |
16.0% |
18.9% |
21.9% |
24.8% |
|
|
Automotive |
1,872 |
2,397 |
3,069 |
3,930 |
5,033 |
|
Growth % |
24.8% |
28.1% |
28.1% |
28.1% |
28.1% |
|
Automotive % of Total Revenue |
6.2% |
7.3% |
8.6% |
10.0% |
Source: Company Data, Khaveen Investments
All in all, we believe the company’s IoT and Automotive segment could represent major growth drivers for the company’s total revenue growth compared to the Handset segment with developments across IoT with Wi-Fi, XR and AI PC CPUs, followed by robust growth in the automotive segment supported by increased product pipeline. We updated our forecasts for the company’s IoT segment as mentioned above for the Wi-Fi revenue growth based on a competitive factor score of 1.2x applied in our market forecast projections at a forward average of 11.4% for a total average revenue forecast of 13.3% for the company, XR segment at an average forecast of 42.2% reflecting the company’s positioning as the main chip supplier for the top companies such as Meta and Pico. In AI CPUs, we based this on the market forecast CAGR of AI PCs as mentioned in our previous analysis of 67.1%, but we tapered down by 0.8x for each year as we believe the market is highly competitive with a rapid pace of innovation with yearly product launches from Intel and AMD. Moreover, we based our forecast for its Other IoT revenues in 2024 on its H1 growth performance and the market CAGR for IoT chipsets of 14.3% beyond that as we previously highlighted, we expected a recovery in the IoT market in the second half of 2024. Furthermore, we maintained our forecasts from our previous analysis for the Automotive segment. In total, we derived an average forward growth of 20.8% and 28.1% for IoT and Automotive respectively, which bodes well for the company’s growth as we expect it to rise by 25% and 10% of revenues by 2027, becoming significant growth drivers.
Risk: Short-Term Growth Headwinds
While we expect the company’s diversification strategy to boost growth through its focus on IoT and Automotive segments as we projected both IoT (20.8%) and Automotive (28.1%) at an average forward growth rate to outpace Handset’s average forward growth of 4.6%, we expect the company to continue facing short-term growth headwinds in 2024; thus we conservatively forecast its total IoT growth by 4.2% in 2024, as management indicated continued weakness in the industrial IoT segments. However, in our previous analysis of the DAO market, we expect the industrial end market to recover in the second half of the year, following a downturn in global manufacturing activity.
Valuation
Khaveen Investments
We updated our DCF valuation and derived an upside of 29% based on a discount rate of 10.7% and terminal value based on the 5-year average US-only semicon chipmaker EV/EBITDA of 19.99x (excluding companies with above 20% CAGR).
Verdict
All in all, we believe the company’s diversification strategy is indeed showing positive signs, with the QCT segment’s Automotive and IoT segments growing faster than the Handset segment over the past five years. Despite that, however, the Handset segment remains the largest, contributing 63% to total revenues, while Automotive and IoT account for 5% and 17%, respectively. While the benefit of its diversification strategy has not been seen on its geographic revenue exposure and customer concentration, we believe it may have benefitted the company’s margins, particularly with the rising QCT margins due to high IoT and Automotive growth and could further lead to higher upside for margin growth. One of the main advantages of the strategy which, we believe, is due to the maturing smartphone market which we derived a CAGR of -2.8% through 2028 as well as increased competition from MediaTek and UNISOC. Despite Qualcomm’s performance advantage in smartphone AP, competitors offer attractive pricing, resulting in our forecast for the Handset segment growth at a CAGR of 3.3%.
Moreover, we see significant growth potential in the IoT and Automotive segments, driven by developments in Wi-Fi, XR, and AI PC CPUs, and a strong product pipeline in automotive. We forecasted an average revenue growth of 13.3% in IoT, including 11.4% for Wi-Fi, 42.2% for XR, and adjusted growth for AI CPUs at a 67.1% CAGR before conservatively tapering down for competitive pressures, and expect a 14.3% CAGR for other IoT revenues, whereas our Automotive segment forecasts remain unchanged at a CAGR of 28.1%. Overall, we expect IoT and Automotive to become significant revenue drivers, contributing 25% and 10% of total revenues by 2027 respectively. Based on our revised valuation, we continue to rate the company as a Buy with a price target of $232.20, higher than our previous price of $212.66 due to a lower discount rate (10.7% vs 11.8%) and higher EV/EBITDA multiple (19.99x vs 17.72x) than our previous analysis.
Analyst’s Disclosure: I/we have a beneficial long position in the shares of QCOM either through stock ownership, options, or other derivatives. I wrote this article myself, and it expresses my own opinions. I am not receiving compensation for it (other than from Seeking Alpha). I have no business relationship with any company whose stock is mentioned in this article.
No information in this publication is intended as investment, tax, accounting, or legal advice, or as an offer/solicitation to sell or buy. Material provided in this publication is for educational purposes only, and was prepared from sources and data believed to be reliable, but we do not guarantee its accuracy or completeness.
Seeking Alpha’s Disclosure: Past performance is no guarantee of future results. No recommendation or advice is being given as to whether any investment is suitable for a particular investor. Any views or opinions expressed above may not reflect those of Seeking Alpha as a whole. Seeking Alpha is not a licensed securities dealer, broker or US investment adviser or investment bank. Our analysts are third party authors that include both professional investors and individual investors who may not be licensed or certified by any institute or regulatory body.