Summary:
- Qualcomm stock, down nearly 30% from its all-time highs, shows signs of a potential breakout due to strong technical indicators and improving fundamentals.
- Technical charting reveals a neutral outlook with balanced support and resistance levels, but indicators like RSI and stochastics suggest strengthening bullish momentum.
- Fundamentals are robust, with significant YoY revenue and EPS growth, indicating the stock is undervalued and deserving of P/S and P/E multiple expansion.
- Combining technical and fundamental strengths, I believe Qualcomm is primed for an upward move, making it a buy recommendation.
G0d4ather
Thesis
Down nearly 30% from its all-time highs and in a current trading range, from my analysis, I believe QUALCOMM Incorporated (NASDAQ:QCOM) stock could be ready to stage a breakout. In the below technical analysis, I determine that the chart and moving averages show a neutral outlook. However, the strength in the indicators was the deciding factor as there were signs of broad strengthening in the stock, indicating that an upside breakout is likely. For the fundamentals, with increasingly strong revenue and EPS growth, I believe the stock is undervalued at current levels as the P/S and P/E ratios deserve multiple expansions. The growth trajectory is impressive and is much better than back in 2023. Therefore, after considering both technical and fundamental factors, I believe the stock is primed for an upward move and deserves a buy rating.
Technicals
Charting
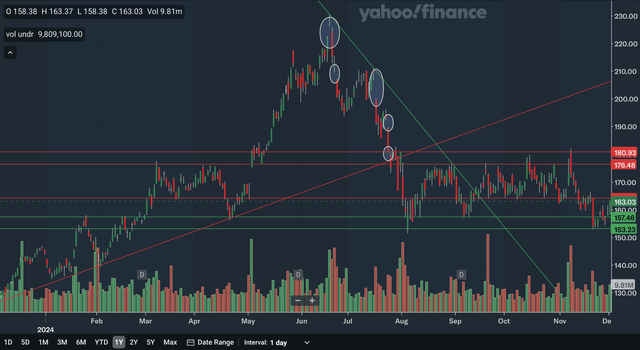
There is quite a lot going on in Qualcomm’s chart. First of all, the stock broke below an uptrend line back in late July and early August, ending the uptrend that dated back to 2023. The stock, however, broke the more recent downtrend line in September to move into a more neutral trading range. The nearest support level would be in the high 150s, as that area was resistance very early in the year and has been support multiple times since. The other support area would be in the low-150s, as that price level was key support in August as well as in November.
For resistance, the nearest level is very near the current stock price. The resistance level is in mid-160s and has been support many times throughout the year, particularly in recent months. However, it already started to act as resistance back in November. The next source of resistance would be in the mid-170s with it being resistance already many times during the year. The 180 level is also resistance as it represents the nearest unfilled downward gap in the stock and has already acted as resistance in November. Lastly, the former uptrend line could be resistance as well but is quickly moving out of range.
I have circled three other downside gaps that have been unfilled. With the abundance of these gaps occurring in the past few months, there is a possibility that the stock is now oversold and due for a bounce. I also circled an evening star formation at the June peak. This bearish pattern should have given investors an early indication that the trend was about to reverse.
Overall, I believe the chart shows a net neutral outlook for Qualcomm stock, as there is quite a balance of support and resistance. It is in a trading range and the next move is uncertain from analyzing the chart.
Moving Averages
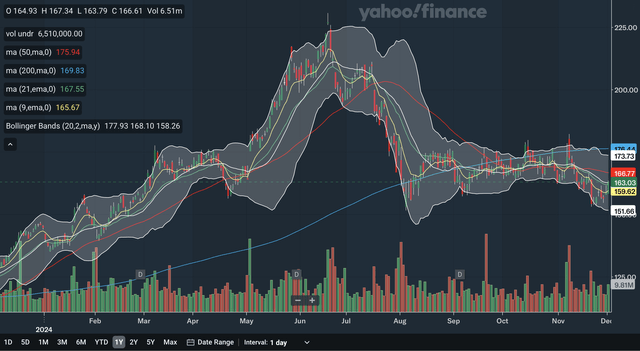
The 50-day SMA had a death cross with the 200-day SMA in September, a major bearish signal. The gap between the SMAs has also accelerated its expansion, showing that there is an increase in bearish momentum in the stock. The stock trades below both SMAs, another signal of weakness. For the EMAs, the 9-day EMA is currently below the 21-day EMA, reflecting near-term weakness. However, the stock has climbed back above both of these EMAs causing the 9-day EMA’s trajectory to improve significantly. The gap between the EMAs is closing, showing that near-term bearishness is receding.
For the Bollinger Bands, the stock is trading right at the 20-day midline. Since we are in neither an uptrend nor a downtrend, the midline’s significance as support or resistance is diminished. Nonetheless, if the stock is to break above this line, it would be a signal of strength and could decrease the likelihood of a downward breakdown from the trading range. Investors should monitor the Bollinger Bands closely to see if this signal occurs. The stock also recently bounced off the lower band, showing that it was oversold and due for a recent bounce.
The moving average analysis also shows a net neutral outlook, in my view, as there were conflicting signals between the SMAs and the EMAs. The SMAs showed longer-term bearishness, but the EMAs reflected that near-term bearishness is receding. In addition, the stock is right at the Bollinger Band’s midline, with no clear crossover signal yet. There is a balance of strength and weakness indications here.
Indicators
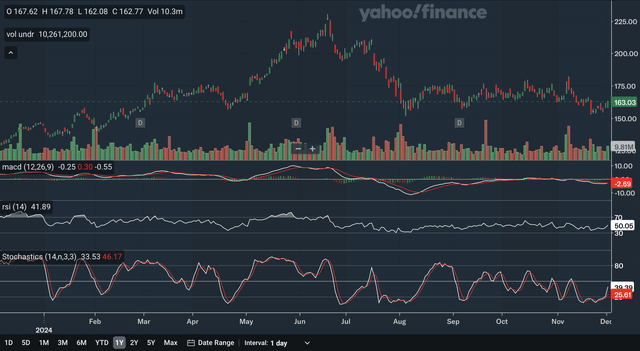
The MACD is currently at the same level as the signal line, and so there have been no crossover signals lately. However, the MACD was below the signal line before closing the gap, showing the ongoing receding of bearishness in the stock. For the RSI, it is currently right at the critical 50 level. The RSI only just regained this level and shows that bulls have marginally taken control of the stock from the bears. For the stochastics, the %K line crossed above the %D within the oversold 20 zone, a highly bullish signal. The gap between the lines is also rapidly expanding, showing accelerating bullish momentum in the nearer term. The next thing to watch for the stochastics is to see whether it can cross the 50 mark as another indication of strength.
As a whole, I believe these indicators reflect a net positive current outlook for the stock, as there are signs of strength present in each of the three indicators discussed here. There are signs of strengthening bulls and receding bears, making the technical picture a bright one for Qualcomm.
As an aside, a noteworthy item that applies to all three indicators is the negative divergence at the June peak earlier this year. While the June peak in the stock surpassed the May peak, all three key indicators failed to confirm as they all made lower highs in June compared to May. This should have been a major red flag to investors that the uptrend was nearing its end.
Fundamentals
Earnings
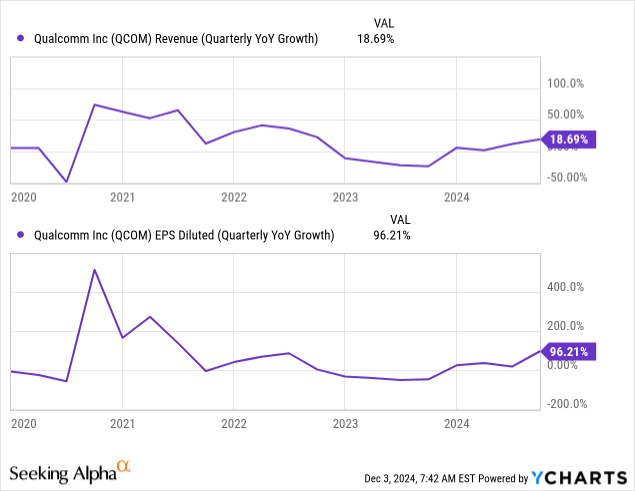
In early November, Qualcomm reported their Fiscal 2024 Q4 earnings and showed quite strong results overall. They reported revenues of $10.244 billion, up 19% YoY from $8.631 billion. For EPS, they reported a diluted GAAP figure of $2.59, an impressive 96% increase YoY from $1.32. Both revenue and EPS beat expectations, with revenue beating by $309.46 million and EPS beating by $0.20. As you can see in the chart above, revenue growth is back to trending in the right direction after negative growth back in 2023. Revenue growth is currently quite in line with historic standards. For EPS growth, it is also back to trending in the right direction, as it was also negative for the most part in 2023. Although it’s below the five-year high, the current growth rate is impressive and is a signal of fundamental strength in the stock. In addition, the next dividend payout will occur on December 19th and the stock will go ex-dividend on December 5th. The current stock price and dividend reflect a yield of 2.09%.
Valuation
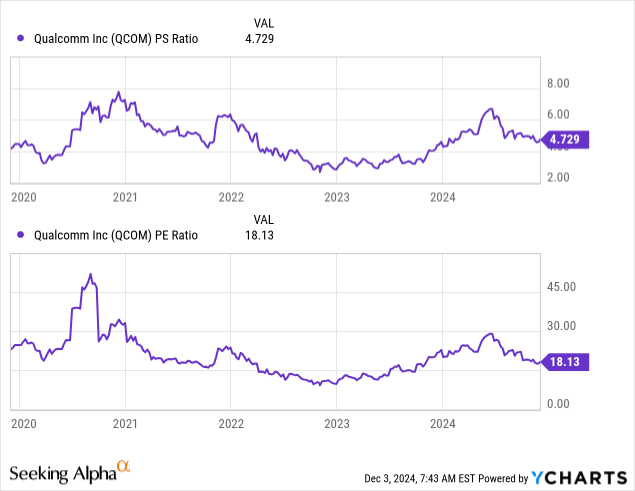
Both the P/S and P/E ratios are currently relatively near their five-year averages, and both have declined since the middle of this year. The P/S ratio is currently at 4.729 after being over 6 a few months ago, and the P/E is at 18.13 after nearing 30 a few months ago. When you compare these valuation multiple charts with the growth charts above, I believe it shows that the stock is undervalued. Revenue growth has improved a significant amount since the middle of the year, but the P/S ratio has fallen. I believe the strengthening in revenues deserves a higher valuation multiple. This is also the case for EPS growth. It, too, has shown significant improvements since the middle of the year, but the P/E ratio has not been rewarded with expansion. As you can see above, the valuation multiples usually track their respective growth rates quite well, and it seems as though they are currently too low after accounting for the increasingly strong fundamentals of the business. Therefore, I would conclude that Qualcomm is undervalued at current levels.
Conclusion
The technicals showed a net positive outlook for the stock with the indicators’ strength being the deciding factor with the chart and moving averages only being net neutral. The signs of strength in each of the three indicators, in my view, should give investors confidence that the bulls have the edge in the stock. For the fundamentals, as discussed above, Qualcomm should see P/S and P/E multiple expansions as the impressive growth rates in its financials demand higher levels in these multiples. The stock is therefore undervalued currently. With the technicals tipping in the bulls’ favor and the fundamentals confirming the strength in the company, I believe Qualcomm is currently a buy as it is well-positioned for a breakout rally.
Analyst’s Disclosure: I/we have no stock, option or similar derivative position in any of the companies mentioned, and no plans to initiate any such positions within the next 72 hours. I wrote this article myself, and it expresses my own opinions. I am not receiving compensation for it (other than from Seeking Alpha). I have no business relationship with any company whose stock is mentioned in this article.
Seeking Alpha’s Disclosure: Past performance is no guarantee of future results. No recommendation or advice is being given as to whether any investment is suitable for a particular investor. Any views or opinions expressed above may not reflect those of Seeking Alpha as a whole. Seeking Alpha is not a licensed securities dealer, broker or US investment adviser or investment bank. Our analysts are third party authors that include both professional investors and individual investors who may not be licensed or certified by any institute or regulatory body.
