Summary:
- JPMorgan Chase & Co.’s preferred stocks trading below par are not attractive investments due to their overvaluation compared to company bonds and peer issues.
- Despite a 10% price drop since September 2024, the preferred stocks still yield lower than similar-rated securities from other issuers.
- JPMorgan Chase’s strong financial condition ensures preferred dividends are safe, but the current pricing does not justify a “Buy” rating.
- I recommend a “Hold” rating for these preferred stocks, primarily due to their recent price decline and potential for technical correction.
subman
Co-authored by Relative Value.
Overview
Going through the exchange-traded fixed-income charts and looking for nice opportunities to profit from, I found myself in an interesting dilemma – do these of the JPMorgan Chase & Co. (NYSE: JPM) preferred stocks trading below par at the moment offer me good trading/investing opportunity? They have seen some selling pressure for almost three months now – are they a technical buy due to expected correction? After all, these are among the most popular preferred stocks of the exchange, and the “too big to fail” status of their issuer JPM has given them in the eyes of many almost “treasuries like” safety. Then I considered why make only technical analysis when I can make a full study of them and the issuing company and put it into an article, it should be a good one. So let us dive into this together.
The Preferred Stocks
JPMorgan Chase & Co. has six exchange-traded preferred stocks at the moment, all of them perpetuities with a fixed rate. The most important metrics of the stocks are shown in the table below:
JPMorgan exchange-traded preferred stocks (proprietary software)
Two of the issues – JPMorgan Chase & Co. 6 DEP NCM PFD EE (NYSE: JPM.PR.C) and JPMorgan Chase & Co. 5.75% SHS PFD DD (NYSE: JPM.PR.D) are trading pinned to par at the moment and present no investment interest to us as they offer no capital appreciation. The other four preferred stocks – JPMorgan Chase & Co. 4.55 DEP PFD JJ (NYSE: NYSE:JPM.PR.K), JPMorgan Chase & Co. 4.625 DEP PFD LL (NYSE: JPM.PR.L), JPMorgan Chase & Co. 4.75% DP SH GG (NYSE: JPM.PR.J), and JPMorgan Chase & Co. 4.20% DP PFD MM (NYSE: JPM.PR.M) are under some selling pressure along with most of the rest of the fixed-income securities for the past three months. At the moment, they are trading around $3 below their September 2024 year highs with a current yield of approximately 5.6% for each of the issues. These four “brothers” usually receive the same treatment from market participants and trade with almost identical current yields. From the trader’s/investor’s perspective, they are completely interchangeable at the moment.
JPMorgan preferreds price charts (TradingView)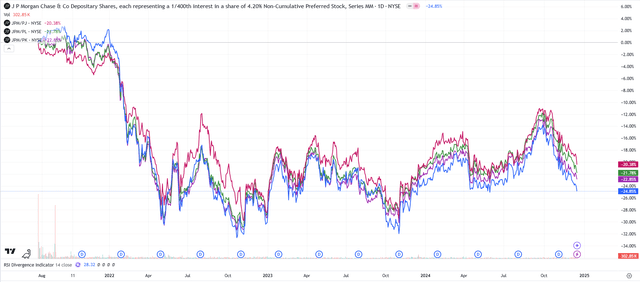
The Company
JPMorgan Chase & Co. (NYSE: JPM), a financial holding company incorporated under Delaware law in 1968, is a leading financial services firm based in the United States of America (“U.S.”), with operations worldwide. JPMorgan Chase had $4.2 trillion in assets and $345.8 billion in stockholders’ equity as of September 30, 2024. The Firm is a leader in investment banking, financial services for consumers and small businesses, commercial banking, financial transaction processing and asset management. Under the J.P. Morgan and Chase brands, the Firm serves millions of customers, predominantly in the U.S., and many of the world’s most prominent corporate, institutional and government clients globally.
JPMorgan Chase’s principal bank subsidiary is JPMorgan Chase Bank, National Association (“JPMorgan Chase Bank, N.A.”), a national banking association with U.S. branches in 48 states and Washington, D.C. JPMorgan Chase’s principal non-bank subsidiary is J.P. Morgan Securities LLC (“J.P. Morgan Securities”), a U.S. broker-dealer. The bank and non-bank subsidiaries of JPMorgan Chase operate nationally as well as through overseas branches and subsidiaries, representative offices and subsidiary foreign banks. The Firm’s principal operating subsidiaries outside the U.S. are J.P. Morgan Securities plc and J.P. Morgan SE (“JPMSE”), which are subsidiaries of JPMorgan Chase Bank, N.A. and are based in the United Kingdom (“U.K.”) and Germany, respectively.
Source: Q3’24 Report
This is what the daily price chart for the common stock looks like:
JPMorgan common stock price chart (TradingView)
Dividends
JPMorgan Chase & Co. has been paying a consistently increasing yearly common stock dividend, without any interruptions, for the past 10 years. The graph below shows how the company’s quarterly distributions have developed through the past several years.
JPM historical dividends information (seekingalpha.com)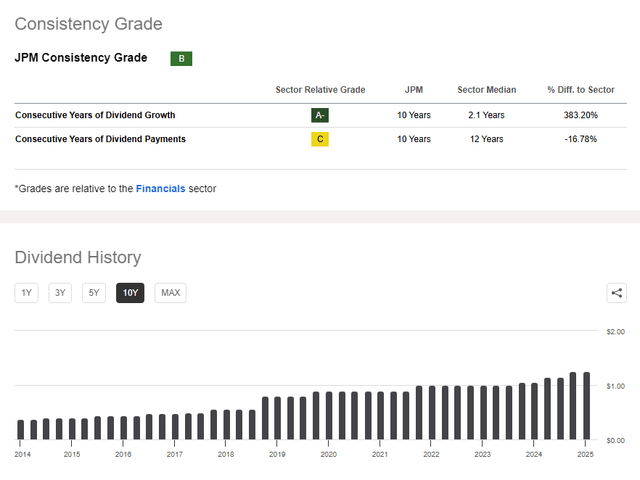
At the moment, JPM’s common stock dividend is $5 forward annualized in the form of $1.25 quarterly distributions. At the current price of $241.31 for the common stock, the Dividend Yield is calculated to be around 2%. The dividend information for the common stock can be summarized this way:
JPM dividends information (seekingalpha.com)
With around 2.9 bln common shares outstanding, that calculates to a $14.5 bln annualized distribution for the common stockholders while the $1.7 bln annual dividend for the preferred stockholders represents just under 12% of that sum.
JPM dividend grades (seekingalpha.com)
JPM receives the highest possible notch in the Dividend Safety indicator in the SA scorecard. That should make any holder of JPM-issued preferred stock feel pretty confident that the chances for preferred dividend suspension are slim to none, being only 12% of the common stock’s distributions.
Capital structure
Below is depicted a snapshot of JPMorgan Chase & Co.’s capital structure as of its Third Quarterly Report from September 2024. For comparison reasons, the capital structure for the previous four quarters is provided too, so anyone interested can check how it evolved historically in the short term.
JPMorgan capital structure (author’s spreadsheet)
As of Q3’24, JPM had a total debt of $929.2 bln ranking senior to the outstanding preferred stock equity of $21.65 bln. The common stock equity of the company equals $324.19 bln and stands lowest in the capital structure.
Credit Rating
JPMorgan rating action commentary (fitchratings.com)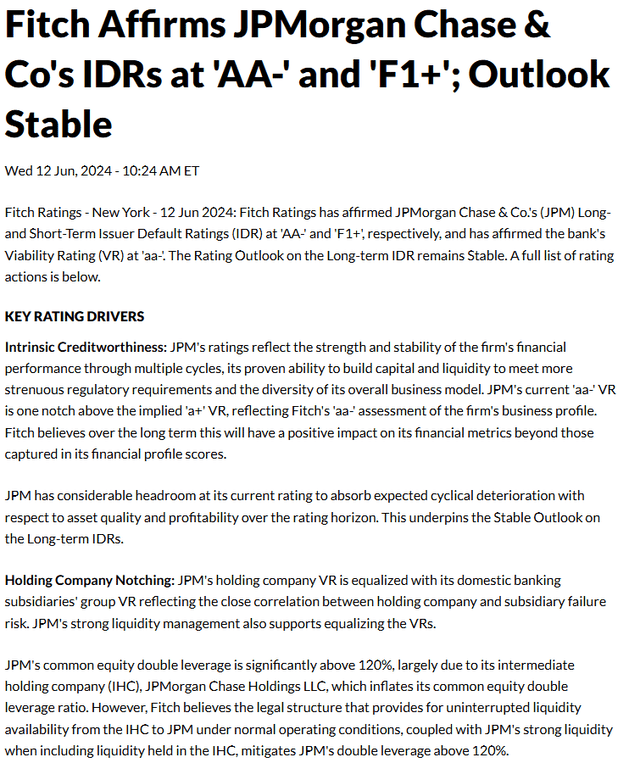
This is the beginning of the credit auction commentary with which Fitch affirms the ‘AA-‘ long-term and ‘F1+’ short-term issuer default rating to JPMorgan Chase & Co. These are top-notch marks that confirm that only something completely unexpected can threaten JPM’s financial strength.
Bond Yields and comparison to preferred stocks CY
A common practice used in evaluating security is to calculate its relative value among the similar products of the same issuer. An outlier has to stand above its brothers. JPMorgan Chase & Co. has quite a lot of corporate debt issues trading in the Bond Market.
JPMorgan debt issues information (IBRK platform)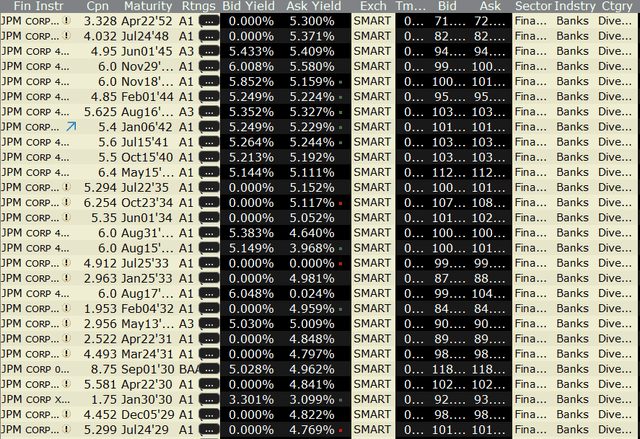
As the preferred stocks of interest to us in this analysis are perpetuities trading below PAR value, it is only natural to turn our attention towards the bonds from the same issuer with the longest maturity. The issues in the upper part of the table above have maturity dates in the range of 2045 to 2052 year, yielding to maturity of around 5.4%, and most of them have an A1 credit rating from Moody’s. That rating is four notches higher than the Baa2 grade each of the four preferreds from our set has received from the same rating Agency. This solidifies that the preferred stocks are overvalued at current pricing. Our practice shows that, as a general rule, securities with a common issuer and different credit rating should yield a 0.25% up for every credit notch down if fairly priced. JPM-K, for example, has to have a current yield of 6.4% with a corresponding price of around $17.50 if it is to be fairly priced to the JPM bonds with the longest maturities. The same applies for the rest of the set:
JPMorgan preferreds compared to bonds (author’s spreadsheet)
Compared to the JPM bonds with similar duration, these preferred stocks cannot qualify as a good investment opportunity, according to our analysis. More than that, these preferreds are extremely overvalued on a relative basis at the moment, despite the more than 10% drop in their prices from September 2024 to this moment.
The preferred stock issues at IPO
BBB-rated US corporate risk premium (TradingView)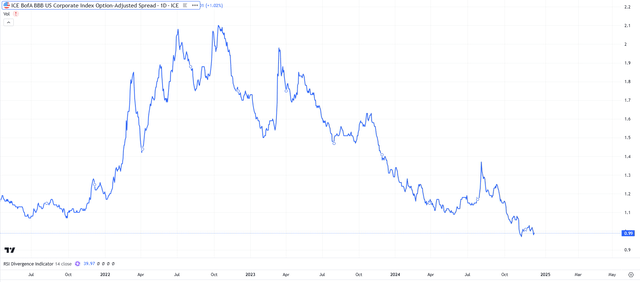
This is a graph depicting how the risk premium of the publicly issued US dollar-denominated BBB-rated corporate debt developed over time. But we are studying preferred stocks and not debt, so we did the calculations, and here is what the risk premium for JPM-K for example looks like in time. The credit spread trend for the preferred is quite similar to the debt’s one.
JPM-K risk premium (TradingView)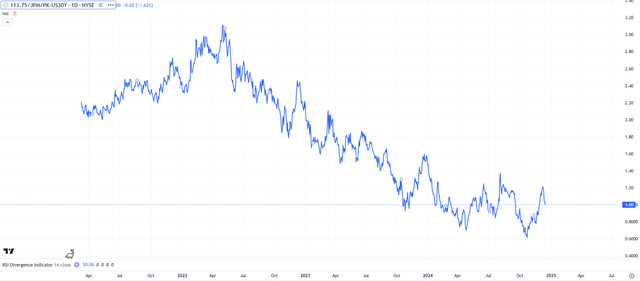
The idea behind this analysis is that we need to find out if there is any sound financial reason behind the narrowing of the credit spreads for JPM’s preferred stocks set we study, or not. As we usually do in this type of analysis, we will check how the underwriters priced these securities at their IPOs. We believe that the analysis made by the underwriters during the process of fixed-income IPO is maybe the most accurate assessment for both the new instrument and the issuing corporation.
JPMorgan preferreds credit spread at IPO (author’s spreadsheet)
The table above shows the nominal yield for each of, at the moment, six outstanding exchange-traded preferred stocks of JPMorgan Chase & Co. and the corresponding benchmark yield – that of the 30-year treasuries at the date of every IPO. Calculating the IPO credit spread for every issue we see, that JPM has consistently issued its latest fixed-income equity at around 2.5% credit spread above the longest-term US treasuries rate. This is how the risk premium for the preferred stocks trading below par looks at the moment:
JPMorgan preferreds credit spread at the moment (author’s spreadsheet)
Each of the group of preferreds has narrowed its credit spread to the benchmark with around 1.5% to the value of 1% at the moment. If we do the math and calculate their prices so that they are fairly priced to the 30-year treasuries, the drop in the prices is even bigger than compared with the company’s debt comparison:
JPMorgan preferreds fair valuation to benchmark (author’s spreadsheet)
That should not be a surprising result, as JPM bonds, along with the rest of the US A-rated corporate debt, have too narrowed their risk premiums to extreme levels:
Single A-rated US corporate risk premium (TradingView)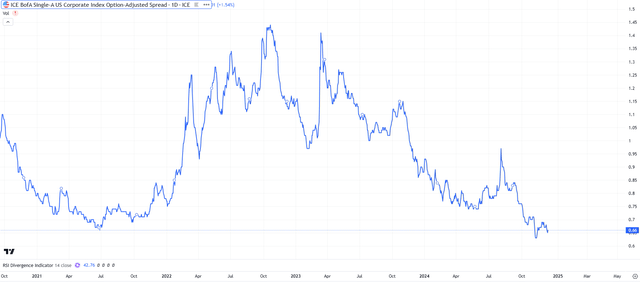
Comparison to Peers
It is always a good practice when analyzing fixed-income securities to put them against their direct peers with the same credit rating, issued by different companies. This gives the potential investor a visual conception of how the studied issues are relatively positioned among a group of “cousins” that bear similar risks and tax treatment. The table below contains all the exchange-traded traditional preferred stocks trading below par value, BBB–rated by S&P, sorted by a descending current yield order.
‘BBB-‘-rated preferred stocks comparison (proprietary software)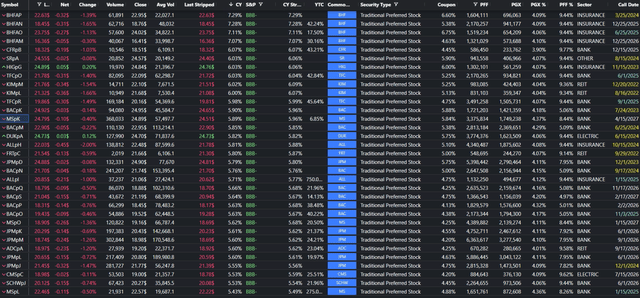
The four JPM-issued preferred stocks are at the bottom of this list, and this fact does not speak in their favor. There is no sound financial logic behind choosing the lowest-yielding fixed-income of a set of peers. An argument could be made that the JPM preferreds could make a pure technical up-correction after 3 months of dropping in their prices, but that reasoning is a valid one for almost all the securities of this list.
BBB and above rated preferred stocks comparison (proprietary software)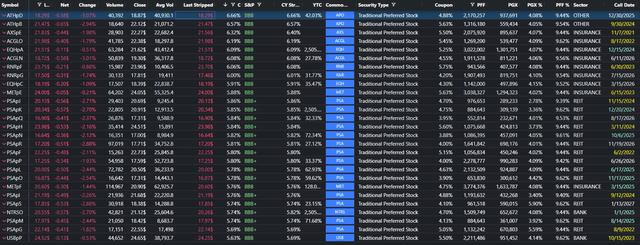
We can go a step further and show a list of preferred stocks that match the same conditions but have higher credit quality and offer better current yields than the JPM issues. I think at this point, the result of this analysis should be pretty obvious. I am not per se against technical analysis, but believe a more thorough study from more angles should be made whenever possible. More in-depth analysis often shows things that stay hidden when only looking at the charts.
Conclusion
The brief study of JPMorgan Chase & Co.’s financial condition showed no signs that the distributions of their outstanding preferred stocks are endangered in any way for the foreseeable future. However, comparing the four JPM-issued exchange-traded preferred stocks trading below par against the company bonds, benchmark treasuries and peer issues from other companies showed that they are still overvalued, despite the 10% drop in their prices from September 2024 to now. I was in a bit of a dilemma about whether to give them a “Sell” or “Hold” rating, and the sole reason for the final “Hold” is that they have already dropped 10% in price. The one sure thing is that after the analysis is done, I absolutely cannot rate them a “Buy”.
Analyst’s Disclosure: I/we have no stock, option or similar derivative position in any of the companies mentioned, and no plans to initiate any such positions within the next 72 hours. I wrote this article myself, and it expresses my own opinions. I am not receiving compensation for it (other than from Seeking Alpha). I have no business relationship with any company whose stock is mentioned in this article.
Seeking Alpha’s Disclosure: Past performance is no guarantee of future results. No recommendation or advice is being given as to whether any investment is suitable for a particular investor. Any views or opinions expressed above may not reflect those of Seeking Alpha as a whole. Seeking Alpha is not a licensed securities dealer, broker or US investment adviser or investment bank. Our analysts are third party authors that include both professional investors and individual investors who may not be licensed or certified by any institute or regulatory body.
Trade With Beta
At Trade With Beta, we discuss ideas like this as they happen in more detail. All active investors are welcome to join on a free trial and ask any question in our chat room full of sophisticated traders and investors.
