Summary:
- Rivian Automotive, Inc. exceeded analysts’ estimates with Q2 deliveries of 12.64K vehicles, moving closer to its annual target of 50K deliveries.
- The company’s stock surged well above its critical resistance zone of $16, likely forcing short sellers to flee and cover their positions.
- However, Rivian Automotive now trades at a premium against its auto industry peers and is no longer available at a discount. Dip buyers have also likely entered earlier.
- Staying on the sidelines for Rivian stock is still a sensible thing to do.
Mario Tama
Rivian Automotive, Inc. (NASDAQ:RIVN) posted a stunning Q2 deliveries report as CEO RJ Scaringe and his team moved closer to achieving its 50K annual deliveries target.
As reported, Rivian posted deliveries of 12.64K, well above analysts’ estimates of 11K. The performance for Q2 was impressive, as it was predicated against production of 13.99K vehicles, indicating a deliveries/production ratio of more than 90%. Compared to Rivian’s Q1 ratio of 84.6%, it was a significant improvement.
As such, I’m not surprised that RIVN has surged decisively above its critical resistance zone of $16, likely forcing short sellers who anticipated another massive disappointment in its Q2 deliveries card to flee for cover.
Keen Rivian investors would have noted that RIVN’s short interest as a percentage of its outstanding float rose to 13.14% in mid-June. Therefore, it suggests that bearish investors were assuming that a perceived macroeconomic slowdown/recession could force electric vehicle (“EV”) upstarts like Rivian to underperform.
However, I cautioned bearish investors in my May update that “high-conviction buyers could capitalize on last week’s steep pullback to add more shares, as the buying sentiments seem to have stabilized.” Moreover, I added that “if RIVN’s April 2023 lows hold robustly, another surge to re-test the $16 level is possible.”
As such, it was clear to me back then that RIVN didn’t proffer a clear short-sell signal at those levels, suggesting it was a risky move to execute. RIVN bulls would likely justify their bullishness at those levels that the market was too harsh and over-pessimistic. Does it make sense? Actually, it does.
RIVN’s forward revenue multiple was hammered to 0.34x at its April lows, even below the 0.6x based on the Buy call I made in mid-March. As such, if buyers were to support RIVN’s bottom in April, it likely came from investors who believed that the hammering had gone too far, with RIVN punished too hard. Therefore, taking a cue from RIVN’s April lows as a critical support zone is sensible. In my opinion, selling against that level is absolute madness, as I highlighted that “buying sentiments seem to have stabilized.”
Also, the cagey sentiments over EV stocks in Q1 since EV leader Tesla (TSLA) bottomed in April have improved. Tesla’s remarkable performance with its Q2 deliveries card has given a much-needed lift to its peers, suggesting that the much-dreaded recession is still nowhere to be found. Perma-bears continue holding onto their thesis, even though the Technology Select Sector ETF (XLK) nearly re-tested its all-time highs. While a pullback should not be ruled out, it’s incredible that these bears still think that the market’s October 2022 lows would be breached after the end of this “bear market rally.”
However, strategist Edward Yardeni updated on his July 3 brief, he sees an increased possibility of a soft landing to 75% from 60% previously. As such, we are moving from a “rolling recession” scenario to one of “rolling growth.” With that in mind, risk-on plays, including EVs, are expected to fare better after last year’s battering.
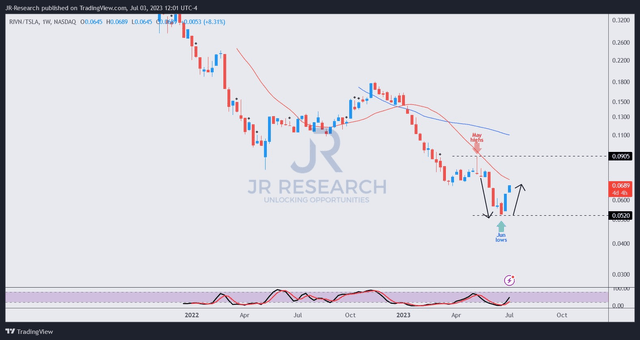
RIVN/TSLA price chart (weekly) (TradingView)
In addition, RIVN has also outperformed TSLA since mid-June. As seen above, RIVN/TSLA has surged over the past two weeks (including this week, but the week is not over) after diving for four consecutive weeks toward its June nadir.
Therefore, the mean reversion is unsurprising, as RIVN was likely pushed down too hard. Astute short-sellers probably covered in mid-June when they observed that dip buyers weren’t giving up their positions to take it down further to April lows.
How much further can RIVN’s buying surge take us? At this point, I don’t see a strong sell signal for dip buyers, who managed to buy its previous lows. Short sellers who used the $16 resistance level as a defense line have likely been obliterated and forced to cover. In addition, dip buyers are not likely to support the surge.
Hence, we are likely left with momentum buyers who need to consider whether the risk/reward is still favorable, with another key resistance lurking at the $22 level. With Rivian Automotive, Inc. stock’s forward revenue multiple surging to 2.1x, it’s no longer attractive, as it reflects a marked premium against its auto industry median of 0.96x.
Therefore, before investors decide to join the surge, as the market cheers its outperformance, it’s important to assess whether the risk/reward at the current level is still worth it.
Rating: Hold (Reiterated).
Important note: Investors are reminded to do their own due diligence and not rely on the information provided as financial advice. The rating is also not intended to time a specific entry/exit at the point of writing, unless otherwise specified.
We Want To Hear From You
Have additional commentary to improve our thesis? Spotted a critical gap in our thesis? Saw something important that we didn’t? Agree or disagree? Comment below and let us know why, and help everyone in the community to learn better!
Analyst’s Disclosure: I/we have a beneficial long position in the shares of TSLA either through stock ownership, options, or other derivatives. I wrote this article myself, and it expresses my own opinions. I am not receiving compensation for it (other than from Seeking Alpha). I have no business relationship with any company whose stock is mentioned in this article.
Seeking Alpha’s Disclosure: Past performance is no guarantee of future results. No recommendation or advice is being given as to whether any investment is suitable for a particular investor. Any views or opinions expressed above may not reflect those of Seeking Alpha as a whole. Seeking Alpha is not a licensed securities dealer, broker or US investment adviser or investment bank. Our analysts are third party authors that include both professional investors and individual investors who may not be licensed or certified by any institute or regulatory body.
A Unique Price Action-based Growth Investing Service
- We believe price action is a leading indicator.
- We called the TSLA top in late 2021.
- We then picked TSLA’s bottom in December 2022.
- We updated members that the NASDAQ had long-term bearish price action signals in November 2021.
- We told members that the S&P 500 likely bottomed in October 2022.
- Members navigated the turning points of the market confidently in our service.
- Members tuned out the noise in the financial media and focused on what really matters: Price Action.
Sign up now for a Risk-Free 14-Day free trial!

