Summary:
- Rivian posted a deliveries/production ratio of 85% for Q1, much lower than Tesla’s 96% metric.
- Auto production could overshoot sales this year, hampering Rivian’s ability to close the gap over its production.
- Tesla could continue to cut prices further, introducing more uncertainties to its EV and auto OEM peers, even as they attempt to gain a foothold.
- Investing in RIVN stock requires nerves of steel, and investors should demand a significant margin of safety.
Justin Sullivan
Rivian Automotive, Inc. (NASDAQ:RIVN) released its Q1 deliveries and production figures recently, which were ahead of the consensus estimates. The company posted deliveries of 7.95K vehicles (Vs. consensus: 7.75K). In addition, its production ramp didn’t disappoint as it produced 9.4K vehicles (Vs. consensus: 8.75K).
As such, it represented a deliveries/production ratio of 84.6%, much lower than Tesla’s (TSLA) 95.9% in its recent deliveries update for Q1.
Therefore, it wasn’t an encouraging report, even though Rivian’s delivery ramp met Wall Street’s revised expectations following the company’s downgraded production outlook.
Rivian is expected to accelerate its ramp in H2’23 to meet its 50K production outlook for 2023. However, that ramp is expected to occur within a potential backdrop of overproduction, potentially affecting its deliveries/production ratio.
UBS (UBS) noted in a recent commentary that global auto production could overshoot its forecasts in 2023 by nearly 5M units. Notwithstanding, it represented a sales/production ratio of 94.4%, still much better than Rivian’s metric, suggesting that the EV upstart could struggle to gain market share in a challenging economic environment.
Tesla’s ongoing price cuts have been relatively successful. Also, Tesla is expected to continue its price adjustments further as it attempts to hamper the efforts of its EV peers and auto OEMs in their bid to stake their foothold in the market.
As such, the only company that has managed to carve out its dominance against Tesla’s market leadership is BYD Company (OTCPK:BYDDY). It has raised the stakes against the US EV leader, targeting up to 3.6M in sales for 2023.
Notwithstanding, Rivian’s focus on the higher-end segment likely mitigated the impact of the changes in the $7.5K EV credits from April 18, as some of its peers like Ford (F) and Tesla will have to deal with potentially lower EV credits.
Therefore, it will be helpful to assess whether Rivian’s Q2 deliveries/production ratio could improve further as its US peers lose some momentum from gaining the full credits.
CFO Claire McDonough updated in a recent April conference that Rivian is not expected to launch a direct Tesla Model Y challenger until 2026. Rivian expects the R2 to be in the “semi-mass market price point” with a production capacity of 200K. Hence, it’s still likely priced at a premium, bolstering the company’s ability to reach its gross margin target.
Wall Street estimates are still pretty downbeat over Rivian’s gross margin estimates by FY26. Rivian is expected to have an R1+R2 capacity of about 285K by then, which doesn’t include Amazon’s (AMZN) EDV figures.
Rivian is projected to deliver an average gross margin of 16.6% in FY26 from FY23’s 2% estimate.
However, Tesla garnered an automotive gross margin of 18.4% in FY18, based on a production slate of about 255K. Therefore, the modeling of Rivian’s ramp is not overly aggressive but indicates that the company must resolve its supply chain challenges while ramping production efficiently.
And that’s still a “big if” for now. Moreover, the volume launch of Rivian’s R2 line in 2026 is expected to join the deluge of vehicles that will be launched by then. Ford expects to produce an annualized rate of 2M EVs by 2026, coupled with General Motors’ 1M target by 2025.
Therefore, Rivian’s ability to compete will likely be focused on its ability to sell ad gain share, as its thesis is predicated on a volume ramp that’s likely only from 2026.
Investors’ sentiments will likely continue to be volatile, with sentiments expected to be negative.
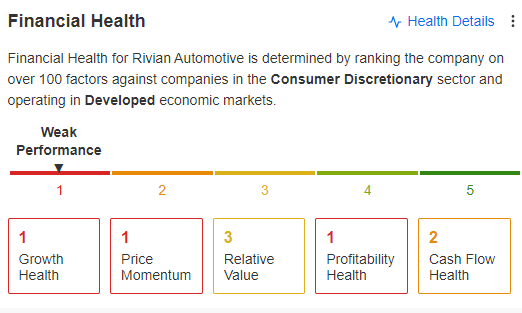
RIVN factors rating (InvestingPro)
Seeking Alpha’s Quant ratings indicates the second-worst possible rating: Sell. InvestingPro’s factors also suggest the worst possible rating: Weak performance. Morningstar’s rating indicates RIVN has no economic moat (worst possible), with its fair value uncertainty at the highest: Extreme.
Hence, investors deciding whether to add RIVN are encouraged to consider a significant margin of safety, which we don’t find at the current levels.
While its price action is constructive of a bottom in March, we prefer a deeper pullback toward those zones, which we think should provide a more favorable risk/reward for a speculative opportunity.
As such, we move to the sidelines from here.
Rating: Hold (Revised from Speculative Buy). See additional disclosure below for important notes accompanying the thesis presented.
Editor’s Note: This article discusses one or more securities that do not trade on a major U.S. exchange. Please be aware of the risks associated with these stocks.
Analyst’s Disclosure: I/we have a beneficial long position in the shares of F, TSLA, AMZN either through stock ownership, options, or other derivatives. I wrote this article myself, and it expresses my own opinions. I am not receiving compensation for it (other than from Seeking Alpha). I have no business relationship with any company whose stock is mentioned in this article.
Important note: Investors are reminded to do their own due diligence and not rely on the information provided as financial advice. Our cautious/speculative ratings carry a higher risk profile. They are only intended for sophisticated investors/traders. We urge new or inexperienced investors to avoid relying on such ratings. The rating is also not intended to time a specific entry/exit at the point of writing unless otherwise specified. Moreover, investors must exercise prudence and devise appropriate risk management strategies, such as pre-defined stop-loss/profit-taking targets, within a suitable risk exposure.
Seeking Alpha’s Disclosure: Past performance is no guarantee of future results. No recommendation or advice is being given as to whether any investment is suitable for a particular investor. Any views or opinions expressed above may not reflect those of Seeking Alpha as a whole. Seeking Alpha is not a licensed securities dealer, broker or US investment adviser or investment bank. Our analysts are third party authors that include both professional investors and individual investors who may not be licensed or certified by any institute or regulatory body.
A Unique Price Action-based Growth Investing Service
- We believe price action is a leading indicator.
- We called the TSLA top in late 2021.
- We then picked TSLA’s bottom in December 2022.
- We updated members that the NASDAQ had long-term bearish price action signals in November 2021.
- We told members that the S&P 500 likely bottomed in October 2022.
- Members navigated the turning points of the market confidently in our service.
- Members tuned out the noise in the financial media and focused on what really matters: Price Action.
Sign up now for a Risk-Free 14-Day free trial!

