Summary:
- Rocket Lab is second only to SpaceX in the space industry, and the much anticipated launch of Neutron late this year will further cement its position in the industry.
- Electron launches were profitable for the first time in 2023 and the improved revenue per launch in Q4 will further boost margins in 2024.
- I expect Rocket Lab to reach $35.52 per share by the end of 2030 due to the revenue growth driven by Neutron launches and the expected increase in Electron cadence.
- Any Neutron launch failures could drag down Rocket Lab’s valuation, similar to Electron’s latest failed launch in September 2023.
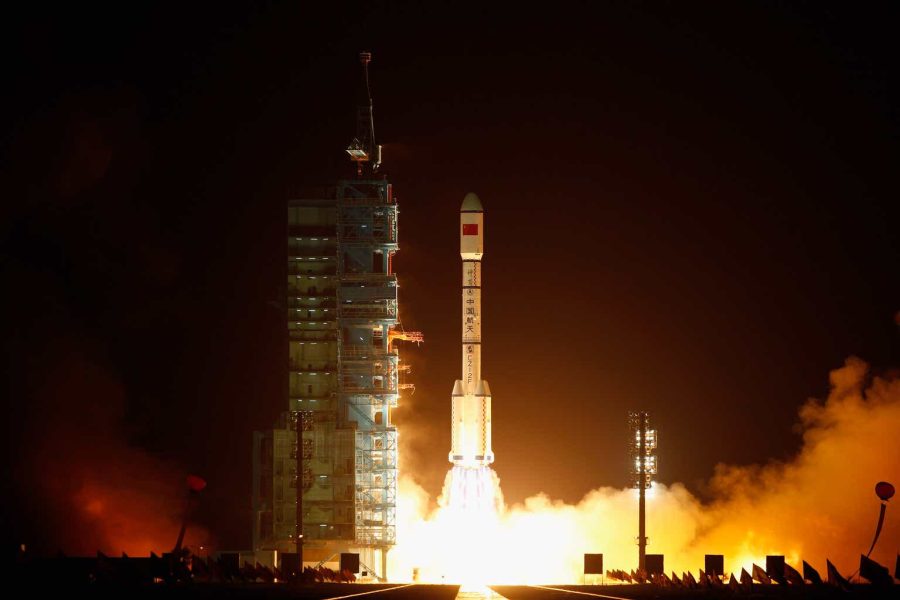
Lintao Zhang/Getty Images News
2024 is a defining year for Rocket Lab USA (NASDAQ:RKLB). The company is in a race against time to launch its new Neutron rocket by December 15, 2024 to secure launch contracts under the third phase of the National Space Security Launch program. In addition, the company’s Electron rocket is on track to have its busiest year to date as it has completed 2 launches and has 23 additional launches booked this year. With that in mind, management expects Electron launches this year to range from mid to high 30s, with the capacity to support 52 launches per year.
So with Neutron’s launch closer than ever and demand for Electron is at an all-time high, I believe Rocket Lab is a bargain at current levels due to its expected revenue growth in the coming 6 years. Therefore, I’m rating Rocket Lab as a strong buy with a price target of $35.52 per share by the end of 2030.
Company Overview
Rocket Lab is an end to end space company that delivers launch services, spacecraft design services, spacecraft components, spacecraft manufacturing and other spacecraft and on-orbit management solutions. The company’s launch segment is currently dependent on Electron, a small launch vehicle, that went on 44 missions, 40 of which were successful. The company is also developing Neutron, a medium lift launch vehicle, that is expected to have a payload capacity of about 15 thousand kg, a feat Electron is incapable of achieving. As such, Rocket Lab’s growth potential is mainly dependent on its success in launching Neutron, since it will have more uses compared to Electron.
Electron Launches Are Finally Profitable
As Rocket Lab is still in its early stages, it has been losing money since its inception. However, the recently posted 2023 annual report showed signs that the company is moving in the right direction. In 2023, Rocket Lab’s revenues grew 16% YoY to $245.5 million, driven by an increase in launches from 9 to 10 in addition to 15% growth in the space systems segment. While that may seem like a modest increase, the company’s margins improved substantially from 9% in 2022 to 21% in 2023.
So how did the company’s margins more than doubled in a year? The main factor contributing to this margin expansion is improving launch economics. In 2023, Rocket Lab realized $71.8 million in launch services revenue from 10 launches, while its cost of revenue was $63.8 million. This means that the company realized around $7.1 million per launch while incurring $6.3 million in costs related to launches, which resulted in a gross margin of 11.2% for the launch services segment. This is the first time in Rocket Lab’s history that its launch segment is profitable, as its margins have been negative over the years.
Annual Filings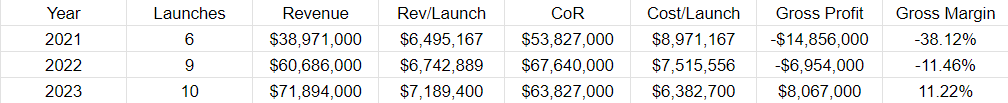
Rocket Lab’s management attributed the segment’s positive margins to the increase in launches as well as improving revenue per launch in the latest earnings call. With that in mind, Rocket Lab has a target average selling price of $7.5 million per launch and expects it to reach $8.5 million in the future. While the company didn’t quite reach its target in 2023, it reached its guidance in Q4 as it booked $8.5 million in launch services revenue from 1 launch only.
For 2024, the company has 25 booked Electron launches, of which 2 were successful. Moreover, the company projects Electron’s cadence to range from mid to high 30s this year. As such, I expect Rocket Lab’s margins to continue improving as its Electron launch cadence reaches the maximum capacity of 52 launches per year.
On that note, the small launch market is expected to grow at a CAGR of 11.5% from 2023 to 2030. Assuming Electron’s launch cadence in 2024 is 35, the lower end of management’s forecast, my projections for Electron launches and revenues until 2030 are as follows.
|
Year |
Electron Launches |
Electron Rev/Launch |
Electron Revenue |
|
2025 |
39 |
$8,500,000 |
$331,712,500 |
|
2026 |
44 |
$8,500,000 |
$369,859,438 |
|
2027 |
49 |
$8,500,000 |
$412,393,273 |
|
2028 |
52 |
$8,500,000 |
$442,000,000 |
|
2029 |
52 |
$8,500,000 |
$442,000,000 |
|
2030 |
52 |
$8,500,000 |
$442,000,000 |
*Assuming an $8.5 million revenue per Electron launch.
Based on this, I expect the company to start expanding Electron capacity in 2027 to meet the expected demand for small launches.
Neutron Launch And Projected Revenues
While it’s been reported that Rocket Lab may be misrepresenting its readiness to launch Neutron before the deadline to secure NSSL Phase 3 contracts, management reiterated its expectation of launching Neutron ahead of the deadline. This doesn’t necessarily mean that the company will realize revenues from Neutron launches this year. However, it is a positive sign for 2025 and beyond.
Neutron is set to rival both of SpaceX’s Falcon 9 rocket family and ULA’s Vulcan rocket, which went on its first mission in January this year, with a targeted launch price of $50 million. In the Q4 earnings call, management reiterated its aim of 3 Neutron launches in 2025. However, I believe that’s an aggressive target and a similar trajectory to Falcon 9 is more realistic.
The first version of Falcon 9 was launched 5 times from June 2010 to March 2013 and the second version was launched 15 times from September 2013 to January 2016. As such, I expect Neutron launches to be 1 in 2025, 2 in 2026, 3 in 2027, and 5 in each of 2028, 2029, and 2030. This means that Rocket Lab’s revenues from Neutron launches in its first 6 years based on my projections are as follows.
|
Year |
Neutron Launches |
Neutron Rev/Launch |
Neutron Revenues |
|
2025 |
1 |
$50,000,000 |
$50,000,000 |
|
2026 |
2 |
$50,000,000 |
$100,000,000 |
|
2027 |
3 |
$50,000,000 |
$150,000,000 |
|
2028 |
5 |
$50,000,000 |
$250,000,000 |
|
2029 |
5 |
$50,000,000 |
$250,000,000 |
|
2030 |
5 |
$50,000,000 |
$250,000,000 |
Based on the projected Electron and Neutron revenues, my projections for the launch services segment’s revenues are as follows.
|
Year |
Neutron Revenue |
Electron Revenue |
Total Revenue |
|
2025 |
$50,000,000 |
$331,712,500 |
$610,105,605 |
|
2026 |
$100,000,000 |
$369,859,438 |
$732,511,508 |
|
2027 |
$150,000,000 |
$412,393,273 |
$864,443,154 |
|
2028 |
$250,000,000 |
$442,000,000 |
$1,039,357,364 |
|
2029 |
$250,000,000 |
$442,000,000 |
$1,091,460,968 |
|
2030 |
$250,000,000 |
$442,000,000 |
$1,151,380,113 |
Space Systems Segment Is Overlooked
Although most investors are focused on Rocket Lab’s launch segment, I believe the bigger opportunity is in the space systems segment. In Q4 2023, the segment’s backlog grew 106% YoY from $387.4 million to $797.8 million, of which 41% is expected to be realized in 2024 or around $327.1 million. With that in mind, the space economy market is expected to grow at a CAGR of 11.5% from 2023 to 2030. Based on this, my projections for Rocket Lab’s space systems revenues in the next 6 years are as follows.
|
Year |
Space Systems Revenue |
|
2025 |
$364,714,270 |
|
2026 |
$406,656,411 |
|
2027 |
$453,421,898 |
|
2028 |
$505,565,417 |
|
2029 |
$563,705,440 |
|
2030 |
$628,531,565 |
That said, my projections may vary if the company secures additional deals during that period or if the space economy witnesses stronger growth.
By adding my projected revenues for each of Rocket Lab’s segments, the company could be on track to post the following revenues in the next 6 years which brings us to the valuation part and my price target for Rocket Lab.
|
Year |
Launch Revenue |
Space Systems Revenue |
Total Revenue |
|
2025 |
$381,712,500 |
$364,714,270 |
$746,426,770 |
|
2026 |
$469,859,438 |
$406,656,411 |
$876,515,849 |
|
2027 |
$562,393,273 |
$453,421,898 |
$1,015,815,171 |
|
2028 |
$692,000,000 |
$505,565,417 |
$1,197,565,417 |
|
2029 |
$692,000,000 |
$563,705,440 |
$1,255,705,440 |
|
2030 |
$692,000,000 |
$628,531,565 |
$1,320,531,565 |
Valuation
Based on my projected revenues, Rocket Lab is trading at these P/S multiples relative to each year’s sales at the current share price of $4.42 per share.
| Year | Projected Revenues |
P/S Ratio |
|
2025 |
$746,426,770 |
2.90 |
|
2026 |
$876,515,849 |
2.47 |
|
2027 |
$1,015,815,171 |
2.13 |
|
2028 |
$1,197,565,417 |
1.81 |
|
2029 |
$1,255,705,440 |
1.72 |
|
2030 |
$1,320,531,565 |
1.64 |
In my opinion, these multiples are extremely low for a company with such revenue growth potential. As is, SpaceX, Rocket Lab’s main competitor in my opinion, is reportedly valued at $175 billion, per Bloomberg. Considering that SpaceX is expected to generate $13.3 billion in revenues this year, this means that SpaceX is valued at 13.16 times its projected 2024 sales.
Accordingly, I believe Rocket Lab to be valued at a similar multiple to SpaceX once Neutron is launched, which has led me to the following price targets.
| Year | Total Revenue | P/S Ratio | PT at SpaceX’s P/S | Upside |
| 2025 | $746,426,770 | 2.90 | $20.08 | 354% |
| 2026 | $876,515,849 | 2.47 | $23.58 | 433% |
| 2027 | $1,015,815,171 | 2.13 | $27.33 | 518% |
| 2028 | $1,197,565,417 | 1.81 | $32.21 | 629% |
| 2029 | $1,255,705,440 | 1.72 | $33.78 | 664% |
| 2030 | $1,320,531,565 | 1.64 | $35.52 | 704% |
Risks
As is the case with all space companies, there is high risk associated with investing in Rocket Lab. The biggest risk in my opinion is launch failures since they could set back the company as shown in its latest failed launch which led it to launch only 1 mission in Q4 2023. In addition, Neutron may fail in its initial launches similar to Falcon 9 which failed in its first 3 launches. As such, the company’s losses would increase, which could lead to capital raises.
Another risk to consider is competition. While Rocket Lab is currently second to SpaceX in the space industry, ULA could outperform Rocket Lab since Vulcan’s payload is higher than that of Neutron at 19 thousand kg. At the same time, Blue Origin recently unveiled its New Glenn rocket with 13 thousand kg payload, which will also compete with Neutron. Therefore, if Rocket Lab fails to launch Neutron ahead of the NSSL deadline, its competitors would be well positioned to gain market share, which would negatively impact Rocket Lab.
Conclusion
I’m rating Rocket Lab as a strong buy given the company’s growth potential due to the growing demand for Electron launches, the anticipated launch of Electron, and the solid growth potential of its space systems segment. All of these factors should reflect on Rocket Lab’s valuation in the coming years and help it reach my price target of $35.52 per share by the end of 2030, representing 704% upside from the current share price of $4.42.
Analyst’s Disclosure: I/we have no stock, option or similar derivative position in any of the companies mentioned, and no plans to initiate any such positions within the next 72 hours. I wrote this article myself, and it expresses my own opinions. I am not receiving compensation for it (other than from Seeking Alpha). I have no business relationship with any company whose stock is mentioned in this article.
Seeking Alpha’s Disclosure: Past performance is no guarantee of future results. No recommendation or advice is being given as to whether any investment is suitable for a particular investor. Any views or opinions expressed above may not reflect those of Seeking Alpha as a whole. Seeking Alpha is not a licensed securities dealer, broker or US investment adviser or investment bank. Our analysts are third party authors that include both professional investors and individual investors who may not be licensed or certified by any institute or regulatory body.