Summary:
- Salesforce Valuation Update: Fair price at $305, slightly below current $306.08, indicating a hold rating with limited upside.
- Growth Plans and Market Position: Targeting $50B revenue by 2026, holds 12.3% market share in $282.20B SaaS market.
- Industry Outlook and Addressable Market: SaaS market expected to grow at 7.33% CAGR, Salesforce’s addressable market to reach $952.56B by 2029.
- DCF Model Analysis: Future stock price projected at $562.38, offering 14% annual returns through 2029, closely tracking market performance.
- Comparison with Consensus Estimates and Risks: Potential overvaluation of 17.4% indicated by consensus estimates.

Stephen Lam
Thesis
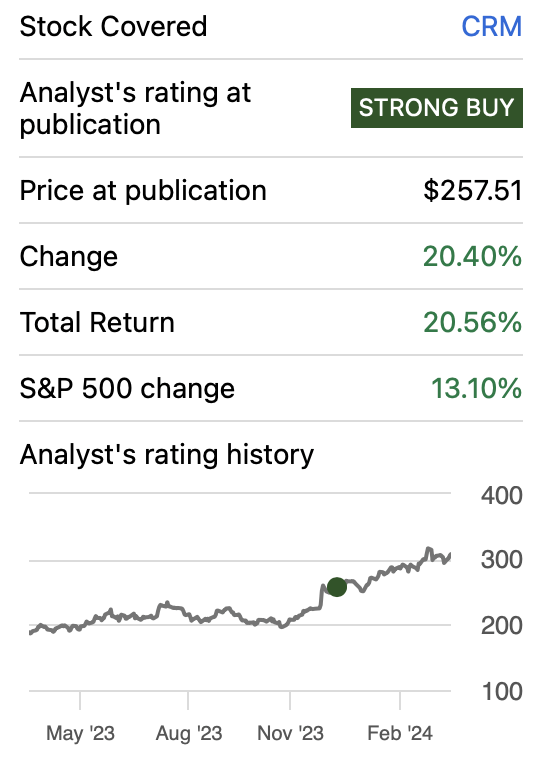
In my previous article about Salesforce, Inc, (NYSE:CRM), I assigned the stock a strong buy rating, explaining that even though the stock had rallied by 27% previous to that release, according to my valuation models, the stock still had a decent upside of 18.18%, from the stock price then of $252.6, if it adjusted to my fair price estimate of $299.1. Since then the stock has rallied by 20.18%.
After updating my valuation model with the information from Q4 2024, I concluded that Salesforce is now fairly valued since its fair price is around $305. The future price calculated is $562.38, which translates into low 11.8% annual returns throughout 2029.
Additionally, I also conducted some tests on the DCF model, such as increasing my EPS estimates by $0.50 (about $485.5 million when multiplied by the total amount of shares outstanding) at which the fair price was just 1.8% higher than the current stock price of $306.08. This means that Salesforce would need to make a significant effort to make its stock undervalued. For this reason, I rate the stock as a hold.
Seeking Alpha
Overview
Salesforce Growth Plan
Salesforce has placed a 2026 revenue target of $50B, which from today’s $34.85B, means an annual revenue growth of 11.8%. To achieve this, Salesforce aimed to expand its business rapidly across the world. This was achieved by offering SaaS configured in the local language and the local currency. Furthermore, in their FY2024 10-K, they also mention that they aim to innovate and expand relationships with existing customers and M&As.
How Does Salesforce Compare Against Peers?
Salesforce is a SaaS giant with a market share of around 12.3%. The other companies that offer similar products to Salesforce in the SaaS market are, SAP SE (SAP), which has a market share of around 6.98% (after subtracting around $11.49B in license support). The other competitor is Oracle Corporation (ORCL) with a market share of 6.33%. These numbers were calculated by dividing the companies’ SaaS revenue by the 2023 SaaS market volume of $282.20B.
Industry Outlook
The Worldwide Software-as-a-service market had a market volume of around $282.20B in 2023, and it is expected to reach $374.50B by 2028. This last one means that the market is expected to grow at a CAGR of 7.33%.
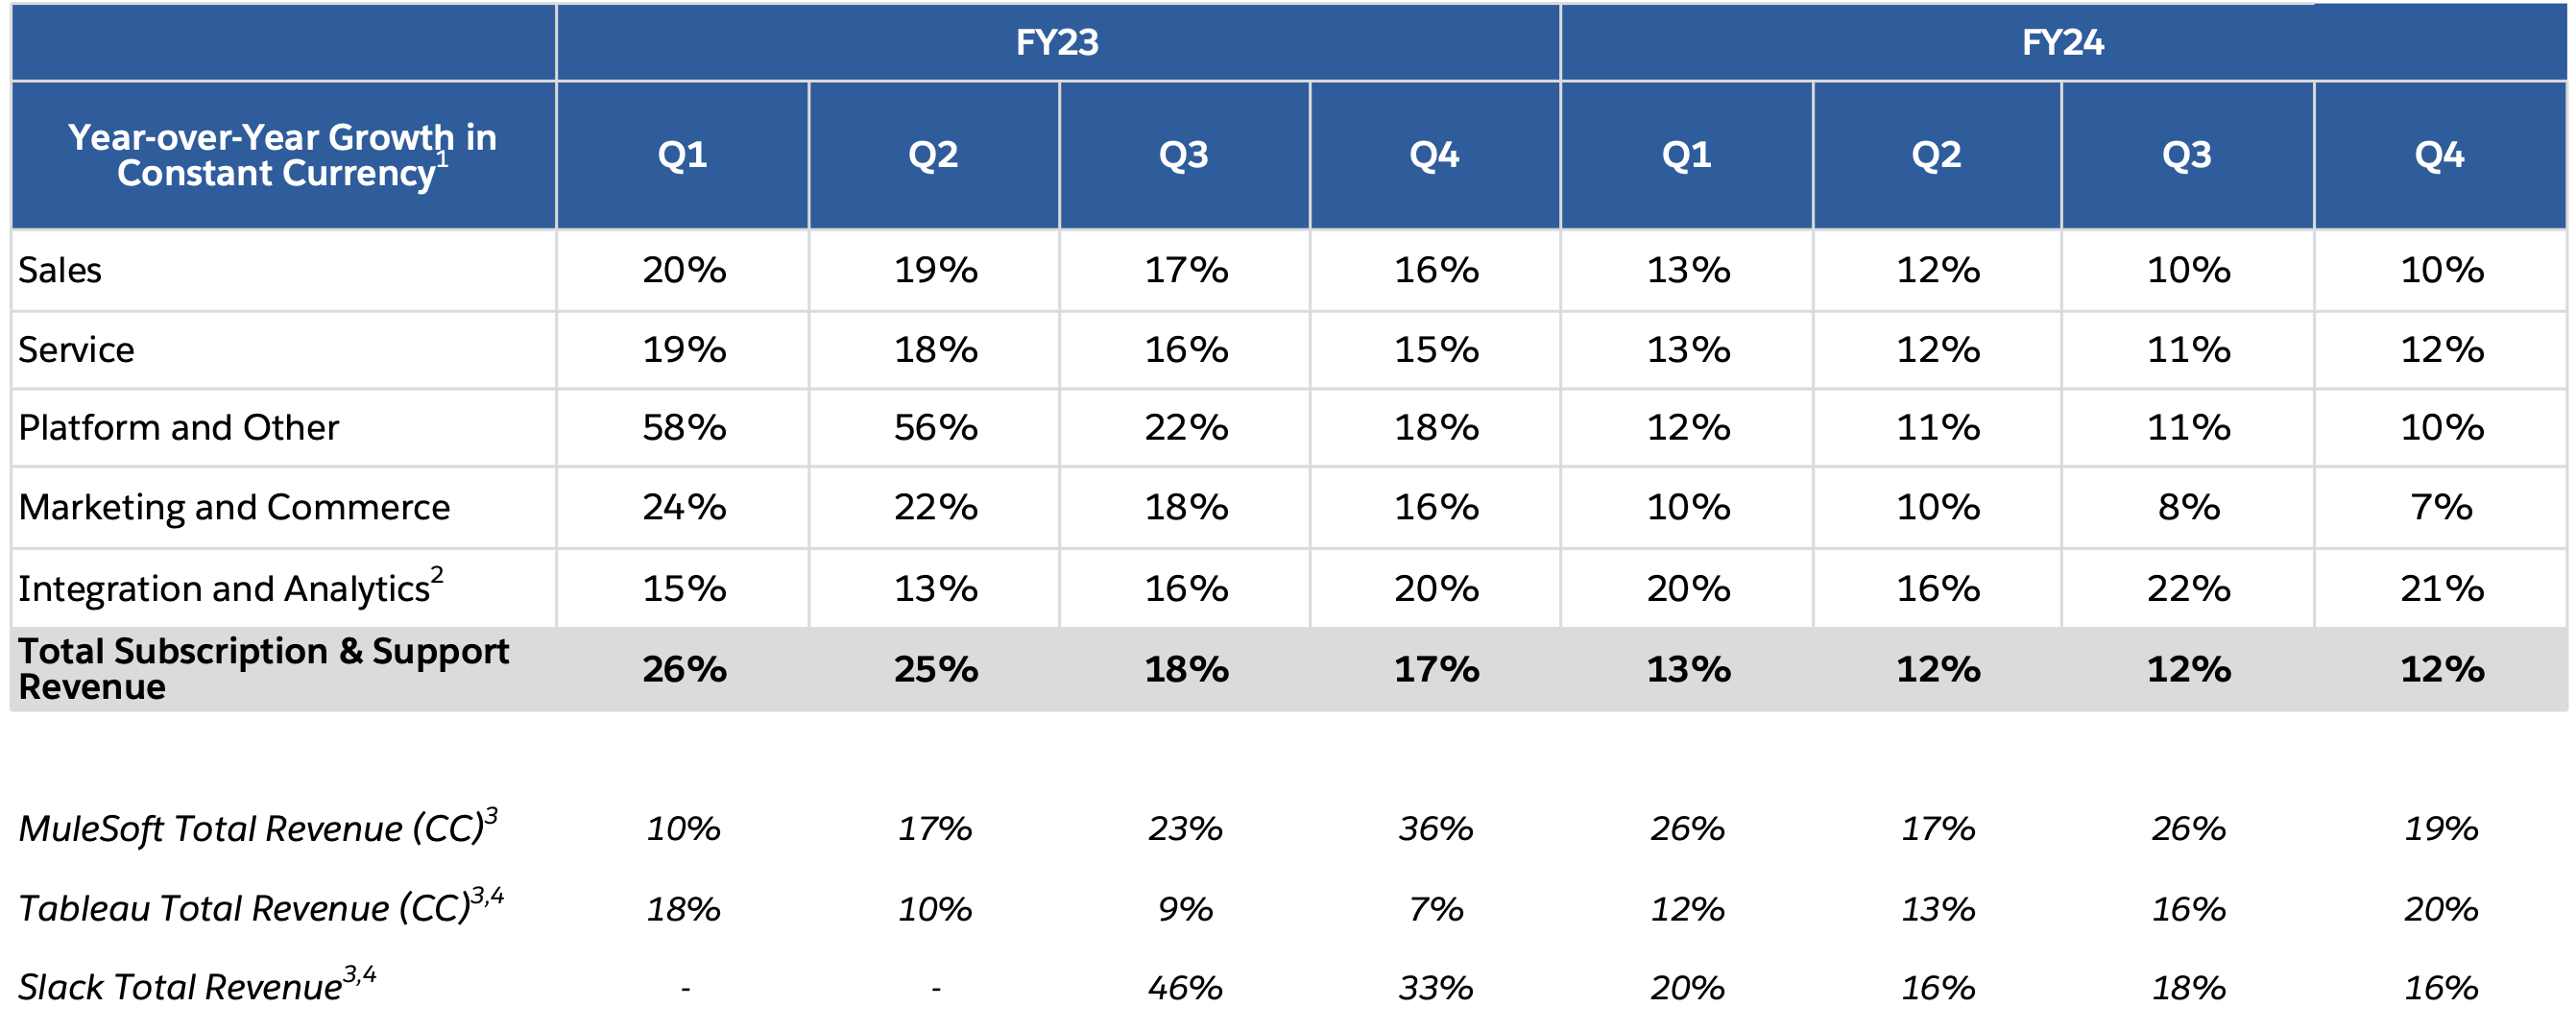
However, there is a segment in Salesforce that grows faster than others, and that is Integration and Analytics, which in FY2023 grew by 20% and by 21% in FY2024. The reason behind this is the market, particularly the worldwide data analytics markets, which has an estimated CAGR of 18.77% from 2024 to 2028.
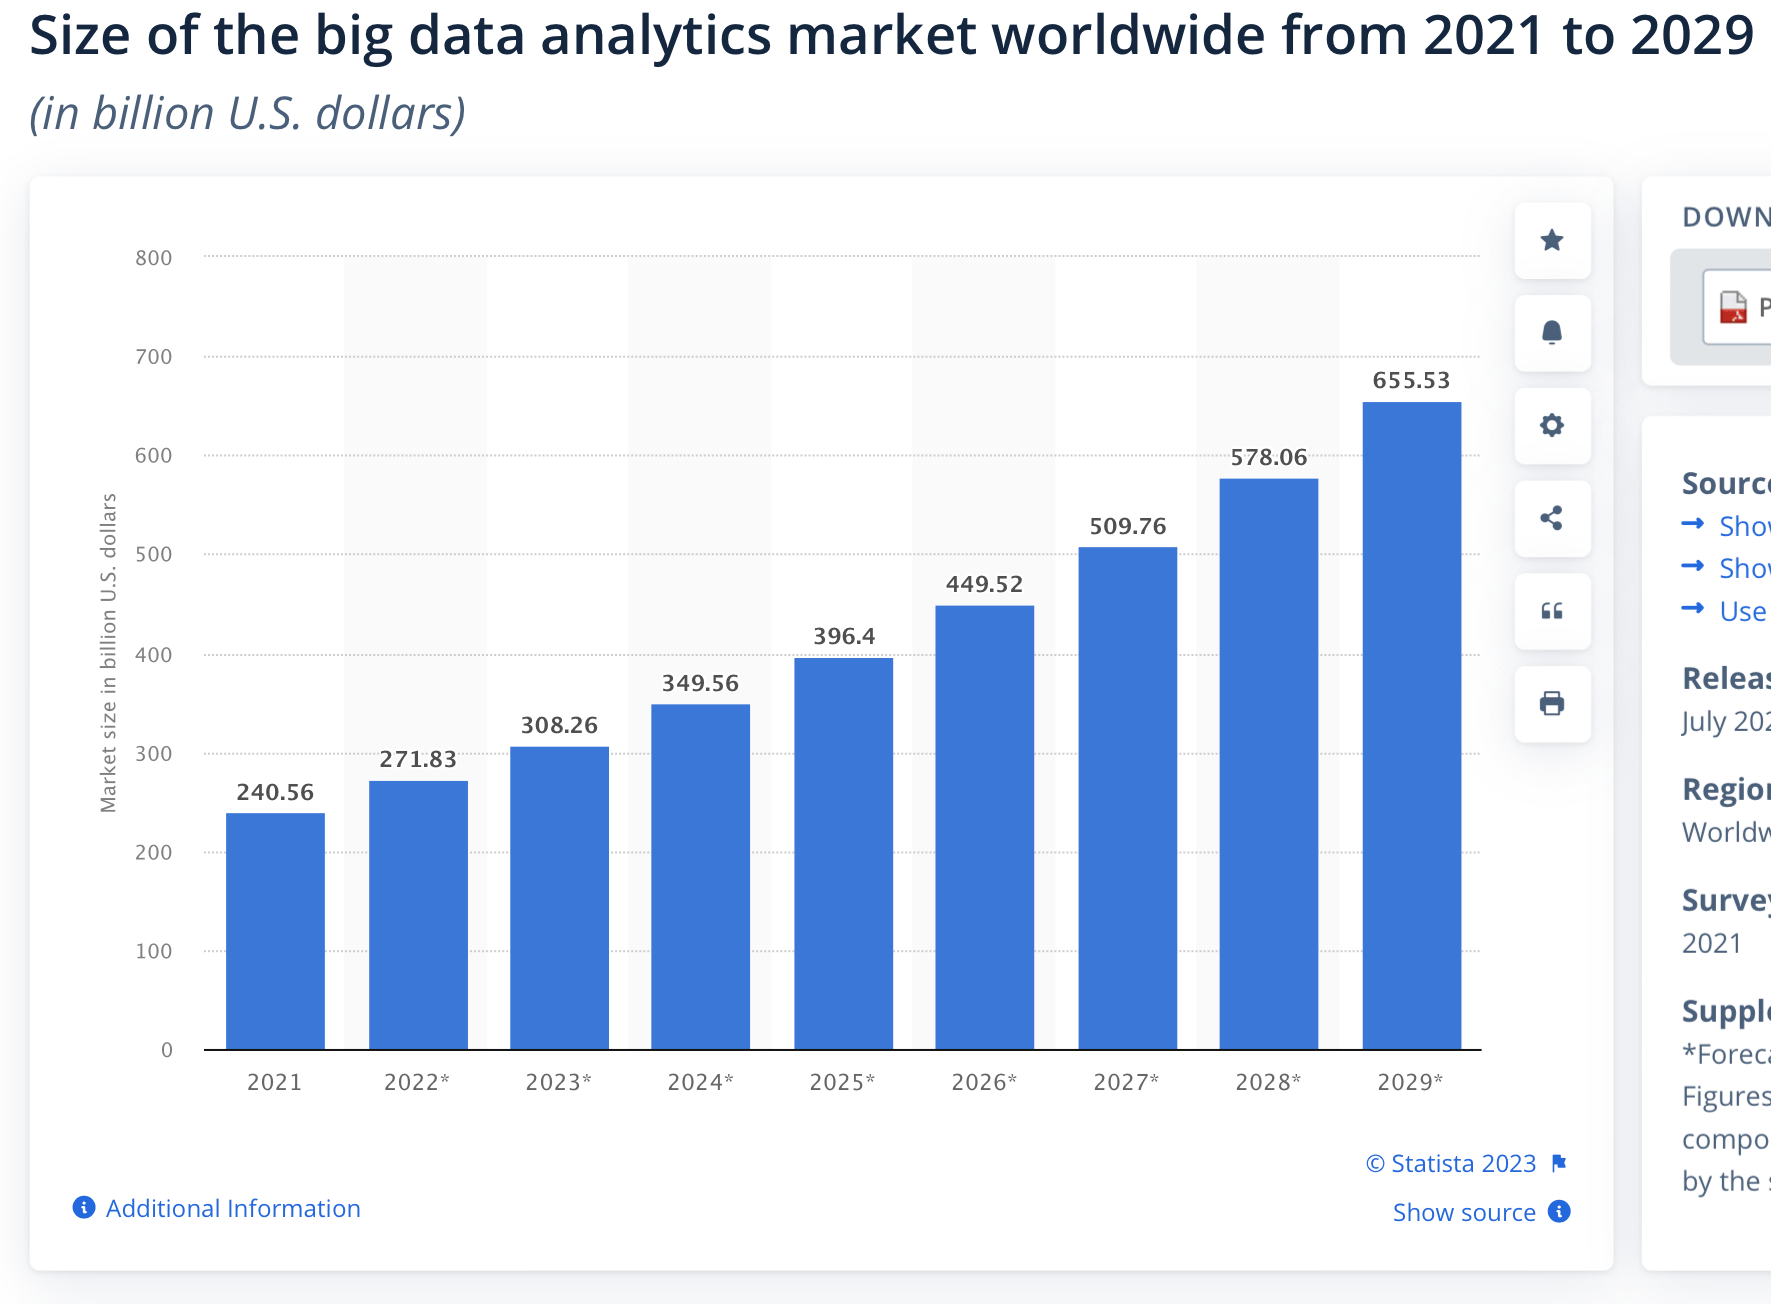
Statista
These numbers mean that Salesforce’s current addressable market stands at around $590.46B and for 2029, it will reach $952.56B, which is a 12.26% annual expansion of Salesforce’s addressable market.
Valuation
To calculate the fair price of Salesforce, I will employ a DCF model. In the table below you can see all the current financial information (as of Q4 2024) that is necessary for the models.
The WACC will be calculated with the already-known formula. For Salesforce, the WACC came out at 11.27%. If you want to see a more detailed process you can check the section labeled “WACC Calculation” in the DCF model.
| TABLE OF ASSUMPTIONS | |
| (Current data) | |
| Assumptions Part 1 | |
| Equity Market Price | 296,900.00 |
| Debt Value | 13,562.00 |
| Cost of Debt | 0.21% |
| Tax Rate | 16.418% |
| 10y Treasury | 4.320% |
| Beta | 1.21 |
| Market Return | 10.50% |
| Cost of Equity | 11.80% |
| Assumptions Part 2 | |
| CapEx | 736.00 |
| Capex Margin | 2.11% |
| Net Income | 4,136.00 |
| Interest | 29.00 |
| Tax | 814.00 |
| D&A | 2,059.00 |
| Ebitda | 7,038.00 |
| D&A Margin | 5.91% |
| Interest Expense Margin | 0.08% |
| Revenue | 34,857.0 |
The first step in projecting revenues is pricing. Last year, Salesforce announced a 9% price increase for new customers and existing customers that were adding new clouds. This price increase became effective in August 2023. Before this, Salesforce had 7 years without price increases.
I think that there are two reasons for this: 1) Inflation in the period 2021-2023 was very high and therefore employees started demanding higher pay, and 2) Oracle increased prices by 8%, so Salesforce in doing so, will not become less competitive than Oracle, which sells similar SaaS as Salesforce for managing enterprise resources.
The next important thing to know is how much each of Salesforce’s products represents as a percentage of total subscription and support revenue. To do this I searched and I found the graph below by Statista which divides the revenue of FY2023 by product.
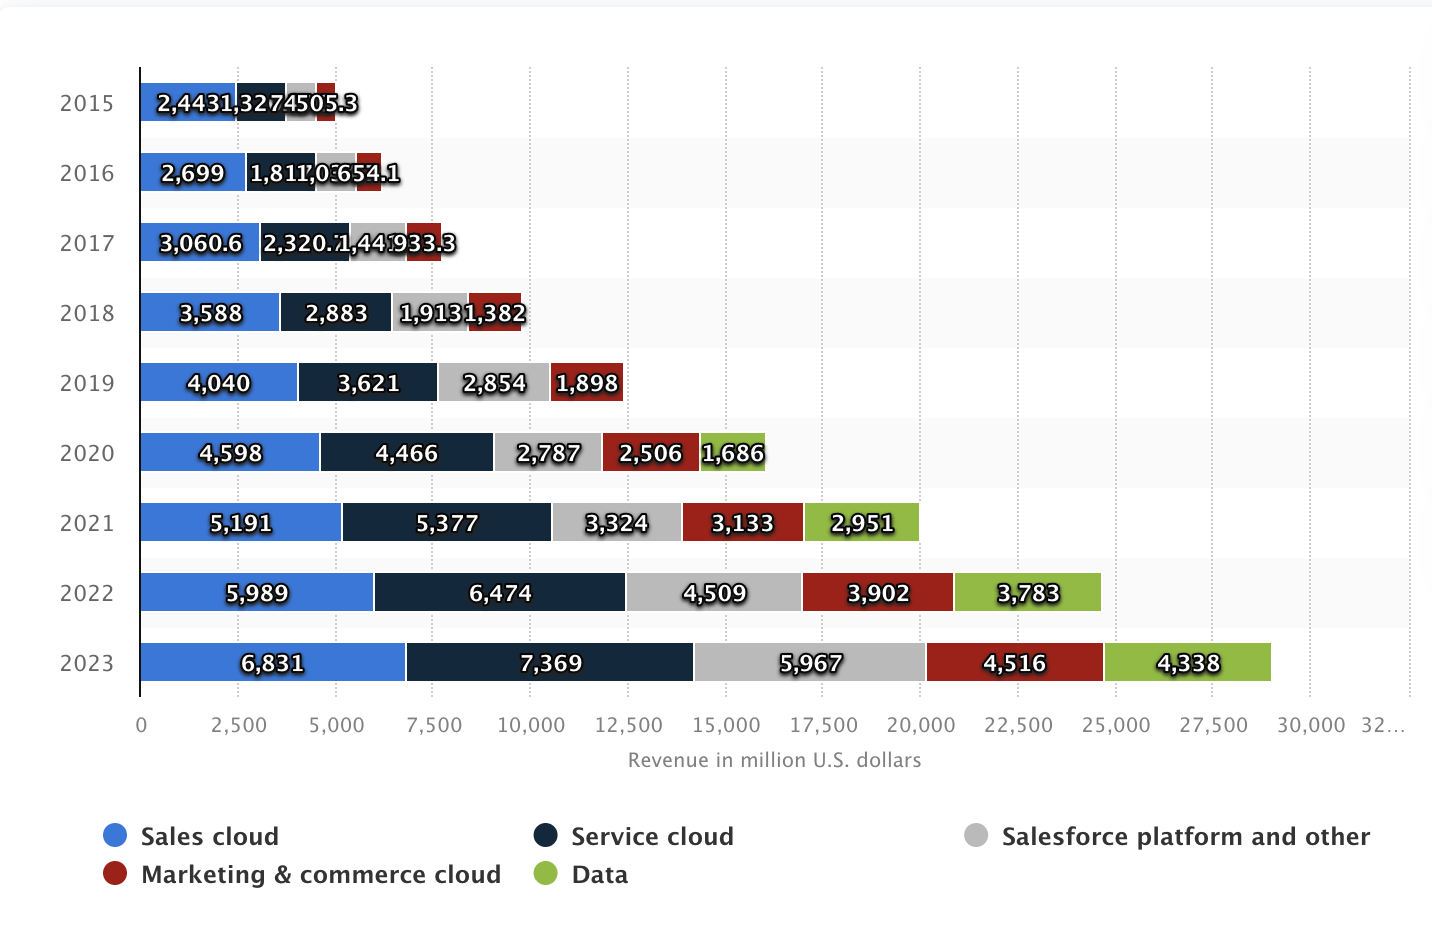
Statista
Lastly, in the overview section, I said that the revenue of the SaaS market according to Statista was expected to grow at a CAGR of 7.33% throughout 2028, however, there are a lot of other estimates that go as high as suggesting a CAGR of 19.7% throughout 2030. Therefore to project the user base growth for the different products that Salesforce offers, I will calculate the average of those two. The result was 13.51%. Meanwhile, the “Integration and Analytics segment will grow its user base at a rate of 18.77% annually.
Now, in what concerns price increases, since Salesforce before 2023 (where it increased pricing by around 9) never increased prices, I will assume that they will continue price hikes but at a 2% rate, close to the FED’s inflation target, and for Integration and Analytics, it will not rise prices throughout all the projection. The reason for this is because I think that expansion enabled Salesforce to increase its revenue without the need of increased pricing.
Q4 2024 Investor’s Presentation
| Sales | Service | Platform and Other | Marketing and Commerce | Integration and Analytics | |
| FY 2024 | 7,594.7 | 8,192.8 | 6,634.1 | 5,020.9 | 4,823.0 |
| FY 2025 | 8,641.2 | 9,321.8 | 7,548.3 | 5,712.8 | 5,728.2 |
| FY 2026 | 9,832.0 | 10,606.4 | 8,588.4 | 6,500.0 | 6,803.4 |
| FY 2027 | 11,186.9 | 12,067.9 | 9,771.9 | 7,395.7 | 8,080.4 |
| FY 2028 | 12,728.5 | 13,730.9 | 11,118.5 | 8,414.8 | 9,597.1 |
| FY 2029 | 14,482.5 | 15,623.1 | 12,650.7 | 9,574.4 | 11,398.5 |
| FY 2030 | 16,478.2 | 17,776.0 | 14,394.0 | 10,893.8 | 13,538.0 |
| % of Total Revenue | 21.79% | 23.50% | 19.03% | 14.40% | 13.81.8% |
| Price Increase | 2.00% | 2.00% | 2.00% | 2.00% | 0.00% |
| Customer Base Increase | 13.51% | 13.51% | 13.51% | 13.51% | 18.77% |
Lastly, I will predict net income with the help of the net income margins that are derived from the average consensus if we divide the non-GAAP net income by estimated revenues.
| Net Income Margin % | |
| FY 2025 | 24.99% |
| FY 2026 | 25.61.8% |
| FY 2027 | 27.07% |
| FY 2028 | 26.30% |
| FY 2029 | 26.66% |
| FY 2030 | 26.78% |
| Revenue | Net Income | Plus Taxes | Plus D&A | Plus Interest | |
| FY 2025 | $39,272.3 | $9,814.15 | $11,428.03 | $13,747.84 | $13,776.84 |
| FY 2026 | $44,650.2 | $11,448.32 | $13,330.93 | $15,650.74 | $15,678.93 |
| FY 2027 | $50,822.9 | $13,757.76 | $16,020.14 | $19,022.25 | $19,049.64 |
| FY 2028 | $57,909.9 | $15,230.30 | $17,734.84 | $21,155.57 | $21,182.19 |
| FY 2029 | $66,049.2 | $17,608.71 | $20,504.36 | $24,405.88 | $24,431.75 |
| FY 2030 | $75,399.9 | $20,192.10 | $23,512.58 | $27,966.45 | $27,991.60 |
| ^Final EBITA^ |

Author’s Calculations
As you can see, my model suggests that Salesforce is slightly overvalued, by 0.18%. This means that the fair stock price is $305. The future price of the stock stands at $562.38 which translates into annual returns of 11.8%, which is not much and slightly outperforms the market by a very thin margin.
How do my Estimates Compare against the Average Consensus?
If I did a model completely based on the available average estimates, I would reach a fair price per share of $252.97, which indicates that Salesforce is overvalued by around 17.18%, a considerable downside. Furthermore, the future stock price would be $465.74 which implies annual returns of around 8.7%, which means that this investment would potentially underperform the overall market.
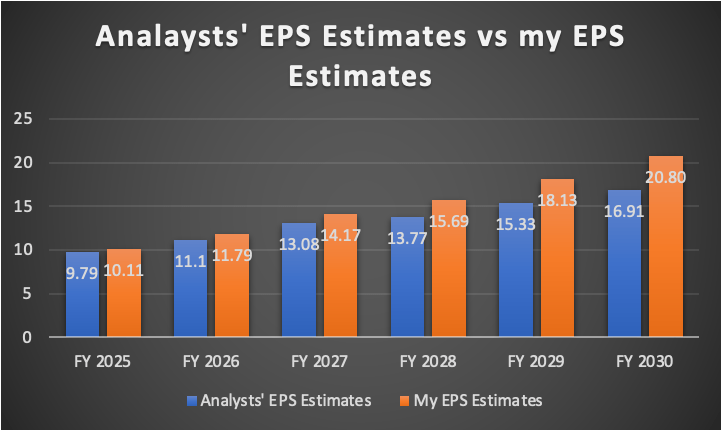
Now if you observe the resulting EPS targets from my model vs the average consensus, you will notice that for FY2025 Salesforce would need to beat EPS estimates by $0.32, which in nominal terms is $310.72 million. and for FY2030, the gap between my estimates and the average consensus widens. This means that Salesforce needs to achieve higher estimates to stay at the current stock price of $306.08.
I am not deeming my estimates impossible, but they are of course more optimistic than what other analysts are expecting and the safety margin displayed by my DCF is small.
Author’s Calculations
Risks to Thesis
First of all, I need to say that I tested multiple EPS beat scenarios, for example increasing each of my EPS estimates by $0.50, which only caused the fair price to become just 1.8% higher than the current stock price.

Author’s Calculations
The aforementioned statement means that Salesforce to offer a 20% upside or anything of that caliber, would need to do something incredible, perhaps like acquiring a competitor.
The only risk left with my thesis is that the average estimates go all the way up to 2034, which means that anybody doing an 11-year model, will certainly get a result suggesting that Salesforce is hugely undervalued. The main reason for this is that in a model like that, there will be more cash flows to discount, which will result in a higher fair price and future price.
Conclusion
In conclusion, Salesforce is no longer undervalued as it was when I wrote my first coverage. My DCF model suggests a fair stock price of $305 which is 0.1.8% lower than the current stock price of $306.08, and the future price suggested of $562.38, only leaves room for annual returns of 11.8% throughout 2029 (FY2030 for Salesforce). This is not enough safety margin as the suggested annual return is slightly over the historic performance of the market.
Furthermore, I experimented with the DCF model by increasing my already optimistic EPS estimates by $0.50 , and the stock was merely 1.8% undervalued. This means that Salesforce needs to do something spectacular to increase its earnings enough to make it an undervalued stock.
For those reasons, I am rating the stock as a hold. Salesforce is a good growth stock, and if in the future an opportunity opens, it should be taken.
Analyst’s Disclosure: I/we have no stock, option or similar derivative position in any of the companies mentioned, but may initiate a beneficial Long position through a purchase of the stock, or the purchase of call options or similar derivatives in CRM over the next 72 hours. I wrote this article myself, and it expresses my own opinions. I am not receiving compensation for it (other than from Seeking Alpha). I have no business relationship with any company whose stock is mentioned in this article.
Seeking Alpha’s Disclosure: Past performance is no guarantee of future results. No recommendation or advice is being given as to whether any investment is suitable for a particular investor. Any views or opinions expressed above may not reflect those of Seeking Alpha as a whole. Seeking Alpha is not a licensed securities dealer, broker or US investment adviser or investment bank. Our analysts are third party authors that include both professional investors and individual investors who may not be licensed or certified by any institute or regulatory body.