
Summary:
- Salesforce stocks are currently overvalued but present a positive outlook for future revenue growth and free cash flow generation.
- Despite recent revenue growth declines, the introduction of Data Cloud is expected to sustain growth rates and maintain market share dominance.
- With an improved profitability outlook and strong FCFF, Salesforce is positioned to benefit from AI industry developments, but waiting for a stock price correction is advised.
- The massive tech sell-off that recently occurred is a wake-up call for investors, as the tech market might be more inflated than it seems, and any minor discontent from Wall Street can imply severe price corrections.
CanY71
Executive Summary
Salesforce (NYSE:CRM) stocks are currently trading above their fair market price; however, the firm presents a positive outlook in terms of future revenue growth and free cash flow generation.
Despite the “poor” performances registered in fiscal 2024, and in Q1 of fiscal 2025, which saw revenue growth rates significantly declining compared to historical standards, we expect the recently introduced Data Cloud to help the firm sustain growth rates in the low-double-digits range and maintain its dominant market share in the software industry.
Thanks to the restructuring plan rolled out in fiscal 2024, Salesforce has significantly improved its profitability outlook, and we expect the company to deliver operating margins in the range of 35% and FCFFs well above the $15 billion threshold.
Despite the current prices implying a negative alpha of (3.7%), we consider the stock a BUY given how well-positioned Salesforce is to benefit from further developments in the AI industry and its renewed profitability. However, we soundly suggest waiting for stock prices to correct towards the firm’s intrinsic value to fully benefit from the company’s total return potential.
Source – Analyst’s composition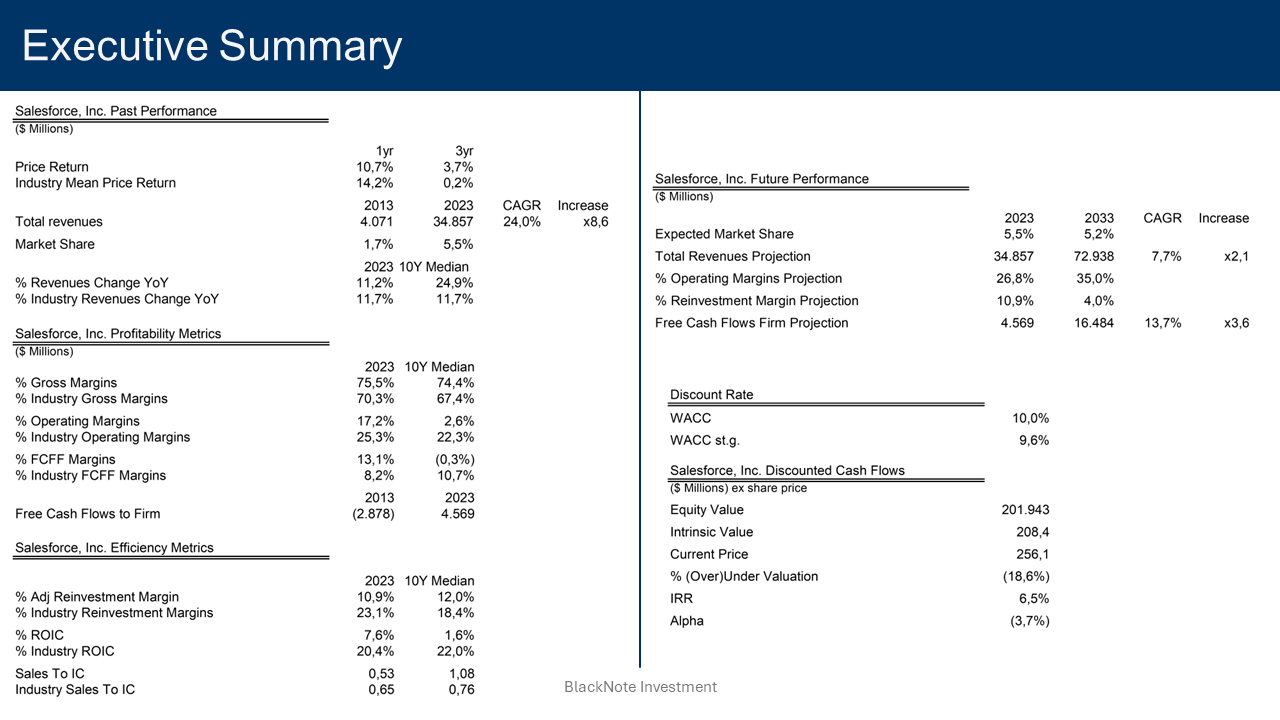
Operation Overview
Salesforce is a U.S. company leader in the customer relationship management (CRM) segment.
Salesforce offers software CRM solutions that help sales, marketing, and customer service teams manage customer data, improving customer engagement and sales conversions, and ultimately improving clients’ operating performance.
Salesforce’s primary software solutions include Sales Cloud, dedicated to sales teams; Service Cloud, dedicated to customer support teams; and Marketing Cloud, dedicated to marketing teams.
In addition to these three pillars, over the years Salesforce has acquired and implemented new technologies and platforms like Tableau, MuleSoft, and Slack, enriching its CRM suite, but the most promising solution offered by the firm is the recently introduced Data Cloud, the fast-growing product ever introduced by the company growing 90% y-o-y, an already accounting for $400 million in the 2024FY.
Salesforce’s Data Cloud permits organisations to ingest, unify, and process data generated from different departments, as well as third-party cloud solutions, thanks to an AI-powered data engine able to analyse metadata in real time and come up with useful insights which can be used to support sales, marketing and customer services workflows.
Although it might appear as a re-branding of the former Salesforce CDP (customer data platform), a marketing-focused platform used to unify customer data to create detailed customer profiles, Data Cloud is in reality an evolution of Salesforce CDP breaking out of the realm of marketing by creating a unified data platform gathering data from both Salesforce solutions and third-party data storage clouds like Snowflakes and AWS.
Despite at the moment, Data Cloud’s impact being insignificant when compared to the firm’s top line of nearly $40 billion, going forward it will represent a crucial allay to protect and maintain Salesforce’s dominant position in the ever-evolving software industry.
Data are the foundation of this new AI era, and Salesforce, thanks to its scale of operation – 3rd largest software company by revenues – has a massive advantage when it comes to collecting data from its customers as its CRM solutions are widely adopted by firms all over the globe. The more data, the more sophisticated, and competitive, AI technologies can be.
However, data alone are not sufficient to deliver the results AI technologies promise, organisations must need the help of tools like Data Cloud to collect, unify, and process those data to come up with useful, but more importantly, usable insights about their business operations.
Salesforce is likely the most well-positioned firm offering this kind of solution, thanks to its already huge scale and amount of data available to train AI models.
Currently, Salesforce generates revenues primarily from subscription fees paid by customers accessing the firm’s SaaS CRM solutions, however, with the introduction of Data Cloud, which is priced on a consumption basis – just like AWS, Google Cloud Platform (GCP), and Microsoft Azure prices their cloud computing solutions – down the road, we cannot exclude Salesforce introducing additional cloud services capitalizing of the enormous amount of data they will collect and process from now on.
Industry Overview
Salesforce, with its $34.8 billion in revenues in FY2024, has established a dominant presence in the software industry, representing 5.5% of the industry’s total revenues of $635.1 billion.
|
The software industry is moderately concentrated registering a Herfindahl–Hirschman index (HHI index) of 14.5, or 1.447 points.
The Herfindahl–Hirschman index is used to measure the level of competitiveness/concentration in an industry with an HHI below 0.15 (or 1.500 points) indicative of competitive industries while an HHI between 0.15 and 0.25 (or 1.500 and 2.500 points) indicative of moderately concentrated industries.
In 2023 Salesforce surpassed SAP – 5.4% market share – officially entering the top 3 of software companies, right behind Oracle, with an 8.3% market share, and Microsoft, owning 35.8% of the industry.
The software industry can be divided into three sub-segments, Cloud Computing, Cybersecurity, and Other niche segments. Cloud Computing comprises cloud providers like AWS, GCP, and Azure – primarily offering IaaS and PaaS solutions – and cloud services companies, like Salesforce, relying on cloud providers to offer SaaS solutions.
Given the ever-increasing importance of data and AI solutions both for business and customers, among all three sub-segments, Cloud Computing is by far the most prominent and relevant, accounting for 60.3% of total software industry revenues, which adjusts to 68.1% when including cloud revenues generated by non-software companies like Amazon and Google.
Source – Analyst’s composition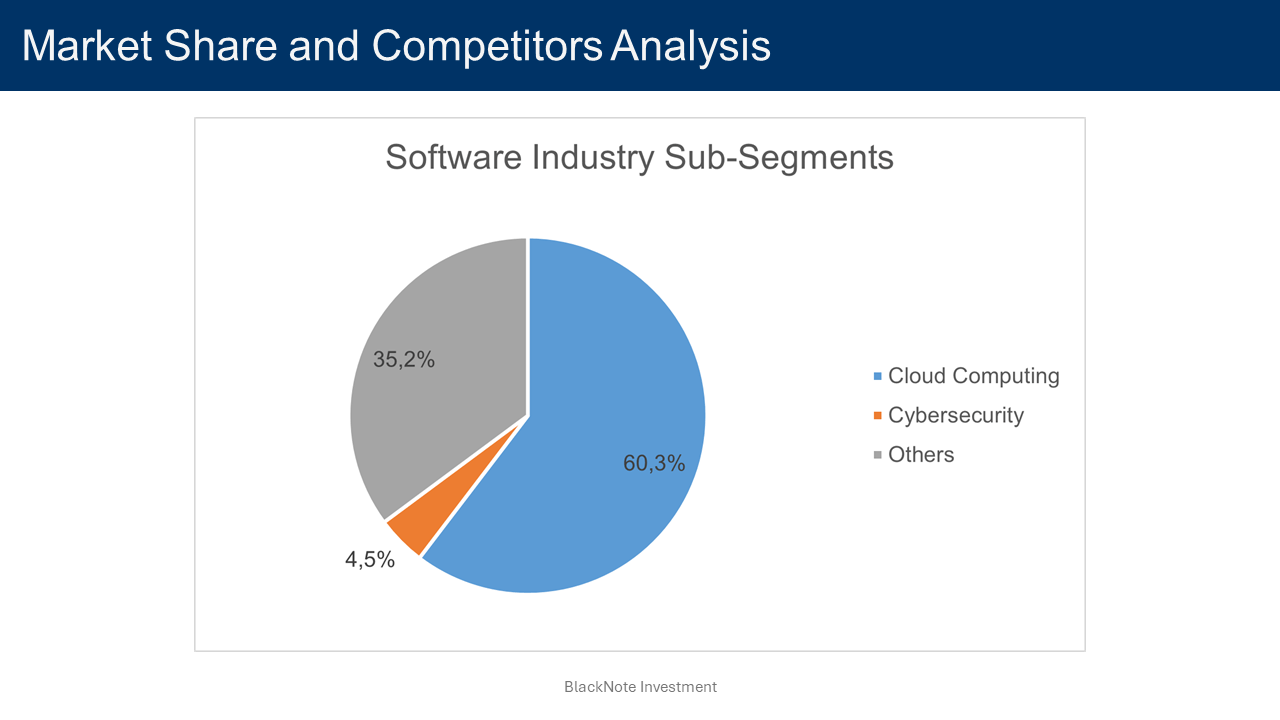
Regulatory Compliance
Due to the over-reliance on data collection, over the past years, concerns for data protection and individual privacy protection have risen among governments and international institutions.
This led to the introduction of stringent regulations and frameworks that IT Services companies must comply with to ensure the protection of both their clients and their clients’ customers’ data and information from any potential threat.
Examples of regulations firms are obliged to comply with are Data protection and privacy regulations, like the EU GDPR and the Californian CCPA; Cross-border data transfer regulations, like the EU-U.S, a Data Privacy Framework providing a detailed mechanism for the transfer of personal data from the EU to the US; and Cybersecurity regulations.
Industry Forecasts
From 2013 to 2023, the industry’s revenues grew at a CAGR of 10.4%, increasing 2.7 times from $235.3 billion to $635.1 billion.
|
The blossom of the internet at the beginning of the 21st century and the mass adoption of cloud computing have been two major drivers for the rapid expansion of the software industry. Nowadays, given the ongoing digitalization trends and sprout of AI technologies, software solutions are embedded in people’s everyday lives more than ever.
Considering the collective investments made by software companies through the years, to support future growth, the 2024 expected growth rate for the industry is 14.07%. We projected the industry’s expected revenues 10 years from now, applying the expected growth rate of 14.07% and allowing it to slowly decline as the industry approaches the economy’s perpetual growth rate, represented in this case by the USD risk-free rate.
By 2033, the software industry revenues are expected to reach $1.4 trillion, increasing 2.2 times from the $635.1 billion registered in 2023 at a CAGR of 8.2%.
|
Revenue Forecasts
Over the period 2013-2023, Salesforce revenues grew at a CAGR of 24% increasing 8.6 times from $4.07 billion to $34.8 billion, while its market share improved from 1.7% to 5.5%.
|
However, starting from FY2024, and perpetuating in the first quarter of FY2025, the firm registered the lowest-ever revenue growth rates, respectively 11.2% in FY24 and 10.7% y-o-y in Q1 FY25.
The management blamed weak buying behaviours as enterprises are adopting more stringent capital spending given the poor macroeconomic outlook. However, they remained confident in delivering revenue in the range of $38 billion in FY25, growing roughly 10% y-o-y.
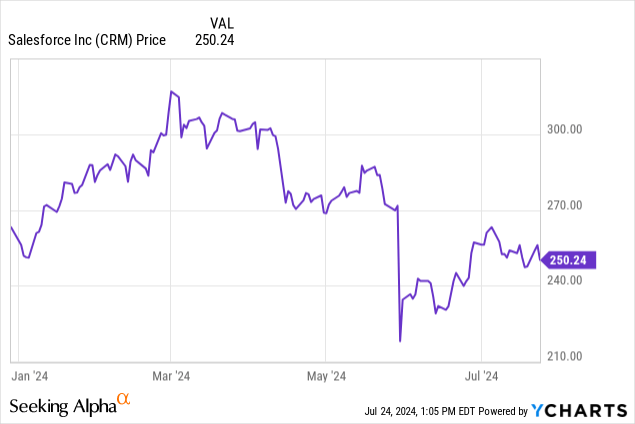
It goes without saying that Wall Street wasn’t happy with the poor performances, nor reassured by the management guidance, especially as Salesforce’s 10-year median revenue growth rate is an impressive 24.9%. After Q1 earnings the stock plummeted (14.2%), and YTD the total return is flat at 0%.
Despite the evident growth slowdown, Wall Street sulking is more overreaction than an indicator of severe structural problems with Salesforce’s business model. As a nearly $40 billion company and 3rd largest force in the industry, it is more than reasonable that growth rates will eventually decline instead of keep increasing as if Salesforce were a young emerging software company.
Salesforce has already achieved remarkable results, rising all the way up the ranks, and it’s time now to consolidate market share and start milking out solid cash flows to support more moderate organic and inorganic growth. We do not expect Salesforce to suddenly stop growing; rather it will grow at a slower pace, more in line with its corporate life cycle.
The recently introduced Data Cloud solutions will be a crucial driver in maintaining moderate growth momentum and market share. Thanks to its unique platform orientation, aimed at unifying all Salesforce CRM solutions into one, the management can rely on a sophisticated piece of tech that will attract new customers, while at the same time up-selling existing customers with other CRM solutions that were previously not implemented.
As reported by the management in the FY2024 Q4 earnings call, they are still lagging in terms of solutions integration among their existing customers:
Not even 50% of our Sales Cloud users use Service Cloud…and not even 50% of our Service Cloud users use Sales Cloud…that is on us…We have a lot of work to sell our existing clouds to our customers and upsell our existing customers and cross-sell them with Data Cloud…We’re rewriting our whole platform to be deeply integrated. We will no longer have all these separate acquired platforms.
As the adoption of Data Cloud solutions increases in the coming years, we expect Salesforce to comfortably maintain growth rates in the low-double-digits/high-single-digits range and maintain a market share of around 5.5% to 5%.
With these assumptions, assuming a market share of 5.2% by 2033, Salesforce’s revenues are projected to reach $72.9 billion by 2033, representing an increase of 2.1 times from the FY2024 revenues of $34.8 billion at a CAGR of 7.7%.
|
Free Cash Flows Forecasts
Salesforce has been enforcing stringent cost-saving strategies, laying off personnel and disposing of real estate assets. Starting in Q1 FY2024, the firm’s operating expenses have kept declining, especially R&D expenses which represent the most significant cost for the company. FY25 is no different, with operating expenses being down in absolute value when compared to 2022 levels.
|
Salesforce’s efforts to operating margin didn’t go unnoticed, with operating margin jumping to 17.2% in FY24, while in the past decade registered a median value of 2.6%. However, when treating R&D not as operating expenses but rather as capital expenditures – given their relevance in generating profit in the future years – Salesforce’s operating margins change quite significantly.
The median value over the period 2013-2023 is 14.3%, while after the restructuring plans, the FY24 operating margin sits at 26.8%. Worth mentioning that the FY24 adjusted operating margin is greater than the 2023 median operating margin of the software industry, equal to 25.3%.
Treating R&D expenses as capital expenditure increases the reinvestments made by the firm, with the median adjusted reinvestment margin moving from 1.3% – not including R&D – to 12% after adjustments.
Due to the intensive investments made in R&D to support its cloud solutions, Salesforce struggled to deliver solid free cash flows to the firm (FCFF) in the past. However, starting from FY24 the firm appeared to have completely transformed its operations, reducing R&D expenses, and delivering $4.6 billion in FCFF equal to an FCFF margin of 13.1%.
|
When compared to software industry levels, Salesforce FY24 FCFF margin is higher than both the 2023 industry median value of 8.2% and the 10-year median of 10.7%.
Strengthening the firm conviction to improve shareholders’ return, in Q1 FY25 Salesforce paid its first-ever dividend of $0.4 per share.
With a greater focus on operational efficiency, we can reasonably expect Salesforce to stretch the fiscal 2024 performance in the coming years and start delivering solid cash flows to its shareholders.
We expect the operating margin to be in the range of 35% by 2026 and beyond, approaching the levels of fellow leader software companies like Microsoft, Oracle, and Adobe.
As regards reinvestment margins – which ultimately determine the firm’s ability to generate free cash flow – we expect Salesforce to keep adapting its reinvestment needs, particularly R&D, to its corporate life cycle. More mature businesses require less reinvestment needs to support operating activities. We expect the reinvestment margin to decline to 4%, again approaching the average levels for mature big software companies like Microsoft and Oracle.
With these assumptions, Salesforce’s FCFFs are projected to reach $16.5 billion by 2033, representing an increase of 3.6 times from the FY2024 revenues of $4.6 billion at a CAGR of 13.7%.
Source – Analyst’s composition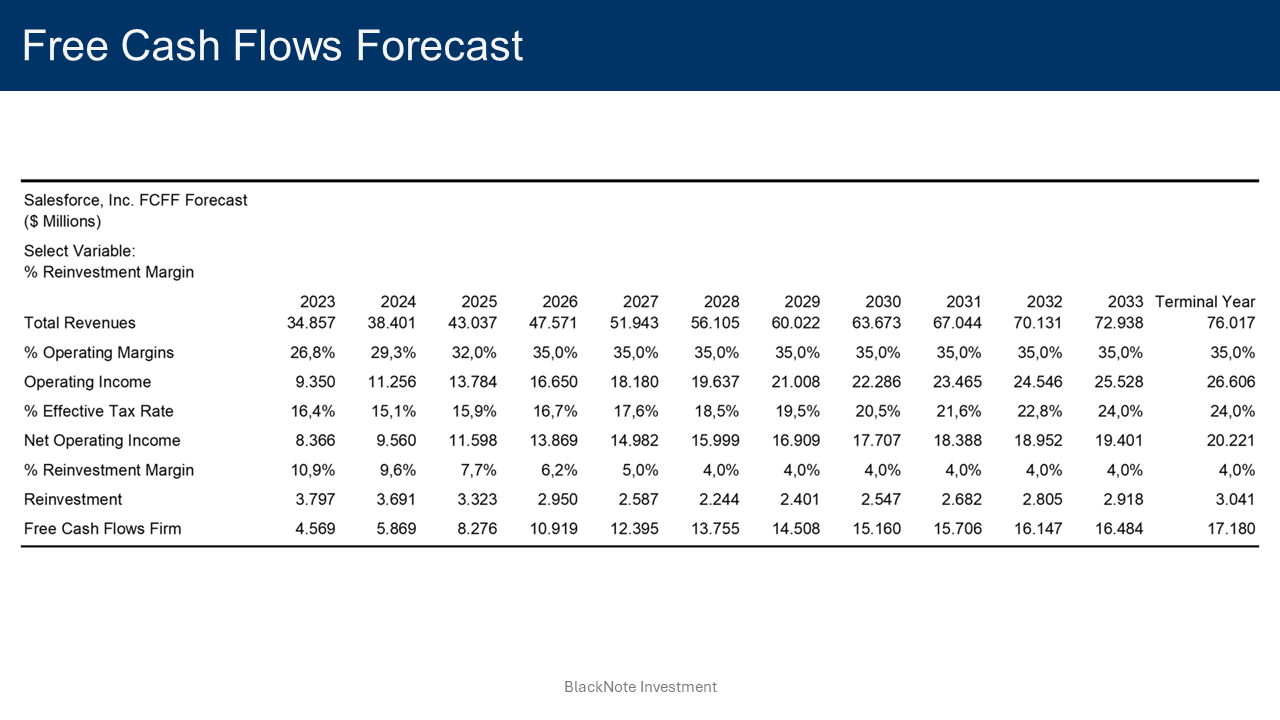
Valuation
Applying a discount rate of 10% for the next 10 years, and a discount rate of 9.6% in perpetuity, we obtain that the present value of these cash flows – after adjusting for debt and cash on hand – is equal to $201.9 billion or $208 per share.
Compared to the current prices, Salesforce stocks are overvalued by 18.6%.
To justify current stock prices, the implied rate of return would be equal to 6.5%.
It implies investing in Salesforce at the current prices would deliver a negative alpha of (3.7%) as it would generate lower returns compared to the actual return investors should expect, equal to 10.2%, given the assumption on cash flows and risk made so far.
Source – Analyst’s composition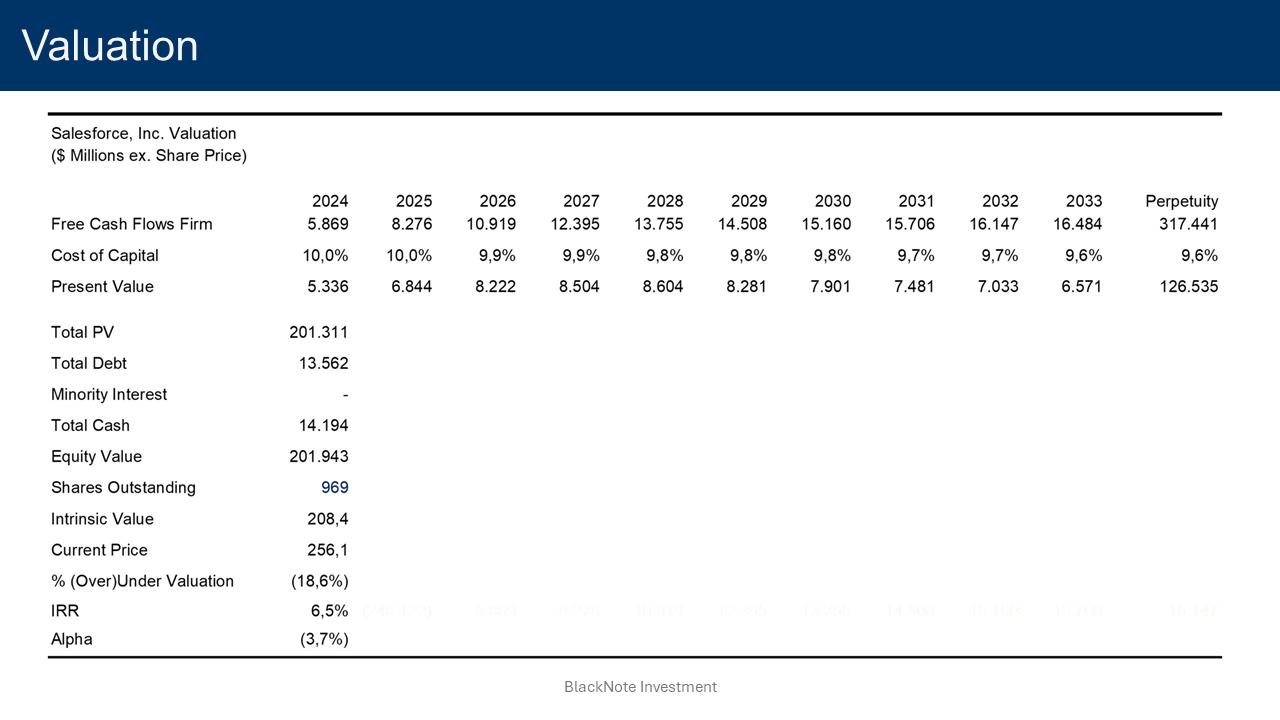
Street Target
The street target for Salesforce – based on 45 different analyst expectations – is sitting at $300 per share, as of the 23rd of July 2024, with 25 street recommendations expressing the rating “Buy”.
Looking at the trading seasonality trend for Salesforce, a chart that shows for each month of the year the likelihood that the end stock price will be higher than the start price based on historical data, in the last 6 years, in July, Salesforce stock prices have gone up on average 71% of the times, with a mean change of 3.08%, a high of 11.5%, and a low of (1.9%). The bullish trend is expected to continue also in August, with a 67% chance of price increase.
Source – TrendSpider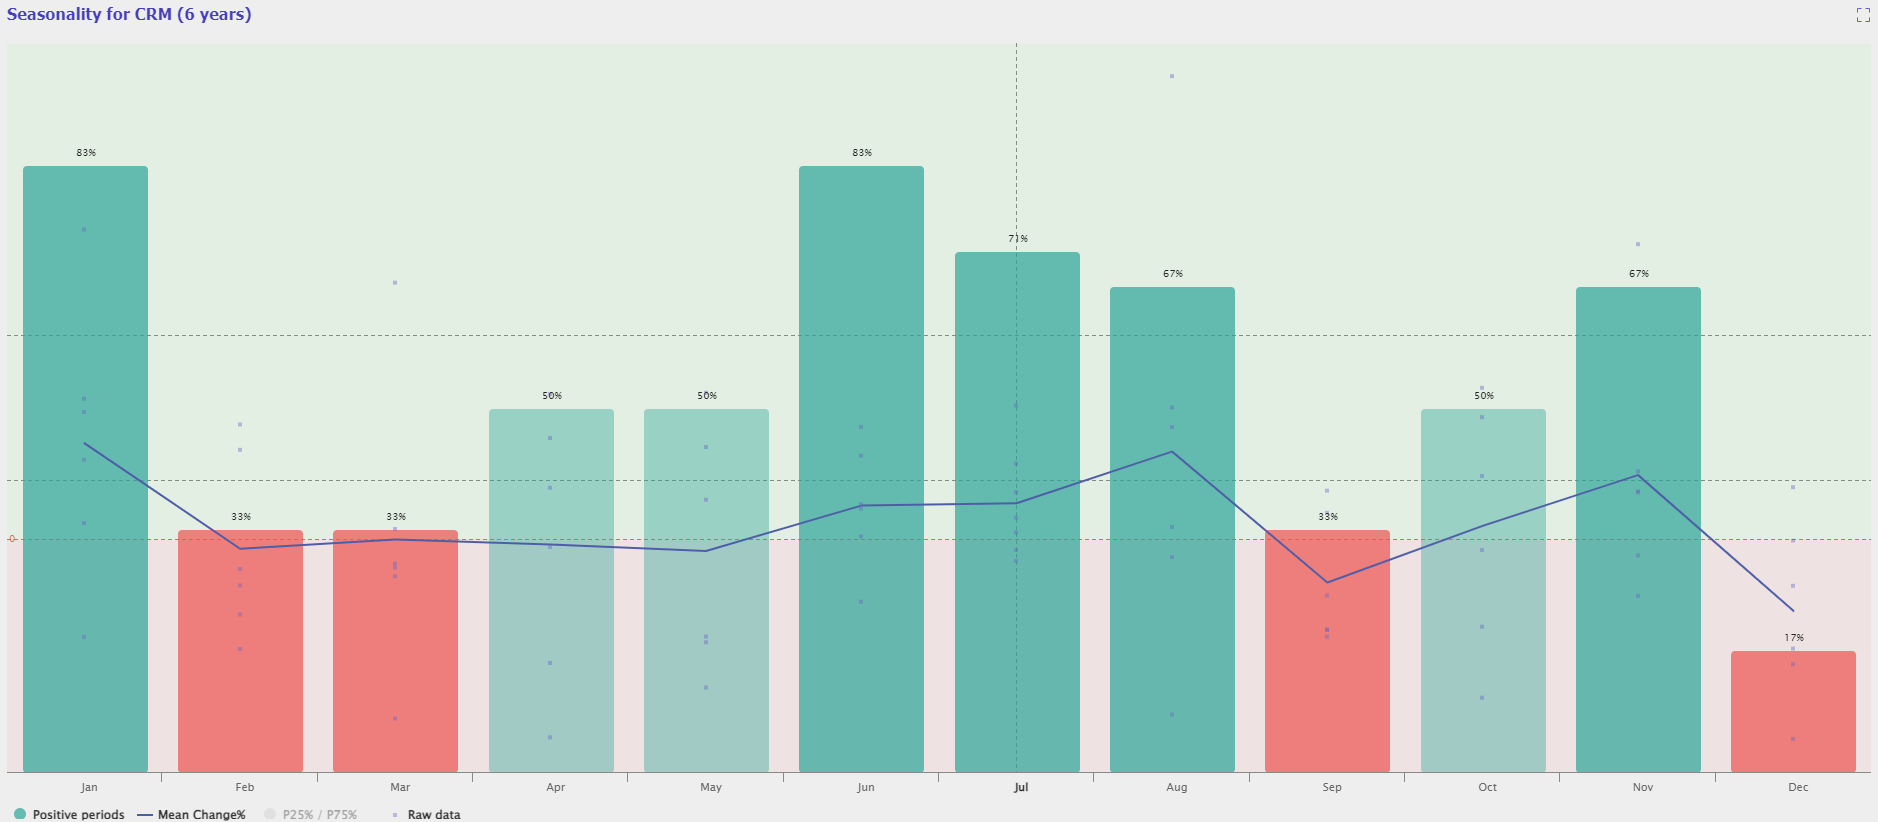
Discount Rate
To determine the appropriate discount rate, we employ the WACC method, which considers both the cost of equity and the cost of debt.
The cost of equity – 10.2% – is derived using the USA equity risk premium of 4.5% – as of July 2024 – the current USD risk-free rate of 4.2%, and the company’s beta of 1.34. The company’s beta is based on the software industry’s unlevered beta of 1.13.
The cost of debt – 4.9% – represents the expected return demanded by debt holders and is influenced by the company’s specific risk profile and the broader market conditions. It is computed considering the current USD risk-free rate of 4.2%, the company’s default spread of 0.79%, and the USA default spread of 0.0%.
With a current Equity to EV of 97% and a Debt to EV of 3%, the discount rate for the next 10 years is 10%. In perpetuity, the discount rate adjusts to 9.6% to reflect more stable cash flows and lower risk.
Conclusion
In conclusion, our assumptions suggest that Salesforce’s risk-reward profile has the potential to represent an interesting investment opportunity. However, at current prices, the stocks result to be overvalued by 18.6%, implying a negative alpha of (3.7%), as the implied return (IRR) to justify current prices is equal to 6.5% while the required return investors that should demand is equal to 10.2%, given the assumptions made on future cash flows and firm’s risk.
Despite Wall Street being even more bullish about the stock, with a price target of $300 per share, we soundly suggest waiting for stock prices to correct towards the firm’s intrinsic value to fully benefit from the company’s total return potential.
The massive tech sell-off that occurred on the 24th of July 2024 – after two of the Magnificent 7 missed analysts’ estimates – should be taken as a wake-up call for investors looking at opportunities in the technology segment, as the market might be more inflated than it actually seems, and any minor discontent from Wall Street can imply severe price corrections, as recently happened.
Analyst’s Disclosure: I/we have no stock, option or similar derivative position in any of the companies mentioned, and no plans to initiate any such positions within the next 72 hours. I wrote this article myself, and it expresses my own opinions. I am not receiving compensation for it (other than from Seeking Alpha). I have no business relationship with any company whose stock is mentioned in this article.
Seeking Alpha’s Disclosure: Past performance is no guarantee of future results. No recommendation or advice is being given as to whether any investment is suitable for a particular investor. Any views or opinions expressed above may not reflect those of Seeking Alpha as a whole. Seeking Alpha is not a licensed securities dealer, broker or US investment adviser or investment bank. Our analysts are third party authors that include both professional investors and individual investors who may not be licensed or certified by any institute or regulatory body.