
Summary:
- Salesforce’s gross margins have remained stable at an average of 74.4% over the past 10 years, which is high but indicates a lack of benefit from economies of scale.
- However, the company’s strategic partnerships and extensive sales channel partner network have contributed to a decline in SG&A expenses as a percentage of revenue, increasing its operating margins.
- Additionally, Salesforce has strong free cash flows and has conducted significant share buybacks, further enhancing its profitability and cash flow per share.
JasonDoiy
In our previous analysis of Salesforce, Inc. (NYSE:CRM), we underscored the benefits of incorporating AI into CRM systems, highlighting its role in streamlining operations and boosting efficiency. We forecasted a robust growth rate of 14.7% for the CRM market, primarily fueled by the widespread adoption of AI technologies. Specifically focusing on Salesforce, we observed a comprehensive integration of AI functionalities spanning sales, marketing, and customer service, facilitated by strategic acquisitions. Looking ahead, we had anticipated Salesforce’s continued growth in the CRM market.
In this analysis, we covered the company again following the release of its full-year 2023 results and the company’s stock had also reached our previous price target, rising by 40% since our last coverage. While the company’s revenue growth (11.2%) was below our forecast (16.4%), the company’s profitability surpassed our expectations with its net margins at 12% compared to our previous forecast of 6.8%. Thus, we examined whether the company’s profitability could be sustained going forward. We first analyzed its gross margins, which have been flattish, and determined factors the company appears not to benefit from economies of scale. Furthermore, we delved into its expense breakdown to pinpoint key drivers contributing to the improvement of its net margins. Lastly, we assessed its robust free cash flows and capital expenditures, followed by an analysis of the impact of its share buybacks.
Gross Margin Stability
In the first point, we analyzed the company’s gross margins and determined the reasons for its stable and high gross margins and determine the reasons for the lack of benefit from economies of scale on its gross margins.
Company Data, Khaveen Investments
|
Gross Margins |
2014 |
2015 |
2016 |
2017 |
2018 |
2019 |
2020 |
2021 |
2022 |
2023 |
|
COGS (excluding D&A) |
16.54% |
17.91% |
18.99% |
18.87% |
18.59% |
12.28% |
12.20% |
14.07% |
14.59% |
13.15% |
|
Depreciation & Amortization |
7.46% |
6.91% |
7.49% |
7.44% |
7.39% |
12.49% |
13.39% |
12.45% |
12.08% |
11.36% |
|
Gross Profit |
76.01% |
75.18% |
73.52% |
73.69% |
74.02% |
75.23% |
74.41% |
73.48% |
73.34% |
75.50% |
Source: Company Data, Khaveen Investments
Based on the chart above, the company’s gross margins have been very stable over the past 10 years, with an average of 74.4%. Its gross margins have been stable, despite the strong revenue growth over the period, with positive growth every year at an average of 24%, which may indicate it had not been benefiting significantly from economies of scale. In 2019, the company’s COGS % of revenue decreased significantly, following its acquisition of Tableau. Moreover, its depreciation % amortization costs had also been stable except in 2019 as it increased following the Tableau acquisition. In 2023, it is worth noting that its gross margins had increased by 2.2%, the most in the past 10 years.
Economies of scale refer to the cost advantage with higher output due to an inverse relationship between per unit cost and output. There are two main cost components, which are fixed costs and variable costs. Economies of scale are realized when fixed costs are spread across a greater output quantity, which particularly advantages firms with substantial fixed costs like capital investments in machinery. For instance, as production volume increases, the fixed cost per unit decreases up to a point of full utilization, which refers to the maximum capacity at which machinery operates. Additionally, economies of scale also relate to greater production efficiency, reducing the variable cost per unit. This may be attributable to 3 factors, which are the cost of purchases, employee skill and technological level. For example, firms may negotiate lower prices for materials through bulk purchasing agreements with suppliers. Furthermore, higher-skilled employees increase productivity by working more efficiently and effectively, contributing to economies of scale. Additionally, firms leveraging technological advancements can reduce operational inefficiencies and boost production yield.
Production Utilization
However, software companies differ from other types of firms such as manufacturers that have higher capital requirements for machinery, plants and other equipment, resulting in higher fixed costs which could be spread out as unit output rises. In comparison, software companies incur upfront costs in terms of the development cost of software. Software is easily replicated as a software company can create duplicates of the master software to be sold to customers and there is a minimal cost of producing additional software copies relative to its development costs and no production constraints, unlike manufacturing firms that are constrained by the maximum rate of utilization of their machinery. This allows software companies to achieve high gross margins earlier compared to manufacturing firms, which may have low margins initially but rise as production increases. The average gross margin of the software industry is 71.52% while Salesforce’s gross margin is in line (75.5%), compared to the overall average gross margins of all industries of 36.56%.
Volume Discounts
Furthermore, Salesforce adopts a SaaS model, offering its software products as subscription licenses delivered through the cloud. Salesforce has a partnership with AWS (AMZN), the largest cloud provider globally, leveraging its cloud services. For example, its “Data Cloud, Service Cloud, Sales Cloud” products are available for deployment on the AWS marketplace and its Heroku platform utilizes AWS’s EC2 instances. The company also announced it will expand its use of AI CRM products with AWS services such as Amazon Bedrock with Salesforce Einstein, Data Cloud, Service Cloud. In our previous analysis, we highlighted the scalability of cloud, with the relationship between higher data consumption and lower unit cost. Additionally, AWS provides “volume-based discounts”, encouraging higher consumption of cloud services with lower pricing. Therefore, we believe this would benefit Salesforce’s gross margins on a higher scale as it increases data center capacity to serve its customers.
However, software companies generally offer volume discounts to customers providing pricing discounts for purchases of more products such as Microsoft (MSFT) offering bundle packages for Office, Adobe’s (ADBE) Value Incentive Plan and Oracle’s (ORCL) packages of database, middleware and applications products. The benefit to Salesforce may be offset due to the company’s own discounts provided to customers with bundle packages at lower pricing. For instance, bundled offerings included the Tableau Enterprise Bundle offering total savings of up to 45% and the Automation Everywhere Bundle with savings of up to 40%. Additionally, Salesforce has expanded its bundle portfolio with the new offering of “Unlimited Edition+” officially launched in Q3 2023 during its flagship event of Dreamforce, granting organizations access to “the best of Salesforce technology across Sales Cloud, Service Cloud, Einstein AI, Data Cloud, Slack, Tableau, and Industries in a single offering”. Therefore, this may indicate Salesforce channeling its cost discounts for AWS cloud services to customers as discounts for bundle purchases of its products, resulting in stable margins.
Employee Skill and Costs
Furthermore, in terms of the employee skill factor of economies of scale, we believe Salesforce has a strong ability to attract skilled employees as it has been in the “Fortune 100 Best Companies to Work For” for 14 consecutive years. However, we examined its employee cost in cost of sales to examine why Salesforce’s margins remained stable. Based on the company’s annual report, its cost of sales is broken into cost of subscription and cost of professional services. Both cost of subscription and support revenues and cost of professional services and other revenues include employee-related costs. Furthermore, in the past 10 years, the company highlighted its cost of sales increased primarily due to increased employee-related costs except in 2023, where the company highlighted its cost related to employee costs decreased following its restructuring plan. In 2023, its COGS % of revenue decreased by 1.4%, the most in the past 10 years.
Salesforce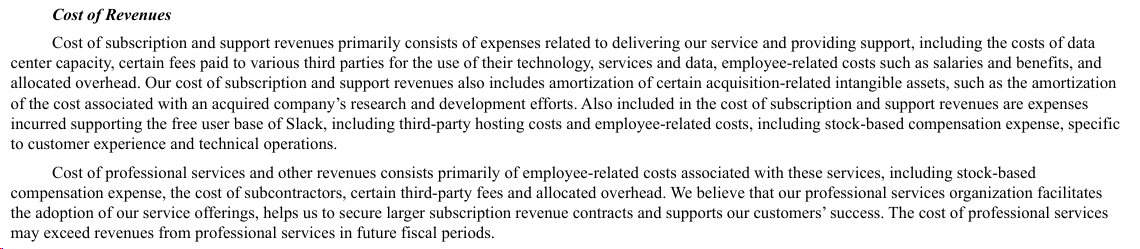
In the table below, we compiled its employee headcount growth, COGS and cost of sales stock-based compensation costs.
|
Salesforce Cost of Sales ($ mln) |
2015 |
2016 |
2017 |
2018 |
2019 |
2020 |
2021 |
2022 |
2023 |
Average |
|
Salesforce Employees |
19,000 |
25,000 |
29,000 |
35,000 |
49,000 |
56,606 |
73,541 |
79,390 |
72,682 |
|
|
Growth % |
18.8% |
31.6% |
16.0% |
20.7% |
40.0% |
15.5% |
29.9% |
8.0% |
-8.4% |
19.1% |
|
Salesforce Revenue |
6,667 |
8,437 |
10,540 |
13,282 |
17,098 |
21,252 |
26,492 |
31,352 |
34,857 |
|
|
Growth % |
24.1% |
26.5% |
24.9% |
26.0% |
28.7% |
24.3% |
24.7% |
18.3% |
11.2% |
23.2% |
|
Salesforce COGS |
1,194 |
1,602 |
1,989 |
2,469 |
2,100 |
2,592 |
3,728 |
4,574 |
5,319 |
|
|
Growth % |
34.4% |
34.2% |
24.2% |
24.1% |
-14.9% |
23.4% |
43.8% |
22.7% |
16.3% |
23.1% |
|
Stock-based Compensation (Cost of Sales) |
70.0 |
107.0 |
130.0 |
161.0 |
204.0 |
241.0 |
386.0 |
499.0 |
431.0 |
|
|
Growth % |
29.6% |
52.9% |
21.5% |
23.8% |
26.7% |
18.1% |
60.2% |
29.3% |
-13.6% |
27.6% |
|
Salesforce COGS Increase |
305.5 |
407.9 |
387 |
480 |
-369 |
492 |
1136 |
846 |
8 |
|
|
Increase in Employee Costs |
127.9 |
240.9 |
191.5 |
156 |
245 |
330 |
645 |
638 |
N/A (decrease) |
|
|
Increase in Employee Costs % of Total Increase |
41.9% |
59.1% |
49.5% |
32.5% |
-66.4% |
67.1% |
56.8% |
75.4% |
N/A |
Source: Company Data, Macrotrends, Khaveen Investments
Based on the table, the company’s employee headcount average growth had been lower than its COGS growth. Therefore, we believe its increase in employee-related costs is attributed to rising payroll and compensation. Furthermore, its stock-based compensation average growth is 27.6%, higher than its COGS average growth of 23.1%. Moreover, the increase in employee costs accounted for a significant % of its total COGS increase and has risen to the highest in 2022, accounting for 75.4% of its COGS cost increase.
Company Data, Khaveen Investments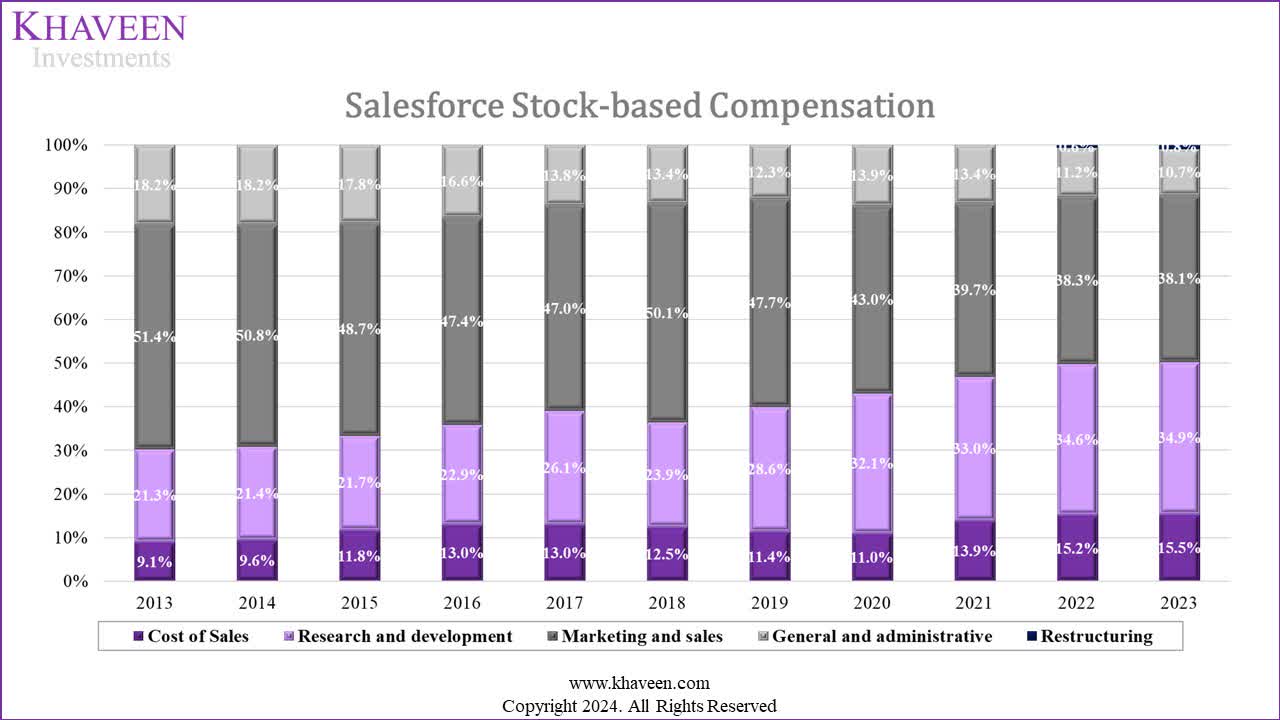
Furthermore, the chart above shows the trend in stock-based compensation breakdown over the years. There has been a gradual increase in the proportion of cost of sales and R&D costs whereas the share of marketing & sales and general & administrative expenses have been decreasing. The increase in the cost of sales indicates the company’s allocation of costs towards its cost of sales is rising. In other words, it may indicate that as the company increases its revenues, it needs more employee costs to sustain its growth and may be offsetting productivity increases. Based on its annual report, the company highlighted that its cost of subscription and support revenues include costs related to employee expenses to support free users on Slack (acquired in 2021), which may explain the growth in its expenses. Furthermore, its employee expenses under its cost of professional services that are related to subcontractors and third-party fees have been indicated to increase faster than revenue according to its annual report.
Tech Capabilities
Finally, in terms of the leveraging better tech capabilities factor involving leveraging technological advancements to reduce operational inefficiencies and boost their production yield, software companies generally already have easy replicability of their software products, unlike manufacturing firms which seek to increase production yield. Therefore, we believe this factor would not significantly benefit the economies of scale in software companies like Salesforce. Furthermore, Salesforce, like many software companies, relies on external cloud service providers such as AWS for its SaaS model. We believe this reliance limits Salesforce’s direct control over its technological capabilities. Thus, the impact on economies of scale may be less for Salesforce due to the reliance on external cloud providers. However, this may not necessarily be negative for Salesforce as AWS is the largest cloud service provider globally, indicating its large scale.
Outlook
All in all, we believe that Salesforce’s flattish gross margins reflect it not benefiting significantly from the impact of economies due to various factors influenced by its business model as a software company. For example, the high replicability nature of software production with relatively low capital investments required minimizes the benefit of rising production on margins. Additionally, while the company may benefit from volume-based discounts from its cloud service provider, the discounts provided to its customers through bundle deals may be offsetting the benefit. While it is ranked as one of the top employers, which could reflect its ability to secure better talent, its rising proportion of employee costs indicates an increased allocation of employee costs required to sustain its revenues. Finally, we believe the replicability of software products and reliance on external cloud providers like AWS may limit the benefits of leveraging tech advancements to improve efficiency for companies like Salesforce. Overall, we expect Salesforce gross margins to remain stable due to the minimal net effect of economies of scale on the company.
Furthermore, the company’s revenue growth in 2023 of 11.18% was slightly below our expectations of 16.36% growth. Additionally, management guidance for 2024 is low at only 8% to 9% YoY growth compared to our previous expectations of higher growth in 2024 at 21.4% “based on our CRM market forecast CAGR of 14.7% multiplied by our factor score of 1.45x for the company”. Moreover, we believe management guidance is unexpectedly low following its AI developments recently with the launches of the Einstein 1 platform, Copilot, and Data Cloud. On top of that, Salesforce indicated that 17% of customer e-commerce platform sales in Cyber Week were influenced by AI at $51 bln of $298 bln. Additionally, management highlighted that its Remaining Performance Obligations which “represents contracted revenue that has not yet been recognized and includes unearned revenue and unbilled amounts that will be recognized as revenue in future periods”, grew by 17% in 2023. Overall, we maintained our revenue forecasts for Salesforce at 21.37% in 2024 but tapering down beyond that and forecasted its gross margins based on its past 3-year average COGS % of revenue of 13.94% and average depreciation % of revenue of 9.84% for a forward and stable gross margin of 76.22%.
|
Earnings & Margins Forecast |
2024F |
2025F |
2026F |
2027F |
2028F |
|
Revenue ($ mln) |
42,306 |
49,538 |
56,313 |
62,474 |
67,942 |
|
Revenue Growth |
21.37% |
17.10% |
13.68% |
10.94% |
8.75% |
|
Gross Margin |
76.22% |
76.22% |
76.22% |
76.22% |
76.22% |
Source: Company Data, Khaveen Investments
Rising Net Margins
Furthermore, we examined Salesforce’s operating and net margin improvement and analyzed the key drivers for its rising profitability.
Company Data, Khaveen Investments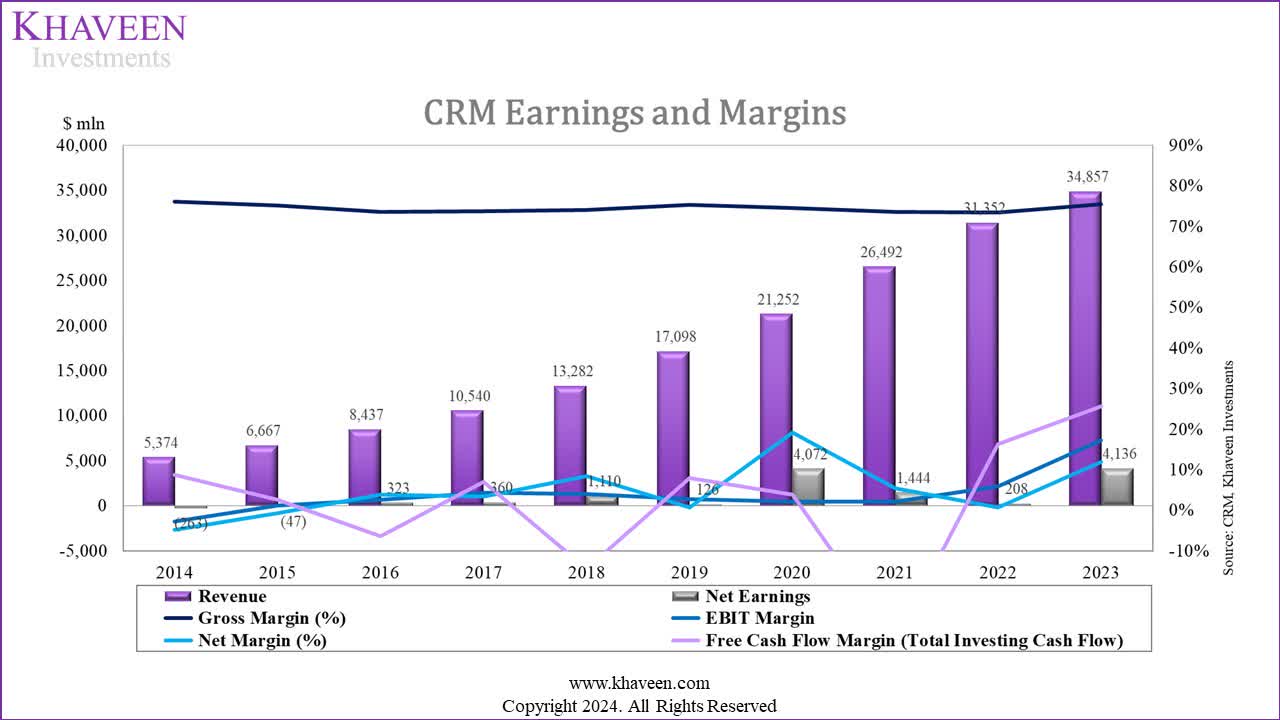
|
Earnings & Margins |
2014 |
2015 |
2016 |
2017 |
2018 |
2019 |
2020 |
2021 |
2022 |
2023 |
|
Gross Margin |
76.01% |
75.18% |
73.52% |
73.69% |
74.02% |
75.23% |
74.41% |
73.48% |
73.34% |
75.50% |
|
EBIT Margin |
-2.71% |
1.17% |
2.58% |
4.31% |
4.03% |
2.71% |
2.14% |
2.07% |
5.93% |
17.21% |
|
Net Margin |
-4.89% |
-0.71% |
3.83% |
3.42% |
8.36% |
0.74% |
19.16% |
5.45% |
0.66% |
11.87% |
Source: Company Data, Khaveen Investments
As seen from the chart above, while its gross margins have been stable, its operating and net margins have improved over the past 10 years. In 2023, its EBIT and net margins rose to 17.21% and 11.87%, the highest over the period. (flat)
|
Expense Analysis (% of Revenue) |
2023 (Actual) |
2023 (Previous) |
|
Gross Profit |
75.5% |
75.6% |
|
Research And Development |
14.1% |
14.6% |
|
Selling, General and Administrative |
44.2% |
46.9% |
|
Other Expenses (Income) |
0.0% |
0.0% |
|
Earnings Before Interest & Taxes (EBIT) |
17.2% |
14.1% |
|
Interest |
-0.1% |
-0.3% |
|
Other Non-Operating Expenses (Income) |
2.9% |
5.1% |
|
Earnings Before Tax |
14.2% |
8.7% |
|
Tax (% of EBT) |
16.4% |
21.0% |
|
Net Earnings |
11.9% |
6.8% |
Source: Company Data, Khaveen Investments
Comparing our previous analysis forecast for its margins, its R&D % of revenue is in line with our forecast, however, its SG&A % of revenue was lower than our forecast by 2.7%. Other expenses were also lower by 2.2% as well as its tax rate was lower at 16.4% compared to 21%.
Company Data, Khaveen Investments
Based on the expense analysis chart above, Salesforce’s SG&A is the most significant expense and has continued to decline as % of revenue. On the other hand, its R&D % of revenue was relatively stable. As highlighted in the first point, its COGS and depreciation have also been relatively stable, despite the rise declining in COGS and rise in depreciation in 2019 following the impact of its Tableau acquisition. We examined its operating expenses in more detail below.
SG&A
|
Salesforce SG&A |
2014 |
2015 |
2016 |
2017 |
2018 |
2019 |
2020 |
2021 |
2022 |
2023 |
|
SG&A ($ mln) |
793 |
946 |
1,208 |
1,553 |
1,886 |
2,766 |
3,598 |
4,465 |
5,055 |
4,906 |
|
SG&A % of Revenue |
63.96% |
59.82% |
56.62% |
54.65% |
55.79% |
56.35% |
55.34% |
54.56% |
51.29% |
44.21% |
Source: Company Data, Khaveen Investments
In 2023, its SG&A % of revenue decreased significantly, 7% lower compared to 2022. This is attributed to its restructuring plan conducted in 2023 as management focused on reducing its costs, aimed at cutting operating costs and enhancing operating margins. The plan involved reducing the workforce by about 10% and downsizing office space in certain markets. As a result of the restricting plan, management highlighted that in fiscal 2024, marketing and sales expenses decreased due to lower employee-related costs, including stock-based compensation expenses, with a 14% reduction in headcount. Similarly, general and administrative expenses decreased in fiscal 2024, attributed to reduced employee-related costs, with a 20% decrease in headcount.
However, prior to 2023, the company’s SG&A expenses as % of revenue had also been on a declining trend from 63.96% in 2014 to 51.29% in 2022. We identify several factors for this trend by examining its Channel Partners, Branding and Growth Strategies.
Channel Partners
Based on its annual report, the company highlighted that it utilizes its direct sales force to secure new customers and sales. In addition, the company also highlighted it leverages “a network of partners” as detailed below.
Salesforce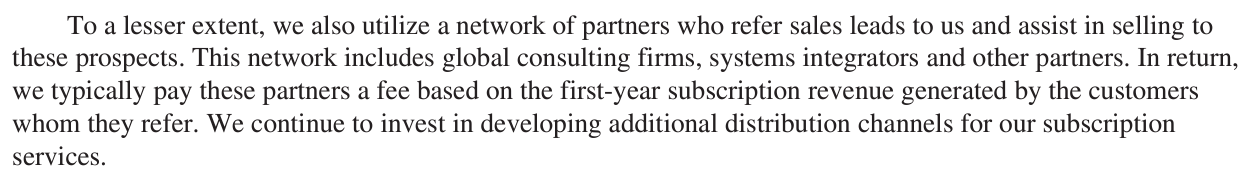
Based on CRM Consulting, Salesforce has 1,939 partners worldwide. This provides benefits to customers implementing Salesforce products, with the company claiming 70% benefit from assistance from consulting partners. Therefore, we expect that leveraging its extensive sales channel partner network benefits the company by saving on marketing expenses through its own direct sales force.
Company Data, Khaveen Investments
Furthermore, as seen with the company’s breakdown of its stock-based compensation, we believe the declining trend of its Marketing & sales share of total stock-based compensation could be reflected by it leveraging its channel sales partner network.
Furthermore, the company’s annual report highlighted that it intends to “continue to focus on leveraging” its “self serve and partner-led channels” and guided for its marketing expenses to continue declining as % of revenue.
Growth Strategies (Cross-Selling to Existing Customers)
Furthermore, according to the company’s annual report, Salesforce’s strategies include focusing on expanding its existing customer relationships through cross-selling and upselling by offering more Salesforce products. As mentioned above, the company has created various bundle packages of different products including “Sales Cloud, Service Cloud, Einstein AI, Data Cloud, Slack, Tableau, and Industries”. Therefore, by focusing on expanding existing customer relationships, we believe this allows it to benefit from having to incur new customer acquisition costs as a factor leading to its lower SG&A % of revenue trend.
Salesforce
Branding
IDC, Grand View Research, Khaveen Investments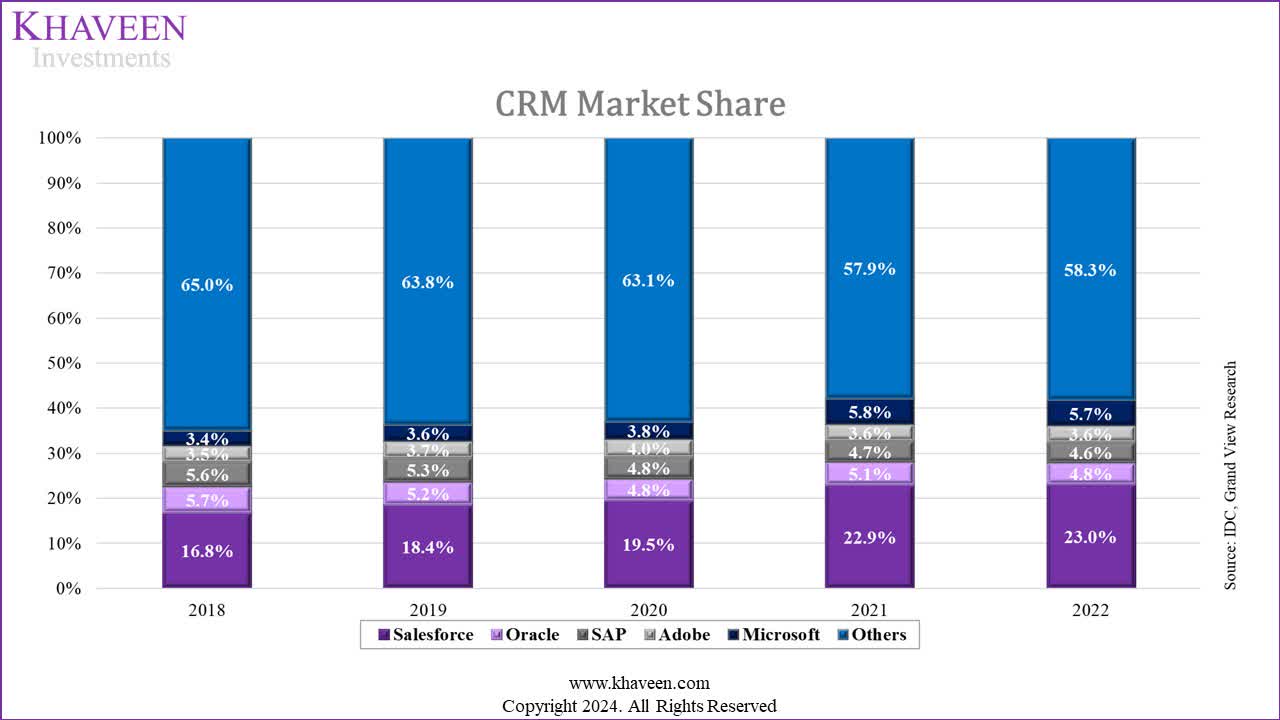
Based on the chart above of CRM market share over the years, Salesforce has consistently secured a dominant position and exhibited substantial market presence, with a strong market presence of 23% shares by 2022. More importantly, Salesforce has been the market leader for the past 10 consecutive years. An indication, we believe, of the company’s solid branding. Additionally, the company’s ranking in the Best Global Brands list has risen from 75th in 2018 to 38th place in 2023.
R&D
|
Salesforce R&D ($ mln) |
2014 |
2015 |
2016 |
2017 |
2018 |
2019 |
2020 |
2021 |
2022 |
2023 |
Average |
|
R&D |
793 |
946 |
1,208 |
1,553 |
1,886 |
2,766 |
3,598 |
4,465 |
5,055 |
4,906 |
|
|
R&D % of Revenue |
14.8% |
14.2% |
14.3% |
14.7% |
14.2% |
16.2% |
16.9% |
16.9% |
16.1% |
14.1% |
15.2% |
|
R&D Growth |
19.3% |
27.7% |
28.6% |
21.4% |
46.7% |
30.1% |
24.1% |
13.2% |
-2.9% |
23.1% |
|
|
Revenue Growth |
24.1% |
26.5% |
24.9% |
26.0% |
28.7% |
24.3% |
24.7% |
18.3% |
11.2% |
23.2% |
|
|
Stock-based Compensation (R&D) Growth |
6.6% |
45.7% |
38.3% |
18.1% |
66.1% |
37.8% |
30.6% |
23.7% |
-14.4% |
28.1% |
|
|
Stock-based Compensation (R&D) % of R&D Total |
15.3% |
13.6% |
15.6% |
16.7% |
16.3% |
18.4% |
19.5% |
20.6% |
22.5% |
19.8% |
17.8% |
|
Remaining R&D Expenses |
671.9 |
817.3 |
1,020 |
1,293 |
1,579 |
2,256 |
2,895 |
3,547 |
3,919 |
3,934 |
|
|
Remaining R&D Growth |
21.6% |
24.8% |
26.8% |
22.1% |
42.9% |
28.3% |
22.5% |
10.5% |
0.4% |
22.2% |
Source: Company Data, Khaveen Investments
From its annual report, the company’s R&D “consists primarily of salaries and related expenses, including stock-based compensation expense for our engineering staff associated with product development, as well as allocated overhead”. Based on the table above shows its R&D % of revenue has been relatively stable in the past 10 years with an average of 15.2%. Furthermore, comparing its R&D growth with its total revenue growth, it has been highly in line at 23.1% and 23.2% respectively. However, in 2023, its R&D % of revenue decreased following its restructuring plan, which led to a decrease in employee-related costs.
Overall, this indicates that the company’s R&D expenses had grown in line with its revenue growth. However, as seen by its stock-based compensation breakdown chart, its compensation related to R&D has been on a rising trend over the past 10 years. Based on the table above, this is because its Stock-based Compensation (R&D) had been growing at a higher rate at an average of 28.1% compared to its remaining R&D expenses (including allocated overhead) which has an average growth of 22.2%, which is slightly lower than its total R&D growth (23.1%). Therefore, the higher R&D-related stock-based compensation growth was offset by lower growth in its remaining R&D expenses.
Overall, the company had successfully managed its R&D expense growth in line with revenue growth. Furthermore, management stated that it plans to continue managing R&D growth in line with revenue growth. The company highlighted that it had started “to invest in incremental AI resources to accelerate further growth”. Notwithstanding, the company guided that despite its investments in these areas, it still expects R&D % of revenue to remain stable as it expects incremental revenue growth in line with incremental expenses associated with R&D. Therefore, we expect its R&D % of revenue to remain stable going forward.
Non-Op Expenses
Salesforce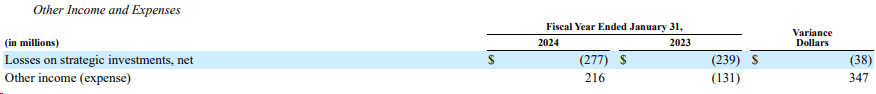
The company’s non-operating expenses accounted for a minor portion of revenue at only 2.9% in 2023. This included losses on strategic investments (private equity or debt investments) which were slightly higher at $277 mln compared to $239 mln. However, this was offset slightly by other income of $216 mln compared to $131 mln in expenses in the previous year.
Tax
|
Tax (% of EBT) |
2014 |
2015 |
2016 |
2017 |
2018 |
2019 |
2020 |
2021 |
2022 |
2023 |
|
EBT Margin |
-3.97% |
0.96% |
2.12% |
3.98% |
7.40% |
4.13% |
12.05% |
5.78% |
2.11% |
14.20% |
|
Tax |
-23.28% |
173.72% |
-80.45% |
14.29% |
-12.92% |
82.15% |
-59.00% |
5.74% |
68.48% |
16.44% |
Source: Company Data, Khaveen Investments
In terms of tax expenses, the company’s tax expense % of EBT in the past 10 years has been volatile as the company’s profitability has been low over the period. Its 10-year average tax expenses % of EBT is 18.52% while its past 5-year average is 22.77%. The company recorded net positive tax provision income in 3 out of the past 10 years. Based on its annual reports, in 2020, the company recorded a one-time tax benefit provision of $1.5 bln as it reorganized its “international corporate structure, which included the transfer of certain intangible property between foreign affiliates”. In 2018, the company recorded a tax benefit due to “valuation allowance related to federal and state deferred tax assets”. Whereas in 2016, the company had a tax benefit of $210 mln attributed to its valuation allowance from its Demandware acquisition. Overall, the company’s past tax expenses had been volatile as it had low margins as well as positive tax provisions income in 3 out of the 10 years; therefore, we based our tax rate assumption on the US corporate tax rate of 21%.
Outlook
In 2023, Salesforce saw a significant decrease in its SG&A expenses as a percentage of revenue, mainly due to a restructuring plan aimed at cutting operating costs by reducing the workforce and downsizing office space. Additionally, we believe the focus on leveraging its extensive sales channel partner network, expanding existing customer relationships, and solid branding contributed to the long-term declining trend in SG&A expenses, which we anticipate continuing going forward. Thus, we forecasted its SG&A % of revenue to continue declining from 2023 based on its past 10-year average change in SG&A of revenue excluding 2023 due to the one-off restructuring plan which has already been completed at -2.68% per year, reaching 40.76% of revenue by 2026. Furthermore, the company’s R&D expenses remained stable in proportion to revenue, and we expect it to continue remaining stable going forward as the company focuses on AI investment growth in line with its revenue growth and based our forecast on its 10-year average R&D % of revenue of 15.24%. Overall, we expect its margins to increase gradually to 13.31% by 2028. Based on its latest earnings briefing, management guided operating margins to rise by 2% this year, compared to our forecasts of a 0.7% increase, indicating our margin projections as conservative.
Company Data, Khaveen Investments
|
Net Margin Forecast |
2024F |
2025F |
2026F |
2027F |
2028F |
|
Net Margin |
11.50% |
12.41% |
13.30% |
13.31% |
13.31% |
Source: Company Data, Khaveen Investments
Strong FCF and Share Buybacks
Company Data, Khaveen Investments
|
Salesforce Cash Flow ($ mln) |
2014 |
2015 |
2016 |
2017 |
2018 |
2019 |
2020 |
2021 |
2022 |
2023 |
|
Operating Cash Flow |
1,181 |
1,672 |
2,162 |
2,738 |
3,398 |
4,331 |
4,801 |
6,000 |
7,111 |
10,234 |
|
Capital Expenditure |
-417 |
-710 |
-464 |
-534 |
-595 |
-643 |
-710 |
-717 |
-798 |
-736 |
|
Other Investing Cash Flow |
-282 |
-778 |
-2,220 |
-1,477 |
-4,713 |
-2,337 |
-3,261 |
-13,819 |
-1,191 |
-591 |
|
Free Cash Flow Margin (Capex Only) |
13.98% |
14.25% |
19.97% |
20.98% |
21.10% |
21.57% |
19.14% |
19.94% |
20.13% |
27.23% |
|
Free Cash Flow Margin (Total Investing Cash Flow) |
8.74% |
2.58% |
-6.34% |
6.97% |
-14.38% |
7.90% |
3.80% |
-32.22% |
16.33% |
25.54% |
Source: Company Data, Khaveen Investments
As the company’s profitability improved, its cash flow also strengthened in 2023 with an FCF margin of 27.23% (capex only), rising from 13.98% in 2014. We examined the company’s capex below.
Capex
|
Salesforce Capex ($ mln) |
2014 |
2015 |
2016 |
2017 |
2018 |
2019 |
2020 |
2021 |
2022 |
2023 |
|
Capital Expenditure |
-417 |
-710 |
-464 |
-534 |
-595 |
-643 |
-710 |
-717 |
-798 |
-736 |
|
CapEx/Revenue |
7.8% |
10.6% |
5.5% |
5.1% |
4.5% |
3.8% |
3.3% |
2.7% |
2.5% |
2.1% |
|
CapEx/Fixed Assets |
5.8% |
10.1% |
4.0% |
4.3% |
3.0% |
1.6% |
1.6% |
1.0% |
1.1% |
1.0% |
Source: Company Data, Khaveen Investments
One of the reasons for the company’s strong FCF margins is its low capex. In the past 10 years, its capex as % of revenue has been declining as its revenue grew stronger than its capex. In 2023, its capex only accounted for a minor portion of revenue, at 2.1%. Furthermore, management guided that capex this year “is expected to be slightly below 2% of revenue” in its latest earnings briefing. Moreover, its capex as % of fixed assets also shows a similar trend, as it declined over the past 10 years. In the past 3 years, it had remained stable at around 1% of its fixed assets. Therefore, we believe this highlights the company has a lean business model.
As mentioned in the first point, Salesforce has a partnership with AWS, the leading global cloud provider, allowing it to leverage AWS’s cloud services, offering products like Data Cloud, Service Cloud, and Sales Cloud on the AWS marketplace, and its Heroku platform utilizes AWS’s EC2 instances. Thus, the company does not need to incur substantial capex to build out additional physical data center capacity.
Stock-based Compensation and Share Repurchases
|
Salesforce Stock-based Compensation and Share Repurchases |
2017 |
2018 |
2019 |
2020 |
2021 |
2022 |
2023 |
|
Shares Outstanding (‘mln’) |
735 |
775 |
850 |
930 |
974 |
997 |
984 |
|
Growth % |
5.4% |
9.7% |
9.4% |
4.7% |
2.4% |
-1.3% |
|
|
Issuance of Common Stock ($ mln) |
650 |
704 |
840 |
1,321 |
1,289 |
861 |
1,954 |
|
Repurchase of Common Stock ($ mln) |
0 |
0 |
0 |
0 |
0 |
-4,000 |
-7,620 |
|
Net Share Repurchases ($ mln) |
650 |
704 |
840 |
1,321 |
1,289 |
-3,139 |
-5,666 |
|
Growth % |
8.3% |
19.3% |
57.3% |
-2.4% |
-343.5% |
80.5% |
|
|
Stock-Based Compensation ($ mln) |
997 |
1,283 |
1,785 |
2,190 |
2,779 |
3,279 |
2,787 |
|
Growth % |
28.7% |
39.1% |
22.7% |
26.9% |
18.0% |
-15.0% |
|
|
Net of Share Repurchases and Stock-based Compensation ($ mln) |
1,647 |
1,987 |
2,625 |
3,511 |
4,068 |
140 |
-2,879 |
|
Increase in Shares (‘mln’) |
40 |
75 |
80 |
44 |
23 |
-13 |
|
|
Net/Increase in Shares ($) |
49.7 |
35.0 |
43.9 |
92.5 |
6.1 |
221.5 |
|
|
Average Stock Price ($) |
90.1 |
132.0 |
154.9 |
200.6 |
247.0 |
176.4 |
203.7 |
Source: Company Data, Macrotrends, Khaveen Investments
In its latest earnings briefing, Salesforce announced a $10 bln increase in its stock buybacks. Based on the table above, we compiled its shares outstanding, share buybacks and stock-based compensation. In 2023, the company’s shares outstanding decreased for the time as its share buybacks increased by 80.5% compared to the previous year while its stock-based compensation decreased. The company has started conducting share buybacks in the past 2 years. In 2022, while it had share buybacks at a net of $3.1 bln, its shares outstanding still grew positively by 2.4% as its stock-based compensation growth was still high at 18%. Prior to 2023, the company’s shares outstanding grew every year. Comparing the net of share repurchases and stock-based compensation, only in 2023 its stock buybacks were higher than stock-based compensation.
Furthermore, we divided this by the increase in its shares outstanding for each year. In 2023, we calculated an average net per increase in shares of $221.5 which is higher compared to its average stock price, indicating it is negative to shareholders as it repurchased stock at a higher price than its average stock price. This could be due to its share repurchases conducted in the latter half of the year as its stock price surged. In the years prior, we calculated its net of share repurchase and stock-based compensation per share increase much lower than its average stock price which, we believe, is due to its stock-based compensation offering stock to employees at prices much lower than its stock price.
Outlook
Overall, we expect the company to continue to sustain strong FCF margins due to its lean business model with consistently low capex supported by the AWS partnership, reducing the need for physical data center investment). In 2023, capex was only 2.1% of revenue, with management guiding a similar figure at below 2% for the current year. Additionally, its capex % of fixed assets is stable at only 1% of fixed assets. Going forward, we expect its capex to remain stable and base our forecast on its 3-year average capex % fixed assets of 1%. Furthermore, the company’s stock-based compensation declined in 2023 as part of its restructuring plan supporting its cash flow margins. However, while its cash flow has risen, it does not reflect the change in shares. We compiled the table below showing its FCF per share growth, indicating while its cash flow has been increasing, its FCF per share growth has been lower than its FCF growth due to shareholder dilution. However, in 2023, its FCF per share growth was higher than its FCF growth as its shares outstanding decreased following its massive share buybacks. In 2024 and beyond, we expect this to continue, based on its 2023 shares outstanding growth, we projected its FCF per share to continue rising higher than its FCF growth.
|
FCF Projections ($ mln) |
2017 |
2018 |
2019 |
2020 |
2021 |
2022 |
2023 |
2024F |
2025F |
2026F |
2027F |
2028F |
|
Shares Outstanding |
735 |
775 |
850 |
930 |
974 |
997 |
984 |
971 |
959 |
946 |
934 |
921 |
|
Growth % |
5.4% |
9.7% |
9.4% |
4.7% |
2.4% |
-1.3% |
-1.3% |
-1.3% |
-1.3% |
-1.3% |
-1.3% |
|
|
FCF |
2,212 |
2,803 |
3,688 |
4,068 |
5,283 |
6,311 |
9,492 |
10,362 |
12,657 |
15,355 |
17,466 |
19,386 |
|
Growth % |
26.7% |
31.6% |
10.3% |
29.9% |
19.5% |
50.4% |
9.2% |
22.1% |
21.3% |
13.7% |
11.0% |
|
|
FCF per share |
3.01 |
3.62 |
4.34 |
4.37 |
5.42 |
6.33 |
9.65 |
10.67 |
13.20 |
16.23 |
18.71 |
21.04 |
|
Growth % |
20.2% |
20.0% |
0.8% |
24.0% |
16.7% |
52.4% |
10.6% |
23.8% |
22.9% |
15.3% |
12.5% |
Source: Company Data, Khaveen Investments
Company Data, Khaveen Investments
Risk: AI CRM Competition
While we believe the company could benefit from AI CRM to boost its growth with signs from its increase in RPO by 17%, we believe one of the key risks is competition from other CRM competitors which may affect Salesforce’s growth outlook and ability to achieve our forecasted growth rate. For example, in our previous analysis, we highlighted competition from smaller CRM players integrating AI features poses a risk to Salesforce’s AI leadership. With 880 CRM solutions in the market, smaller firms focusing on AI could intensify competition. However, we believe Salesforce’s market leadership and large customer base may support its competitive advantage.
Valuation
Company Data, Khaveen Investments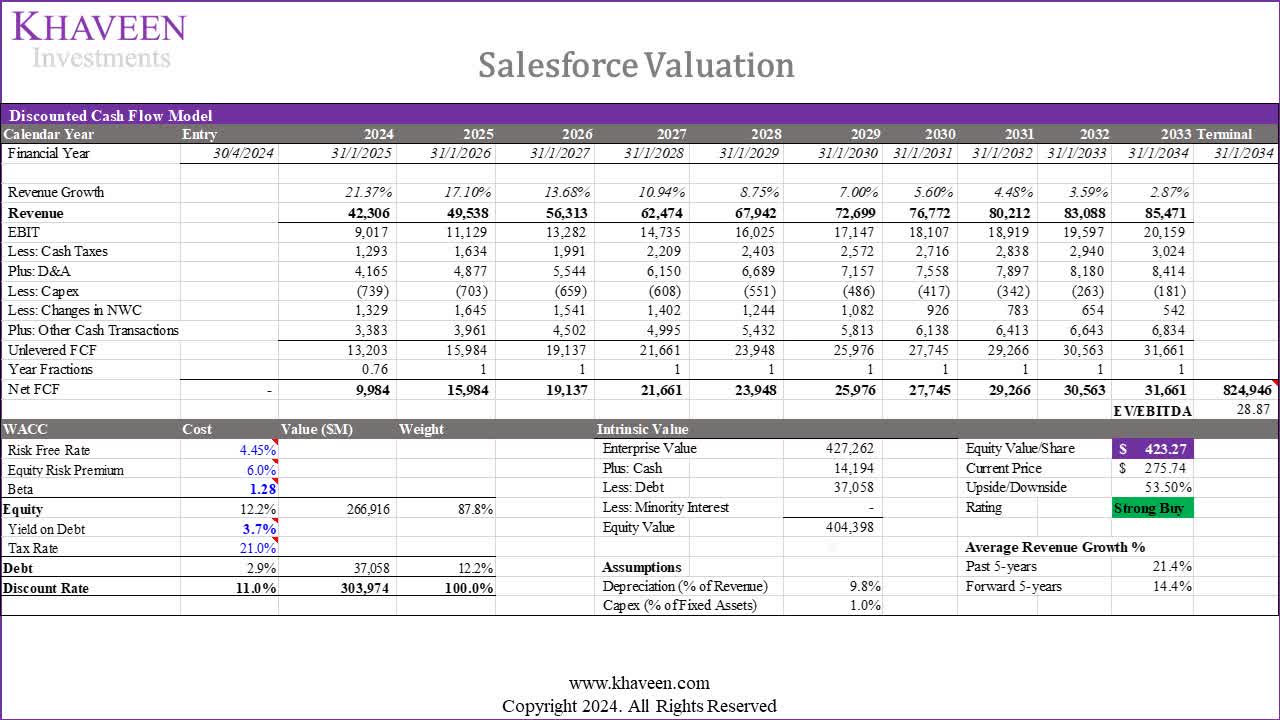
We updated our valuation of Salesforce based on DCF with a revision to our earnings and margins forecasts. We maintained our previous revenue projections but tapered down to a 5-year forward average of 14.4%. On the other hand, we projected its net margin to increase to 13.31% by 2028 compared to 11.7% previously and FCF margins to rise to 28.18% compared to 14.07%. Based on a discount rate of 11% (company’s WACC), and EV/EBITDA based on the top software companies of 28.87x, we derived an upside of 55.24%.
|
DCF Valuation Upside |
53.50% |
|
Stock Buyback Adjustment |
1.30% |
|
Total Upside |
54.81% |
|
Price Target |
$426.86 |
|
Current Price |
$275.74 |
Source: Company Data, Khaveen Investments
Furthermore, we accounted for an adjustment of 1.3% due to its stock buybacks to our DCF valuation upside, for a total upside of 54.81%.
Verdict
All in all, Salesforce’s profitability has been improving and has surpassed our expectations. However, its gross margins were stable and flattish, which we believe shows the company not benefiting from economies of scale due to its software business model as well as passing down cost savings to customers through bundle deals. Moreover, its rising proportion of employee costs indicates an increased allocation of employee costs required to sustain its revenues. Overall, we expect Salesforce gross margins to remain stable due to the minimal net effect of economies of scale on the company. Nonetheless, there has been an improvement in its net margin, due to its 2023 restructuring as well as various factors such as leveraging its sales channel partner network, strengthening existing customer relationships, and solidifying its brand presence, which, we believe, have led to a long-term decline in SG&A expenses as a percentage of revenue, and we expect to continue going forward. We project its SG&A to decline to 40.76% of revenue by 2026, with net margins reaching 13.31% by 2028. Furthermore, we believe Salesforce maintains robust FCF margins due to its efficient business model and low capital expenditure. The company has conducted substantial stock buybacks over the past two years, and we expect the announcement of further buybacks of $10 bln to further enhance its free cash flow per share going forward.
Our updated valuation suggests significant upside potential of 54.81% with a price target of $426.86, higher than our previous analysis ($294.61), mainly due to higher revised net margin to reach 13.31% by 2028, up from our previous estimate of 11.7%, with free cash flow margins expected to rise to 28.18% (14.07% previously). Thus, we maintain our Strong Buy rating for Salesforce.
Analyst’s Disclosure: I/we have a beneficial long position in the shares of CRM either through stock ownership, options, or other derivatives. I wrote this article myself, and it expresses my own opinions. I am not receiving compensation for it (other than from Seeking Alpha). I have no business relationship with any company whose stock is mentioned in this article.
No information in this publication is intended as investment, tax, accounting, or legal advice, or as an offer/solicitation to sell or buy. Material provided in this publication is for educational purposes only, and was prepared from sources and data believed to be reliable, but we do not guarantee its accuracy or completeness.
Seeking Alpha’s Disclosure: Past performance is no guarantee of future results. No recommendation or advice is being given as to whether any investment is suitable for a particular investor. Any views or opinions expressed above may not reflect those of Seeking Alpha as a whole. Seeking Alpha is not a licensed securities dealer, broker or US investment adviser or investment bank. Our analysts are third party authors that include both professional investors and individual investors who may not be licensed or certified by any institute or regulatory body.