Summary:
- Schlumberger is a top-ranked “Magic Formula” stock, combining high earnings yield and return on invested capital for strong performance.
- The Magic Formula, by Joel Greenblatt, identifies stocks that are both “cheap” and high-quality based on earnings yield and ROIC.
- Schlumberger, like Baker Hughes, is benefiting from expanding margins in the oil and gas equipment sector.
- If the US has a new administration in 2025 that encourages more drilling, the equipment sub-sector of energy could be a benefactor.
curraheeshutter
Another Magic Formula high scorer
Continuing on with my series of the oil and gas equipment sub-sector of energy, Schlumberger (NYSE:SLB) is yet another highly ranked “Magic Formula” stock. The Magic Formula is Joel Greenblatt’s screening method that adds together the earnings yield plus the return on invested capital percentages to create a score. The higher, the better. In this theory, earnings yield represents “cheap” and ROIC “quality” where management deploying capital efficiently will result in higher returns on invested capital.
Here are the current scores for the 3 energy equipment companies that currently screen highly on Magic Formula:
Score data from Bank of America Global Research and Seeking Alpha [note: EV/EBITDA used as earnings yield score]
| STOCK | EARNINGS YIELD | ROIC | SCORE |
| (SLB) | 13.3 | 13.9 | 27.2 |
| (HAL) | 15.15 | 15.2 | 30.35 |
| (BKR) | 11.1 | 9.1 | 20.2 |
With all 3 of these oil and gas equipment and services names crossing scores of 20 [20 or higher are considered good values], this is a sector sub-segment that is operating on an upward swing of its cycle all the while dropping in price. Looking over the reports of all three, margin expansion due to cost optimization and digital technology advances seem to be helping these companies improve returns on capital across the board. This may be one of the first non-tech sectors where we see artificial intelligence producing profits.
On the flip side, as oil prices dip, we see further CAPEX spending decreases as new oil well construction drops for end user partners. This is noted across the industry by Schlumerger, Baker Hughes and Haliburton. My thesis is if these companies end up in an environment where further drilling is encouraged [regardless of oil price], equipment names will still flourish as competition chases after each other.
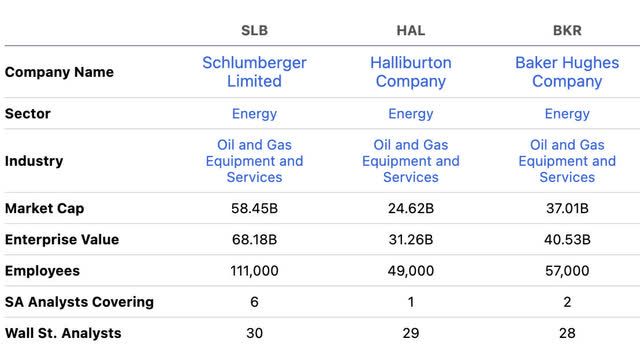
Should Trump be re-elected President, he campaigned on encouraging and permitting more domestic oil production, as well as negotiating with OPEC to increase their output as well. This happened the first go around and could happen again. If this scenario plays out, I’m buying the drilling equipment suppliers and refiners. If Harris is elected, I’m buying the oil sellers, like Exxon (XOM) and Chevron (CVX). For now, this whole segment looks like a buy with lots of anticipated growth. Schlumberger is the largest of the group by market cap.
Percent off all-time high
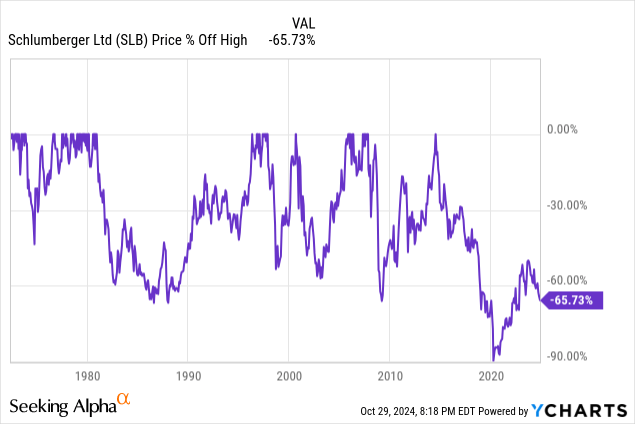
At -65.73% off its all-time high, the last time we witnessed share prices above $100 on the stock was during the previous Trump era. Could this price action return? I’m betting the set-up could be there should further oil output be encouraged domestically and internationally.
The gains may need to be captured within a time frame before a drop in oil prices shuts down well construction regardless of permitting or deal-making, but the opportunity could be there.
A 5-year comparison of WTI prices and SLB
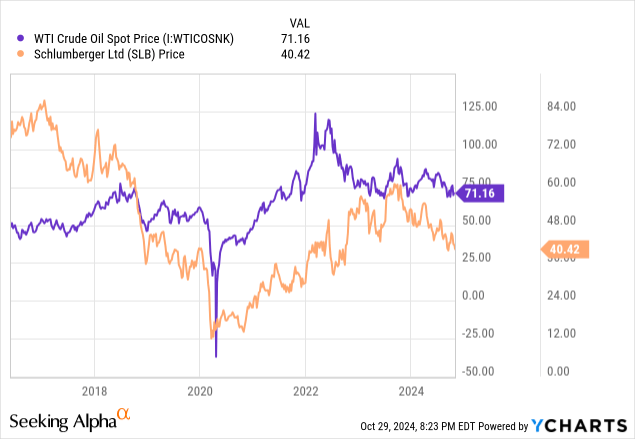
For the most part, if you draw a long-term chart of WTI crude overlaid on Schlumberger’s stock price, they will follow one another pretty accurately. The one divergence where Schlumberger and the segment in general traded above WTI was during the first Trump administration, where a drop in oil prices was not just a supply/demand issue, it was an encouraged oversupply that drove down oil prices yet kept the equipment names busy. The COVID oil crash was the other extreme, but it still provided a couple of years of strength where Schlumberger’s price trended above oil.
In my previous article on Baker Hughes (BKR), I noted that this specific segment of the energy sector is seeing their margins expand, and Schlumberger is no different. All are developing unique high margin digital software solutions for ongoing project management.
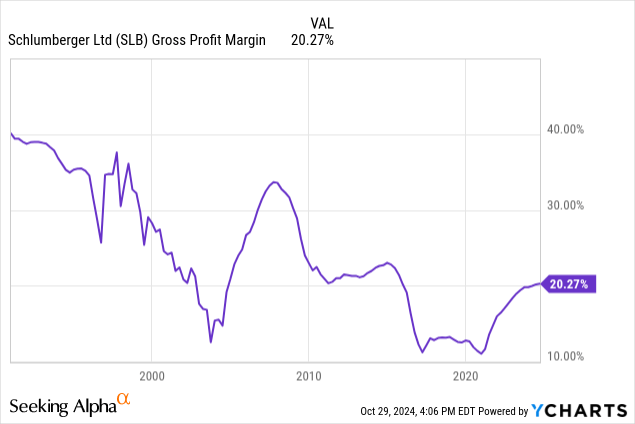
Schlumberger’s comments on margin expansion from their most recent 10Q:
SLB delivered strong third-quarter 2024 results, achieving earnings growth and margin expansion due to its ongoing focus on cost optimization, greater adoption of SLB’s digital products and solutions, and the contribution of long-cycle projects in deepwater and gas.
This performance was achieved despite an environment where short-cycle activity growth softened, and some international producers exercised cautious spending triggered by lower oil prices and ample global supply, while land activity in the US remained subdued.
Third-quarter 2024 global revenue of $9.2 billion was essentially flat with the second quarter of 2024. Revenue grew sequentially in the Middle East & Asia and offshore North America but was offset by a decline in Latin America, while Europe & Africa revenue was flat sequentially.
Measuring the growth rates
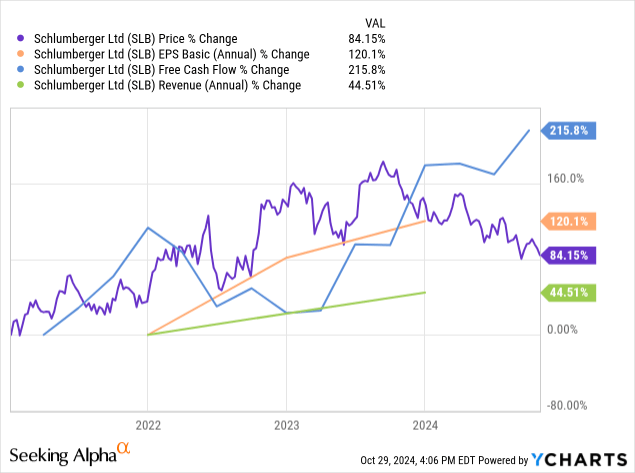
In all of my articles, I like to measure the reflexive patterns of short or long-term growth rates in profitability versus share price appreciation. In this case, we see the drop in share price now putting the stock well below its 5-year growth rates in earnings per share and free cash flow.
Revenue is the only laggard, which is a similar pattern to Baker Hughes. For the most part, if you use the Magic Formula screener, you’ll find a large number of stocks also passing this test of value.
Revenue exposure
| Segment | Percent of revenue |
| Digital & Integration |
11.8% |
| Reservoir Performance | 19.9% |
| Well Construction | 36.2% |
| Production Systems | 33.8% |
Here is a description of each segment from Schlumberger’s most recent 10K:
Digital & Integration – Combines SLB’s industry-leading digital solutions and data products with its integrated offering of Asset Performance Solutions [“APS”]. This Division enables greater performance for our customers by reducing cycle times and risk, accelerating returns, increasing productivity, and lowering costs and carbon emissions.
Reservoir Performance – Consists of reservoir-centric technologies and services that are critical to optimizing reservoir productivity and performance. Reservoir Performance develops and deploys innovative technologies and services to evaluate, intervene, and stimulate reservoirs providing customers with greater insights into their assets and maximizing their return on investment.
Well Construction – Combines the full portfolio of products and services to optimize well placement and performance, maximize drilling efficiency, and improve wellbore assurance. Well Construction provides operators and drilling rig manufacturers with services and products related to designing and constructing a well.
Production Systems – Develops technologies and provides expertise that enhance production and recovery from subsurface reservoirs to the surface, into pipelines, and to refineries. Production Systems provides a comprehensive portfolio of equipment and services including subsurface production systems, subsea and surface equipment and services, and midstream production systems.
Most recent earnings results:
EPS of $0.89 beats by $0.01 | Revenue of $9.16B (10.22% Y/Y) misses by $144.43M
Consistent with the industry, profitability is holding up well but revenues are trending flat with lower CAPEX spending by integrated oil & gas producers. The top-line misses may be presenting some nice entry points for a sub-sector that continues to increase their gross profit margins.
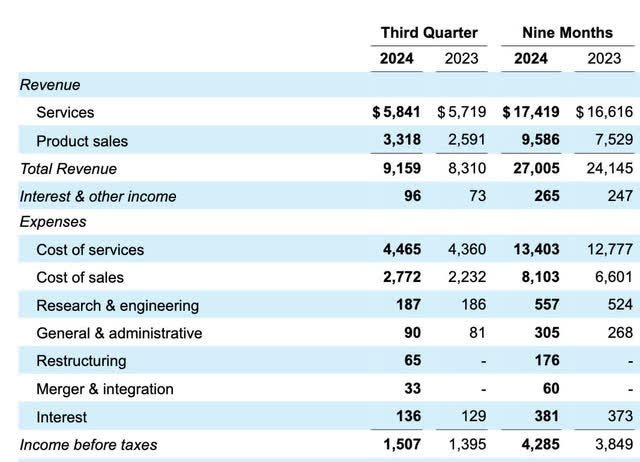
Although the market will see the top-line miss and create a sell-off, they fail to realize that the number is still up 10.22% year over year. Here we can see total revenue and EBIT all up year over year on a quarter-to-quarter comparison and a nine-month comparison.
By Region
| Region | Percent of revenue |
| North America | 18.4% |
| Latin America | 18.44% |
| Europe & Africa | 26.57% |
| Middle East & Asia | 36.05% |
| Other | 0.51% |
Regionally, as consistent with the equipment names in the energy sector, the Middle East is the largest territory by revenue. With North America being the smallest, there could be a lot of room for growth should project permitting get a tailwind.
The story of the stock
From CEO Olivier Le Peuch’s most recent earnings call:
SLB’s digital products and services continued to accelerate and we saw continued growth in the Middle East and Asia, fueled by oil capacity expansions and strong gas activity as well as offshore projects.
Although Le Peuch noted on the most recent call that most oil and gas companies are being more cautious in CAPEX spending for well development, digital products and services continue to be a growth driver. This is all the software and analytics that go into the ongoing management and reservoir data interpretation. Baker Hughes noted a similar growth trajectory.
Software and AI demand is increasing to make existing oil projects more efficient, rather than having to move on to the new project too hastily. As with all software suites, these are high-margin businesses and most likely nice contributors to increasing margin expansion in the future. Who knew AI would be making an appearance in the antithesis sector of IT?
Balance sheet
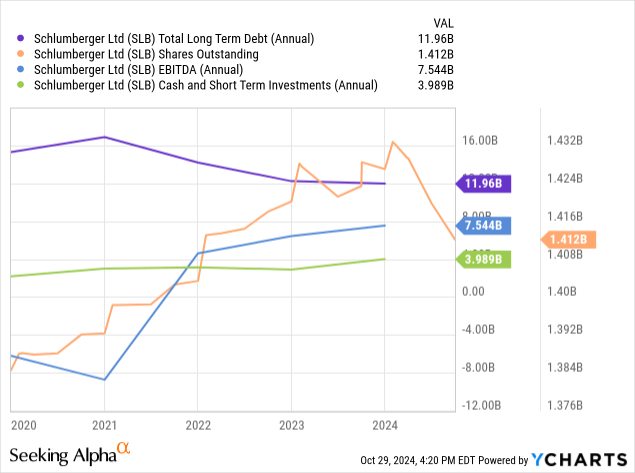
This balance sheet is consistent with the other players in this energy segment [equipment]. Long-term debt less than 2 X EBITDA, with cash and short-term investments at around 33% of total long-term debt.
All of these companies [Baker Hughes, Halliburton, and Schlumberger] had large amounts of share dilution during COVID when almost all oil CAPEX came to a standstill. Schlumberger has been more aggressive than Baker Hughes in reducing share count as a form of return of capital to shareholders, and has an equally strong a balance sheet.
Dividend and coverage
Seeking Alpha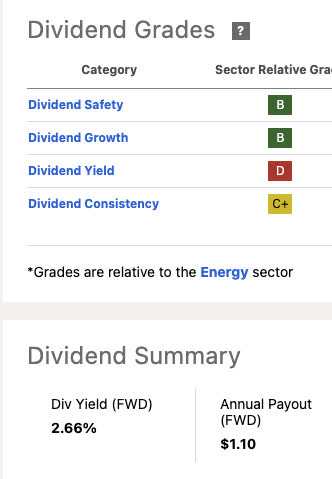
This sub-segment of energy is right in that mid-2% yield range with room to grow now that the industry is stabilized. Schlumberger has the highest yield of the 3 large cap oil & gas equipment companies and with a TTM free cash flow per share of $3.25, the payout ratio is only 33% of free cash flow if we pull TTM numbers forward.
Growth expectations and valuation
This whole sub-sector is expected to grow for years. Although there are all kinds of variables we can throw into the mix, software advances and the ability to service brownfield [aging oil projects] to extract further supply has CEOs sounding positive on guidance that they can begin to avoid some of the cyclicality of oil in general. Software sales increasing are also a trend that could curb cyclicality.
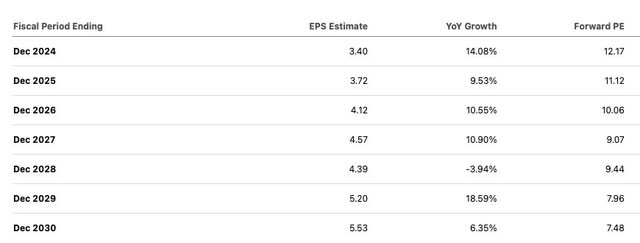
Firstly, looking at a standard PEG ratio valuation, earnings are expected to grow 9.4% between 2024 and 2025. As the PEG ratio is simply a price where a ratio of 1 or less is a good deal as determined by the P/E ratio being divided by the growth rate, we can find the price where a ratio of 1 hits by using the growth rate without the percent sign as our multiplier and the FWD 2025 EPS prediction as our multiplicand. In this instance, we would have 9.4 X 3.72 = $34.96.
Since the company is expected to grow, albeit slowly, the “owner earnings” discount model is more appropriate to evaluate the stock than a PEG ratio looking for stocks with high-growth rates and often low to no dividends.
The “owner earnings” discount is simply the TTM net income, adding back depreciation and amortization and subtracting out TTM CAPEX. The final amount is then discounted by the 10-year Treasury “risk-free” rate. It currently stands at 4.25%. This was popularized by Warren Buffett and the argument is that if earnings are expected to increase for the foreseeable future, then a stock with a higher earnings yield than the risk-free rate is better since it grows and the other is static.
In the case of Schlumberger, we have the following:
All numbers in millions courtesy of Seeking Alpha
- $4,478 TTM Net Income
- $1,927 TTM Depreciation
- $2,422 TTM CAPEX
Equation: [$4,478+$1,927]-$2,422= $3,983 million “owner earnings”
- $3,983 / discounted at 4.25% = $93,717 “fair market cap”.
- $93,717 million divided by 1,412 million shares outstanding = $66.37 / share fair value. Currently trading at 60.9 % of fair value.
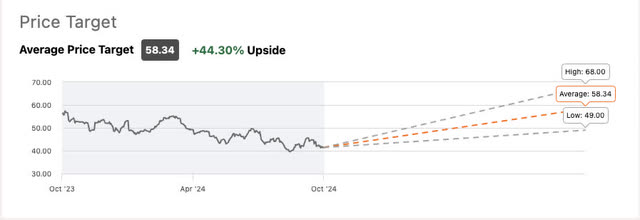
My average fair value between my growth model and my value model pencils out at an average of $50.66. This is pretty close to Wall St. Average Price targets, and a near 40% upside seems reasonable from here.
Risks and summary
As with all of the equipment companies in energy, Middle Eastern exposure is by far the highest revenue segment and is an area of increasing instability. The US has a lot of room to grow, and that could happen should we have a new administration that encourages more oil drilling, development and possibly adds subsidies to the mix or tax breaks in some fashion.
Should both oil prices tank and CAPEX spending drop, this could leave this segment of energy worse off than others in energy.
Schlumberger is cheap based on owner earnings and has future growth expected through 2030 by consensus analyst estimates as overall energy demand [, especially in nat gas and LNG] is expected to grow along with electricity demand as gas is one of the leading feedstocks for power plants. Schlumberger is the largest by market cap of this trinity of oil and gas equipment companies, and ranks second amongst the 3 in Magic Formula score to boot. Buy.
Analyst’s Disclosure: I/we have a beneficial long position in the shares of SLB, HAL, BKR, XOM, CVX either through stock ownership, options, or other derivatives. I wrote this article myself, and it expresses my own opinions. I am not receiving compensation for it (other than from Seeking Alpha). I have no business relationship with any company whose stock is mentioned in this article.
The information provided in this article is for general informational purposes only and should not be considered as financial advice. The author is not a licensed financial advisor, Certified Public Accountant (CPA), or any other financial professional. The content presented in this article is based on the author's personal opinions, research, and experiences, and it may not be suitable for your specific financial situation or needs.
Seeking Alpha’s Disclosure: Past performance is no guarantee of future results. No recommendation or advice is being given as to whether any investment is suitable for a particular investor. Any views or opinions expressed above may not reflect those of Seeking Alpha as a whole. Seeking Alpha is not a licensed securities dealer, broker or US investment adviser or investment bank. Our analysts are third party authors that include both professional investors and individual investors who may not be licensed or certified by any institute or regulatory body.

