Summary:
- Snap’s recent earnings surprises have put the stock back on the radar for technology investors.
- The company reported an increase in revenues and per-share adjusted earnings that surpassed analyst estimates.
- The stock faces resistance at $17.50, and a break above this level could lead to further bullish momentum.
champpixs
One of the lesser-watched social media companies can be found in SNAP Inc. (NYSE:SNAP) but recent earnings surprises could put this stock back on the radar for technology investors in coming sessions. Most of the recent optimism has been fueled by better-than-expected earnings figures for the first-quarter period, and the initial market reaction to this information has helped to propel share prices higher by nearly 30% (marking the best single-session gains since 2022).
For the period, Snap reported an increase in revenues from $989 million the previous year to $1.19 billion, which surpassed analyst estimates of $1.12 billion, and marked an annualized gain of 21%. Per-share adjusted earnings posted at $0.03, surpassing the market’s consensus expectations calling for a loss of -$0.05.
Adjusted EBITDA for the period posted another upside surprise (at $46 million) while market expectations were again calling for losses (-$68 million). According to the company’s earnings presentation, the primary reasons Snap was able to generate these positive results can be found in emerging bull trends in revenue growth and with improvements in managing operating expenses.
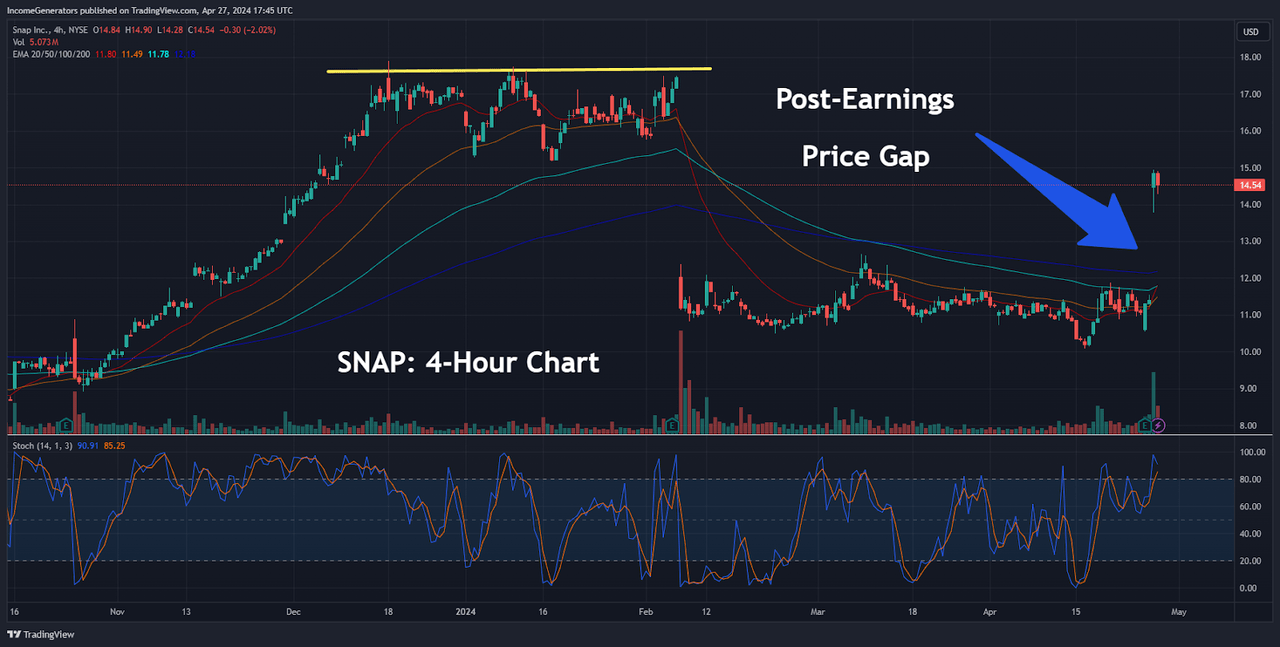
Post-Earnings Price Gap (Income Generator via TradingView)
Initial market reactions to this information were quite positive (with share prices gapping higher and surging by nearly 30% after the report was released) and it now looks as though follow-through could be quite substantial if these surprise results provide continued positive trend momentum and SNAP bulls are able to overcome important near-term resistance levels.
On the 4-hour charts, we can see that recent activity in SNAP share prices has been quite volatile. In anticipation of this most recent earnings release, we already saw significant price gaps to the downside – and this essentially tells us that market investors were quite apprehensive about holding long positions in SNAP prior to this specific earnings release.
Unfortunately, this bearish activity created a very clearly defined resistance level just above $17.50, which could prove to be quite formidable if SNAP bulls are not able to maintain this positive momentum going forward. That said, we do need to assess this price formation from a longer-term perspective because potential changes in trend activity from this area start to look very different when we view these moves from a broader context.
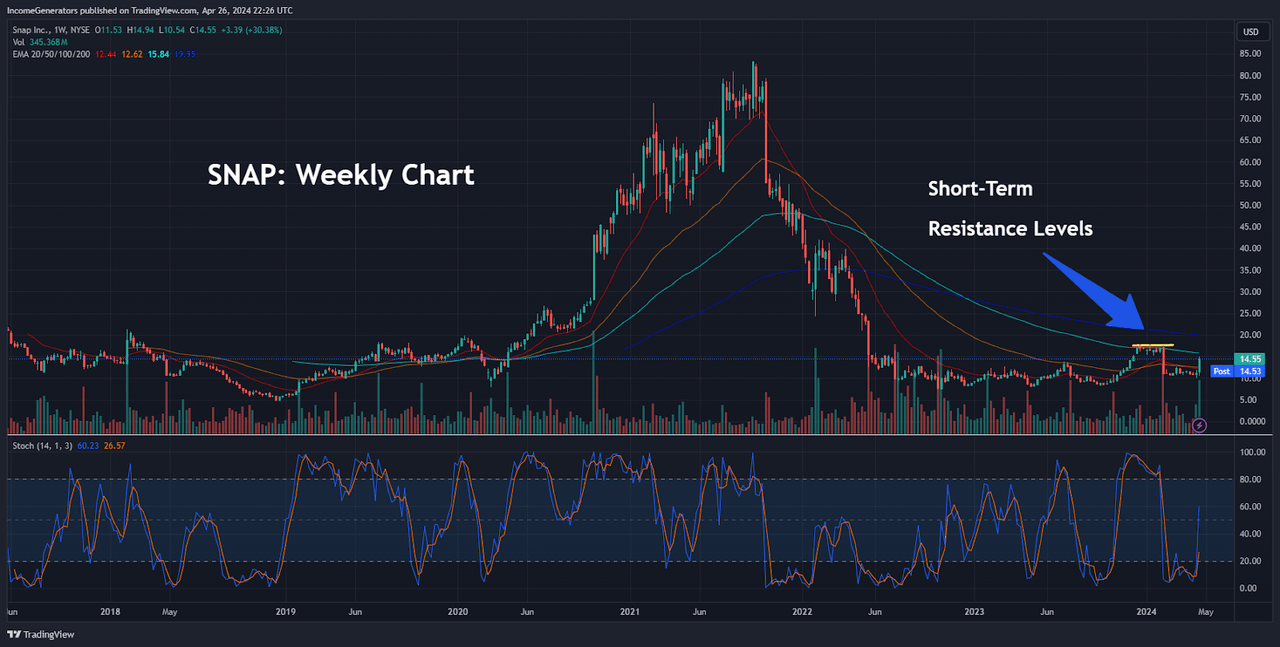
SNAP: Weekly Chart (Income Generator via TradingView)
In the chart above, we can see the longer-term price history for SNAP using the weekly charts. We will be doing a more in-depth analysis with this chart in the images that follow. But first, we wanted to view these recent resistance formations within the broader context of the stock’s price history. Specifically, shares of SNAP have been caught in a very tight sideways trading range that began in May 2022. Of course, this price structure formed after shares of SNAP encountered massive price moves originating from the prior all-time highs of $83.34 (which were printed in September 2021).
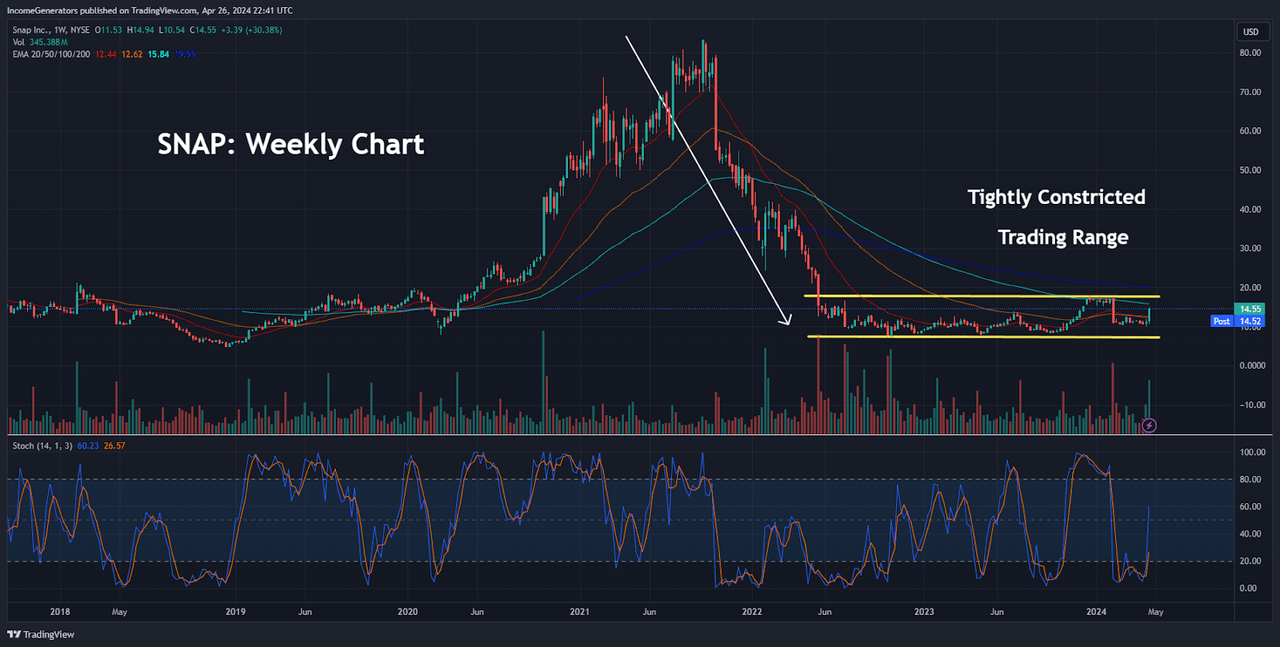
Tightly Constricted Trading Tange (Income Generator via TradingView)
In this chart, we have outlined the relative size of SNAP’s most recent trading range in comparison with the dramatically different price trends that have unfolded over the last 30 months.
Quite obviously, we can see that this recent trading range has been abnormally constricted – which indicates a period of extreme indecision amongst the stock market community. In terms of generalized trading concepts in technical analysis, the “conventional wisdom” often suggests that these types of abnormal constrictions on price action will often result in explosive moves. It should be noted that these types of trading ranges will not necessarily be followed by surging bullish price action. In fact, the exact opposite could also occur, depending on the directional follow-through that is ultimately witnessed.
To determine which direction is most likely, traders will often define important levels of support and resistance (to define the trading range) and then wait for a directional break outside of that trading range. Since May 2022, SNAP shares have encountered strong resistance and price failures near the $17.50 level (top of the range). Conversely, SNAP shares have encountered strong support and price gains near the $7.85 level (bottom of the range).
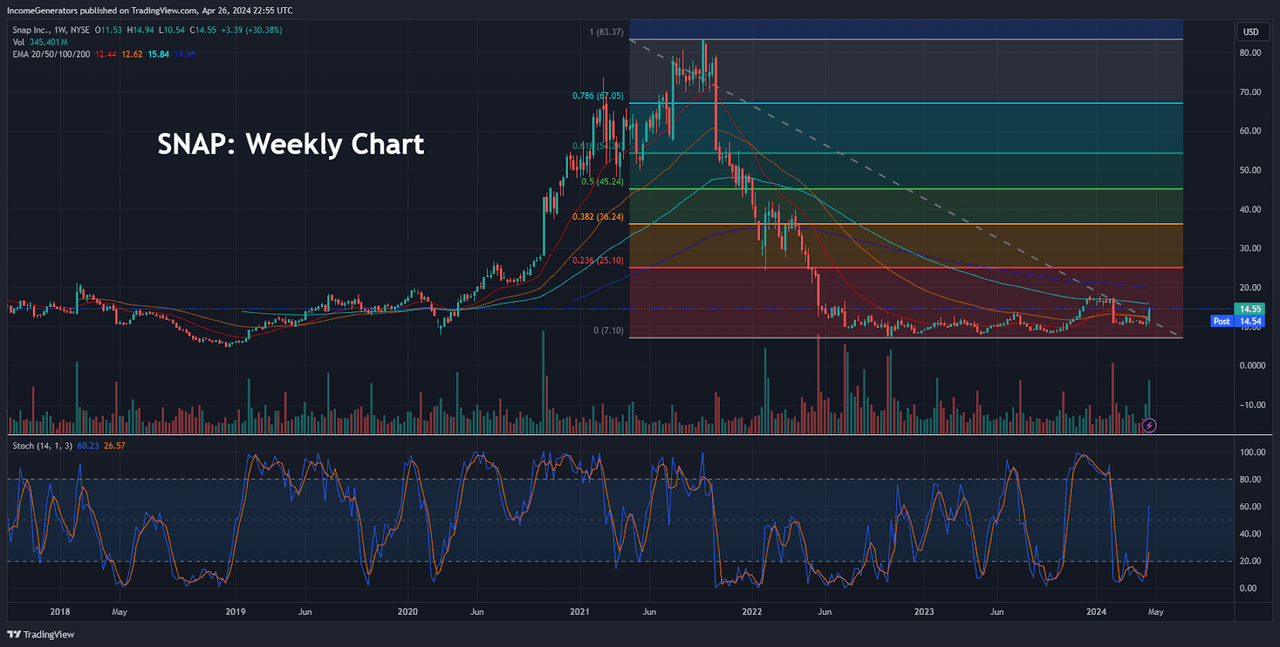
Fibonacci Retracement Targets (Income Generator via TradingView)
In the chart above, we have outlined a Fibonacci analysis of the aforementioned price moves. In the event that markets are able to continue propelling SNAP’s current positive momentum (and break through important resistance levels near $17.50), our technical outlook will become strongly bullish, and we will need to start outlining upside price targets. Given the size and extent of the prior price moves, Fibonacci retracement levels might provide the clearest means for accomplishing this task.
First, we can see that the 23.6% Fibonacci retracement of this dominant price move comes within very close proximity to the stock’s January 2022 price lows (near $24.30) and psychological price levels at $25. Since broken support levels tend to be viewed as future resistance levels, this trading zone clearly marks a price level confluence that should be closely noted by traders.
Following this area, bullish trend runs would next target the 38.2% Fibonacci retracement of this dominant trend activity, which is currently found near $36.20 and a relatively small distance from the $38.90 resistance zone that ultimately generated the final leg of selling pressure that developed prior to our most recent constricted trading range. Finally, the 61.8% Fibonacci retracement is typically viewed as the following upside price target, and this area is currently located just above $54.20. Interestingly, this price level lies within incredibly close proximity to the support level of $53.20, which failed to hold prices when the stock began making its dominant descent (following the all-time highs) in October 2021.
As a final point, we also want to make sure to discuss the stark differences that have become apparent in SNAP’s Stochastics indicator readings on the 4-hour and weekly price charts. Specifically, indicator readings on the 4-hour charts show that while stochastic metrics have ventured into overbought territory, they are already starting to roll over (without seeing much of a material retracement in price action itself).
Ultimately, this suggests that these indicators are likely to move out of overbought territory quite quickly – and this could encourage additional buying activity from the bullish side of the market. Moreover, this argument is actually better aligned with the longer-term indicator readings for the stock. On the weekly charts, stochastic metrics have only recently moved out of oversold territory – and this suggests that SNAP would need to make a substantial move higher before overbought readings start to become a problematic issue from the longer-term perspective.
Altogether, we think that Snap’s most recent earnings report has created a technical environment that could experience very little headway (selling pressure) going forward. Near-term, we must pay close attention to the market’s bullish abilities to push through key resistance levels at $17.50. Failures here (or lack of significant follow-through) would invalidate the bullish positioning stance – and suggest that the stock is more likely to return to the relatively uneventful trading range that has been in place since May 2022.
Analyst’s Disclosure: I/we have a beneficial long position in the shares of SNAP either through stock ownership, options, or other derivatives. I wrote this article myself, and it expresses my own opinions. I am not receiving compensation for it (other than from Seeking Alpha). I have no business relationship with any company whose stock is mentioned in this article.
Seeking Alpha’s Disclosure: Past performance is no guarantee of future results. No recommendation or advice is being given as to whether any investment is suitable for a particular investor. Any views or opinions expressed above may not reflect those of Seeking Alpha as a whole. Seeking Alpha is not a licensed securities dealer, broker or US investment adviser or investment bank. Our analysts are third party authors that include both professional investors and individual investors who may not be licensed or certified by any institute or regulatory body.
