Summary:
- SNAP faces challenges with modest revenue growth, persistent financial losses, and strategic uncertainties in a competitive digital landscape.
- Despite a 10% increase in daily active users, SNAP has struggled to translate this growth into substantial revenue gains.
- SNAP’s guidance for Q1 2024 reflects a rather discouraging outlook, attributed primarily to the traditionally slow advertising spend in the first quarter and a broken business model.
- Even after a significant drop in share price, SNAP’s valuation remains high, implying annual top-line growth of 23.8% for the next 10 years —a target we consider unrealistic.
Xavier Lorenzo/Moment via Getty Images
Our investment outlook for Snap Inc. (NYSE:SNAP) is negative. The company’s last quarter’s financial and operating performance illustrated severe challenges in growing profitably in line with user growth, due to the lack of cost control and the inability to translate user growth into profitability. While the management team seems to understand that the company is at a difficult juncture, we don’t see the willingness and ability to significantly change and turn this ship around. We suggest to closely monitor SNAP’s cost management and the development of ARPU (in particular from RoW) going forward. Assuming we are heading into a slowing economic environment in the next 12-18 months, we believe SNAP, as an advertising platform for discretionary consumer brands, is more at risk as compared to its main peers.
Q4 2023 Earnings Announcement
After reporting its Q4 2023 results, SNAP finds itself at a very difficult juncture. The company is facing low revenue growth, continuous negative EBITDA as well as long-term strategic uncertainties. While the company achieved a 10% increase in DAUs, it has not managed to translate its growing user base into profitable top-line growth.
Below we have summarised the key headlines of SNAP’s last earnings report:
- Slow Revenue Growth: With a 5% yoy increase in Q4 2023, revenue growth was mediocre, especially compared to META’s (META) reported +23.8% ad revenue growth in Q4 2023.
- Continuous Net Losses: Despite a slight improvement, Snapchat reported EBITDA of minus $248 million in Q4 2023 and minus $1.398 million for the full fiscal year 2023.
- Gross Profit Margin decline: Gross profit margin of SNAP declined by more than 7%-points, which, according to the company, is mainly the result of higher infrastructure costs due to increasing DAUs.
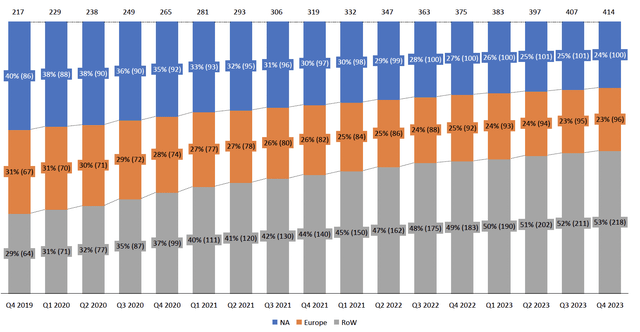
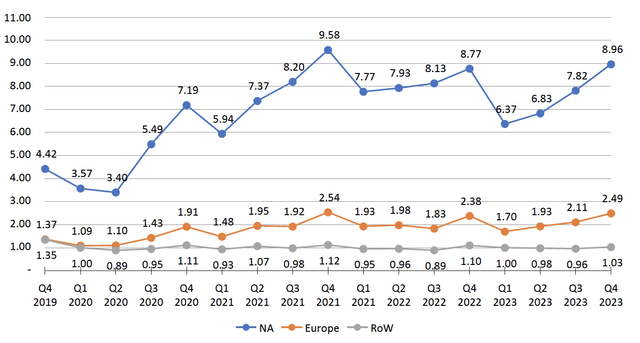
- Daily Active Users (DAUs): An increase of 10% to 414 million in Q4 2023, while ARPU was down to $3.29 in Q4 2023 (compared to $3.47 in Q4 2022). The increase of DAU is mainly coming from ROW countries (+19% yoy), where ARPU levels are significantly lower, i.e. $ 1.03 vs $8.96 in NA and $2.49 in Europe.
- Q1 2024 Guidance: The projected “Adjusted” EBITDA of negative $55-$95 million was probably one of the main reasons of the massive share decline.
- Long-Term Strategic Concerns: Despite efforts to diversify revenue, Snapchat+ and the development of new AI features, the outlook remains a concern and is raising questions about the long-term viability and competitiveness of Snapchat.
Challenges in Monetisation and Market Position
With stunning 414 million DAUs the company is “only” able to generate $4.6 billion net revenue, an average ARPU of $2.88 for the full fiscal year. Just to compare this, Facebook’s ARPU in Q4 was $13.12. The reason for this huge difference is that SNAP is seen as an upper-funnel marketing platform by its advertisers, while FB and IG are for lower funnel investments. SNAP users have a relatively low intention to purchase and while Evan Spiegel mentioned in the last earnings call that “things we’ve really focused on in the last couple of years is pivoting to lower funnel objectives for advertising partners and especially small- and medium-sized businesses.”, we believe the company has a long way to go. Being in this situation, i.e. pivoting to lower funnel combined with small- and medium-sized businesses as main customer, is not the position you want to be in as an advertising platform.
The 2021/2022 success of SNAP is partially a result of the shift in adverting budgets, which started in 2021. Brands began reallocating their ad budgets from META to SNAP and TikTok, which was mainly the result of Apple’s introduction of its App Tracking Transparency feature in April 2021. Given the sudden lack of tracking capabilities, customer acquisition costs went through the roof for most brands and as a result, they shifted some of the budget to SNAP and TikTok, assuming CACs would be better. The result of this shift was that conversion rates on these two platforms turned out to be even lower and hence CAC even higher. As a result, budgets were shifted back to META within 2-3 quarters.
You can nicely see this in the earnings report of SNAP and META back in the days (also see below). While META reported disappointing results for Q4 2021 with flat DAUs yoy, SNAP reported a revenue increase of 42% and an increase in DAU by 22%. ARPU of SNAP increased by 33% yoy in Q4 2021, while Meta’s ARPU was up 10%. As a result, the share prices of both companies reacted accordingly, i.e. SNAP went up 58.8% and META went down 26.4% after the earnings were announced.
As mentioned above, brand marketeers are using SNAP (and TikTok) as an upper funnel investment and brand building (usually around 20% of total budget). In times of an economic uncertainty, these budgets are the first to be reduced, as the main focus switches towards conversion and reducing CAC. While we don’t know how the economic environment is going to develop in the next 12 months, most of the brands we spoke to are in the very similar position and hence are rather cautious with marketing spend these days, in particular when it comes to upper-funnel spending.
Analyzing SNAP’s Q1 2024 Guidance and ARPU Trends
SNAP’s guidance for Q1 2024 is rather disappointing and mainly attributable to the traditionally slow advertising spend in the first quarter. A closer look at the ARPU growth trend over the past four years, with 2021 being an exception as discussed above, the issues of SNAP are becoming even more obvious. The chart below shows the quarter-on-quarter change of ARPU and revenue and indicates an increasing downward trend in the last 2 years, i.e. Q1’2023 revenue and ARPU being down 26% and 24% respectively.
SNAP QoQ ARPU and revenue change (Q1 vs Q4) (SNAP)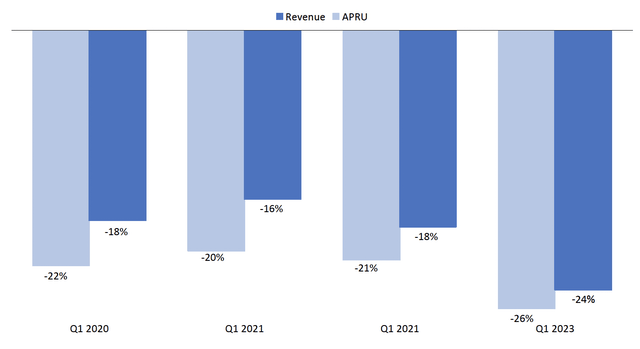
A key driver behind these downward trend shows in the geographic decomposition of SNAP’s DAUs. The majority of growth in DAUs is coming from the RoW regions (see in grey below), while DAUs in the US and Europe are more or less stagnating.
The regional breakdown in ARPU indicates massive differences and is the main reason of SNAPs low top-line growth. From an opex perspective, the strong increase of low ARPU users from RoW countries results in rising infrastructure costs, as reported by the company itself. These infrastructure costs are mainly hosting-related expenses, including storage, computing, and bandwidth.
We believe that SNAP’s earnings for Q1 2024 will likely fall short of expectations, as we don’t see any significant short-term catalysts for the company. Simply increasing the number of DAUs is unlikely to impress shareholders, however, the main focus will be on cost reduction and a clear path to better monetising the user base.
Cost-to-Serve vs APRU: A long-term concern
A simple analysis of the reported increase in infrastructure costs, compared with the incremental DAUs, suggests that “Cost to Serve” are around $0.61 per user (yes, AWS is expensive). While this number might be influenced by various other factors, the low ARPU of around $1 per DAU from these incremental users (mainly RoW regions) raises big concerns about the long-term sustainability of SNAP’s business model and its path to finally become profitable. Even SNAP disclosed these risks in its 10-K: “Our costs may increase faster than our revenue, which could seriously harm our business or increase our losses.” Questions analysts which are participating in the next earnings call should raise are:
- What is the decomposition of Snapchat+ users by Geography?
- What is the average retention rate of Snapchat+ users?
Stock-Based Compensation: A Closer Look at SNAP’s Practices
The 10K of SNAP has in total more than 20 pages related to compensation of the management and its directors. In total, the company’s stock-based compensation expenses in the last 3 years alone were $4.5bn (source: SNAP annual reports). Not bad for a company which lost more than $55bn of its market value in the last 2.5 years. The top 5 executives (excluding Evan Spiegel) new stock grants in 2023 alone were close to $100 million. Interesting is that these grants are subject to time-based vesting on a quarterly basis without any direct linkage to share price performance or shareholder value creation. On top, another provision says that “in the event an officer passes away while in service, the conditions for 100% of their share awards will be deemed satisfied”. While we hope this is not going to happen to any of them, we are not sure why this is good for and aligned with SNAP’s other shareholders.
In summary, all the above is a big red flag. Our opinion is that besides the insane size of these compensation packages, it’s the CEOs responsibility to properly align the interests of the management team with its shareholders and hence make the vesting dependent on creating shareholder value.
Observing Share Price Movements Among SNAP and Its Peers
This chapter is not meant to provide any additional fundamental insights of SNAP, so rather see it as interesting observations. Besides the fundamental challenges of SNAP, we saw some interesting patterns in the share price movements of SNAP and its peers following earnings announcements in the last years. The table below shows the share price movements from 2019 till today, 1 day after the respective earnings announcements. What we tried to illustrate in the table below is the strong increase of SNAP’s share price when it reported its Q4 2021 earnings and the corresponding share price increase by 58.8% the day after. At the same time, META reported mediocre results for the same period and its share price declined by 26.4%. It’s also interesting, that in the last 7 quarters, SNAP seems to have continuously disappointed the market and hence the share price reaction was mostly negative. So, even looking at the market reactions it looks like META has won the battle in the last quarters, by continuously reporting good earnings. One factor for sure was also that META was a lot faster in right-sizing the company, as compared to SNAP.
Earnings Release for each Quarter & Share Price +1 Day (S&P Capital IQ)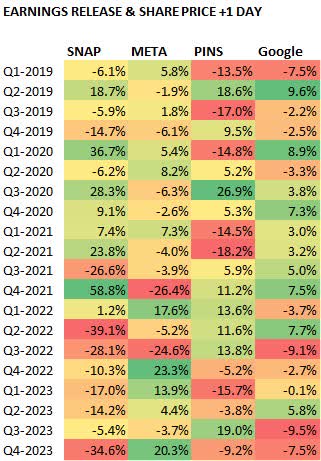
Cutting a short story even longer, we also looked at the +30, +60 and +90 Days share price changes after each earnings announcement date for SNAP for the same time period as above. It looks like that in particular in case of a severe increase or decrease of the share price we saw a counter-movement within 30, 60 and 90 days after the announcement. This didn’t happen in Q3 2023, but instead SNAP lost another 41.5% of its market value 90 days later. While this shouldn’t be considered a fundamental analysis, it supports our hypothesis that shareholders are in doubts that SNAP can navigate the challenges ahead and is raising questions about its long-term viability.
SNAP share price change after earnings +30, +60, +90 days (S&P Capital IQ)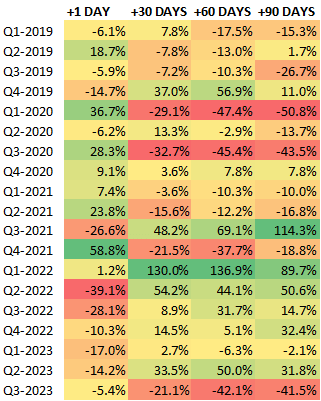
Valuation and Growth Prospects of SNAP
Despite a significant decrease in market value, SNAP’s valuation is still at 3.7x EV/Revenue based on FY2024 forecasts. While this is lower than its closest competitors such as META at 7.2x, Google (GOOGL) at 5.0x, and Pinterest (PINS) at 6.1x, it’s important to know that both META and GOOGL delivered EBITDA margins of 45% and 33% in the last fiscal year, a rather big difference to SNAP’s “adjusted EBITDA” margin estimated to reach only 11.8% by FY2025 (source: S&P Capital IQ consensus estimates). Additionally, META has delivered top-line growth of 16.2% over the past three years as compared to SNAP’s growth rate of 9.2%, despite META’s revenue base being 30 times larger.
To better understand SNAP’s implied growth expectations embedded in its current valuation, we ran a simplified 3-stage DCF model. The first stage incorporates 2-3 years of consensus broker estimates, assuming brokers have the most accurate short-term projections for the company. The next stage consists of a 10-year forecasting period, maintaining most major drivers such as margins and capital expenditures relative to revenues. They calculate the terminal value in year 2036 using the value driver formula (Enterprise Value = NOPAT x (1-G/ROIC)/(WACC-g). For SNAP this means: EBITDA margin is constant at 15.8% (we gave SNAP a 4pp margin boost above the broker estimates of FY2025 of 11.8% (source: S&P Capital IQ), WC and Capex fixed relative to sales (based on the average of the last 3 reported years). ROIC in our model is an outcome and grows from 8% in 2024 to 42% in 2035.
Our findings indicate that to justify its current market valuation, SNAP would need to sustain an annual revenue growth rate of 23.8% over the next decade (2024-2035), expected to reach revenues of EUR 50.6 billion by 2035. This seems like a rather ambitious growth rate, given that the consensus broker estimates are forecasting top-line growth rates of only 14% for the next 2 years.
It’s worth highlighting that our long-term capital expenditure assumptions for SNAP are 4.6% of revenue (in line with last 3 years average). Comparing this to META’s capex for FY2023 of 20% of revenue and amounting to $27 billion in FY2023, it even more highlights the challenges SNAP is up against.
For comparison, running the same model for META, the implied growth expectations suggest a forecasted annual top-line growth of 12.7% over the next decade, with ROIC expected to climb from the high 40s to 56% by 2035.
Potential upsides for SNAP
While we believe this scenario is highly unlikely in the short- and mid-term, there are a few potential upsides for SNAP, which we suggest investors to look out for:
- Strong increase in ARPU in particular coming from RoW countries.
- Change of the key leadership team (i.e. mainly on the product side) as well as changes to the share-based compensation vesting.
- Clear indication that SNAP is working on new ways/products to support advertisers and to differentiate themselves from META (IG/GB). The current product strategy is too similar to META, who does it much better and has a massively more resources.
Conclusion
SNAP’s performance in Q4 2023 and our forward looking implied expectations show a scenario of limited alpha and very high beta for the stock. From our perspective, the company is facing severe obstacles in the mid and long-term and we don’t believe the current management team is right to turn this around. SNAP is struggling to gear the ship towards profitable revenue growth, control costs and gain revenue market share in an extremely competitive and rapidly changing social media landscape. For us, a critical question is: Is it possible for SNAP to adapt and get back on its feet in a market that demands profitable growth, agility and financial strength? For us, we would need to see a massive shift in gear from the management to consider SNAP a good investment.
Having said this and dependent on the broader market context, given a potential slowing economy (suggesting we haven’t entirely cleared the danger zone), there might be a window for a short-term uplift in SNAP’s share price to $15 per share in the next three months. In case this happens, we advise investors to secure profits, given our skeptical view of SNAP’s long-term viability.
Analyst’s Disclosure: I/we have no stock, option or similar derivative position in any of the companies mentioned, and no plans to initiate any such positions within the next 72 hours. I wrote this article myself, and it expresses my own opinions. I am not receiving compensation for it (other than from Seeking Alpha). I have no business relationship with any company whose stock is mentioned in this article.
Seeking Alpha’s Disclosure: Past performance is no guarantee of future results. No recommendation or advice is being given as to whether any investment is suitable for a particular investor. Any views or opinions expressed above may not reflect those of Seeking Alpha as a whole. Seeking Alpha is not a licensed securities dealer, broker or US investment adviser or investment bank. Our analysts are third party authors that include both professional investors and individual investors who may not be licensed or certified by any institute or regulatory body.

