Summary:
- Snowflake faces significant near-term resistance and is in a declining channel, suggesting a continuation of the downtrend without a major catalyst.
- Moving averages and Bollinger Bands indicate technical pressure and the potential for a significant decline, reinforcing a weak near-term outlook.
- Despite negative chart and moving average analyses, key indicators show positive divergence, hinting the downtrend may be nearing its end.
- Fundamentals show that the plunge in valuation multiples has not made SNOW stock a bargain, as its growth rate has plunged by over 75% since its IPO.
- With a mixed technical outlook and a fair valuation, I initiate Snowflake at a Hold rating.
Sundry Photography
Thesis
Snowflake Inc. (NYSE:SNOW) is currently in both an intermediate and near-term downtrend. An analysis of its daily and weekly charts and moving averages shows that there continues to be a weakness for Snowflake as there is heavy overhead resistance weighing on its stock. However, a closer look at some key indicators shows that there seems to be strength building beneath the surface in the form of positive divergence, which may indicate that a bottom is not far off. Note that a longer-term monthly analysis has not been included in this article, as Snowflake has a relatively short history as a public company. As for the fundamentals, I believe Snowflake is currently fairly valued, as its plunge in valuation multiples reflects the much slower growth rates compared to when it went public. From the analysis of the technical and valuation factors, in my view, Snowflake is a hold.
Daily Analysis
Chart Analysis
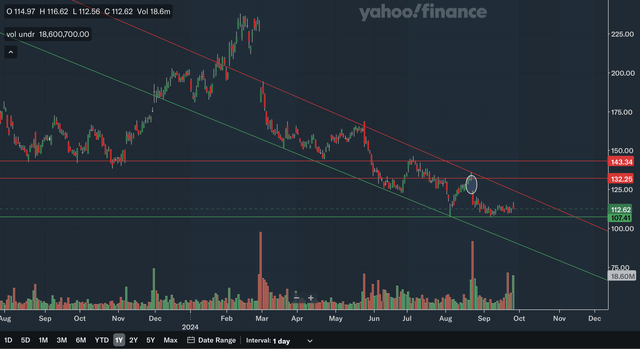
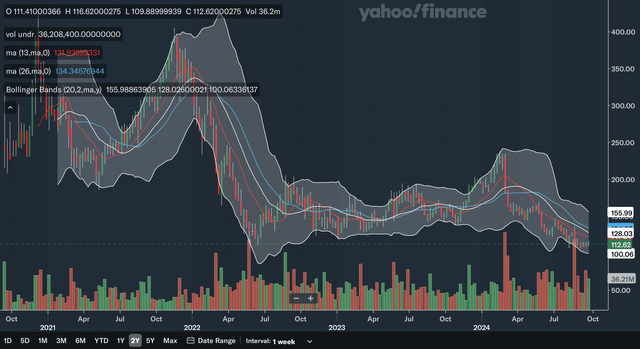
In the near term, Snowflake has more resistance overhead than support. It is currently in a declining channel and has been since early this year. Without a major catalyst, Snowflake could be channel bound and see this downtrend continue. I have circled a major gap, and it came with extraordinary bearish volume, showing that it has high significance. This could be resistance if Snowflake is able to break out from the top channel line. In addition, the next zone of resistance would be in the low 140s range as it has been a significant level with it being support all the way back in 2023 but has recently become resistant as demonstrated in July this year. The only level of support comes in the high 100s, as it has bounced from this level since August. As you can see above, even if Snowflake continues to drift sideways into November, Snowflake will see a make-or-break moment as the downward upper channel line will converge with the high 100s support line, forcing a breakout or breakdown. I believe a breakdown below support would be slightly more likely, since Snowflake is in a clear downtrend. In addition, most volume spikes this year have been on the bearish side, showing that bears are more in control. Overall, in my view, this daily chart analysis shows a net negative outlook for Snowflake.
Moving Average Analysis
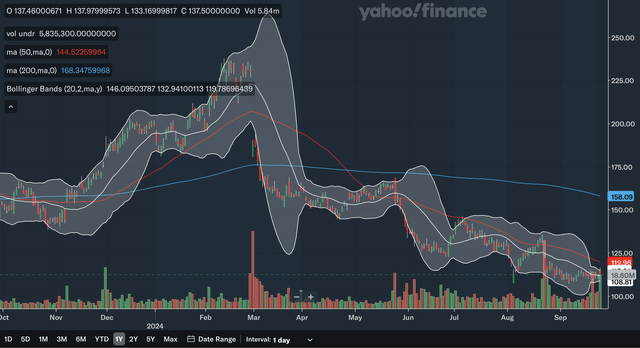
A look at the moving averages shows that Snowflake is under a lot of pressure technically. Earlier this year, in April, a death cross appeared as the 50-day SMA sharply broke the 200-day SMA. Since then, the 50-day SMA has continuously been heavy resistance, as Snowflake failed to truly break out on three occasions. Currently, Snowflake is trading under both the 50-day SMA and the 200-day SMA. The downward-sloping MAs will continue to bring resistance closer and closer to Snowflake’s current stock price, likely forcing the downtrend to continue. I have also included the Bollinger Bands indicator above, and it currently shows that Snowflake is in a period of volatility contraction as the bands narrow. That could signal a volatility surge ahead. With much downward pressure from the MAs weighing on the stock, and the Bollinger Bands indicating a potential volatility surge ahead, there is potential for a significant decline. Overall, I believe this moving average analysis shows that Snowflake has a weak near-term technical outlook.
Indicator Analysis
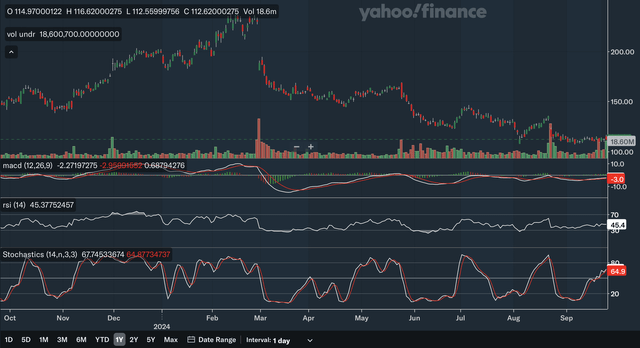
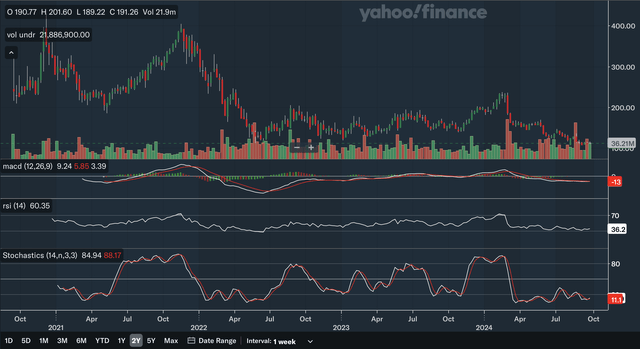
For the MACD, the line and the signal line have not had major separation since late August. That is also indicated by the relatively flat histogram, and it indicates that there has not been much of a trend lately. If you look closely, the MACD did break above the signal line earlier this month and that could indicate some slight positive momentum, but I would generally just treat that as a non-signal. For the MACD, the most important signal it provides here is the positive divergence. This year as Snowflake stock hit lower troughs in March, June, August, and September, the MACD showed higher troughs indicating that there is strength beneath the surface. For the RSI, it is currently neither oversold nor overbought. It also demonstrates positive divergence, as new lows in the stock were not confirmed by the RSI. In fact, there was a bottom failure swing since the RSI in the August trough held above the June trough while the stock was much lower in August. Lastly for the stochastics, currently the %K line is above the %D line showing there is some positive momentum, but the %K has recently shown some weakness as it nearly broke below the %D a number of times this month. Overall, in my view, this indicator analysis shows that there is strength beneath the surface for Snowflake as the MACD and RSI indicators showed a high level of positive divergence that could signal the downtrend is nearing its end.
Daily Analysis Takeaway
From the daily analysis of Snowflake stock, I believe the near-term negative outlook persists, but there is definitely noteworthy strength beneath the surface that could potentially end this downtrend in the not-too-distant future. The chart and moving average analysis painted a negative outlook showing that in the near term, Snowflake could continue to fall but since the important MACD and RSI indicators show positive divergence, this downtrend could be in its final stages.
Weekly Analysis
Chart Analysis
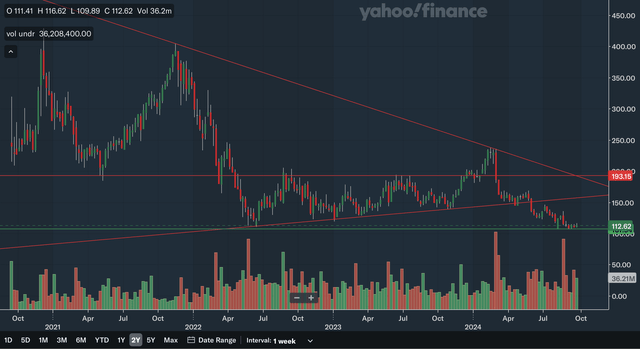
Snowflake has significant resistance overhead in the intermediate term. The nearest resistance would be the former upward sloping trend line. This former trend line was quite significant, as it provided support all the way back in 2022. Since Snowflake broke this trend line in May of this year, this could potentially mean it will be strong resistance in the future. The next level of resistance would be the longer-term downward sloping trend line. Since this trend line has been only touched 2 times, its significance may be lower. The last area of resistance identified above is the low 190s range, as this level has been both support and resistance throughout the last few years. The major area of support for Snowflake is very similar to the one identified in the daily analysis, but as you can see, this support zone has a history all the way back to 2022. If you take a look at the volume, you can see that the vast majority of the major volume spikes have been on the bearish side. This could potentially be worrying as it shows that bearish momentum has been stronger on average in the past. Overall, I believe this weekly chart analysis shows that Snowflake has a net negative outlook.
Moving Average Analysis
The 13-week and 26-week SMAs showed a bearish crossover earlier this year, indicating a downtrend in the intermediate term. Currently, Snowflake is trading below both of the SMAs with the 13-week SMA acting as resistance multiple times this year. The spread between the SMAs has narrowed somewhat, which is positive, as it indicates that the bearish momentum may be slightly receding in the near term. As for the Bollinger Bands, Snowflake stock hit the lower band earlier this year, indicating that it was oversold. However, it is currently trading between the 20-week average centre line and the lower band, showing the downtrend remains intact. The 20-week average centre line is likely to be resistant in downtrends, so the upside for Snowflake is likely limited to very modest levels. Overall, I believe this moving average analysis shows that Snowflake could continue its intermediate-term downtrend.
Indicator Analysis
The MACD line and the signal line have had basically no separation since July of this year, and therefore indicate no significant signal. Similar to the daily analysis, the MACD here also shows some positive divergence as well. In the mid-2022 troughs, the MACD hit an extremely low level. The stock is currently trading at similar levels as during that period, but the MACD has stayed well above the levels back then, indicating once again there is strength beneath the surface. As for the RSI, it is currently on the low side as it is near oversold levels and there is some very minor positive divergence in the same time periods discussed above, but no significant signal like a failure swing. Lastly, for the stochastics, the %K line just recently had a bullish crossover with the %D line within the oversold 20 levels, signalling that there is potential for an upside. However the previous two times this type of crossover occurred this year, the upward momentum was short-lived and so even though this latest crossover is bullish, you should take it with a grain of salt. Overall, in my opinion, an indicator analysis of the weekly charts shows a net positive outlook for Snowflake as there is an absence of any bearish indicator signals.
Weekly Analysis Takeaway
It is quite similar to the daily analysis in that the chart and moving average analyses seem to show a weak technical outlook for Snowflake, while the indicators show there is some strength building beneath the surface. Therefore, I believe in the intermediate term, Snowflake is still downward biased, but again the downtrend may be entering its final stages and Snowflake may be very close to bottom as strength builds.
Fundamentals & Valuation
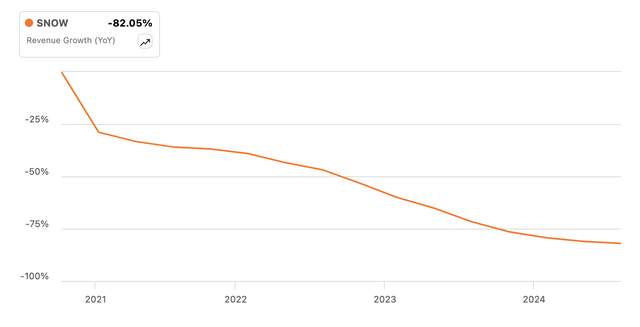
In August, Snowflake reported their fiscal year 2025 Q2 earnings results. They reported product revenues of $829.3 million, showing 30% YoY growth. However, as you can be seen in the chart above, this growth rate is down very significantly from levels at its IPO. This decelerating revenue growth is potentially concerning for investors. Snowflake’s adjusted EPS was actually positive as they reported $0.18, showing 28.9% growth. Other highlights in their earnings included a net revenue retention rate of 127% and the authorization of a continuation in their stock repurchase program.
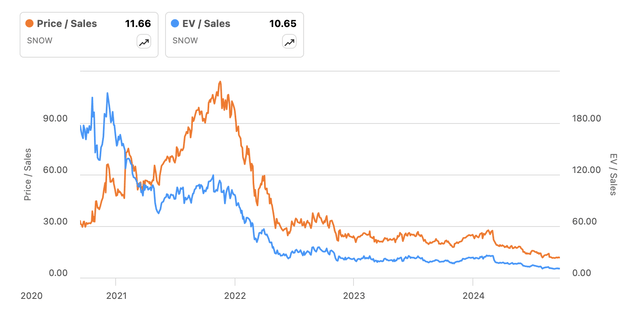
Snowflake’s valuation multiples have dropped considerably since its IPO, as its P/S and EV/S ratios continue to hit fresh lows. Its P/S has dropped from over 100 to only just above 10 currently, and its EV/S has dropped from over 200 to now at 10 as well. While this might indicate that Snowflake is now currently cheap, a look at the growth deceleration above says otherwise. Growth has contracted by over 75% since its IPO, and so it seems the plunge in valuation multiples is likely justified. Currently, Seeking Alpha has a C- valuation rating for Snowflake indicating that it is, at best, correctly valued. In my view, Snowflake is currently fairly valued as the plunge in its valuation multiples seems to mirror its heavy declines in growth, making it not the bargain that it may seem fundamental.
Conclusion
The chart and moving average analyses of both the daily and weekly charts of Snowflake clearly indicate a downtrend but, on the other hand, key indicators are showing that the bottom may be in and there is strength building. I believe that in the very near term, Snowflake may still be under pressure but in the longer run, we are much closer to a bottom than ever before. The occurrence of many positive divergence signals indicates the decline may soon be over. As for the fundamentals, as discussed above, Snowflake is likely fairly valued as its weighed down valuation is highly justified due to the major deceleration in growth. Therefore, with a mixed technical outlook and a fair fundamental valuation, I believe Snowflake is currently a hold.
Analyst’s Disclosure: I/we have no stock, option or similar derivative position in any of the companies mentioned, and no plans to initiate any such positions within the next 72 hours. I wrote this article myself, and it expresses my own opinions. I am not receiving compensation for it (other than from Seeking Alpha). I have no business relationship with any company whose stock is mentioned in this article.
Seeking Alpha’s Disclosure: Past performance is no guarantee of future results. No recommendation or advice is being given as to whether any investment is suitable for a particular investor. Any views or opinions expressed above may not reflect those of Seeking Alpha as a whole. Seeking Alpha is not a licensed securities dealer, broker or US investment adviser or investment bank. Our analysts are third party authors that include both professional investors and individual investors who may not be licensed or certified by any institute or regulatory body.

