Summary:
- I compare Starbucks’ dividend valuation today to 2014/5, soon after it initiated a dividend, and show how to estimate dividends with limited data.
- Compares Starbucks’ dividend returns to dividend aristocrat EFT NOBL since 2014/5.
- I make the case that relying on dividend streaks can limit investment opportunities and increase risk.
robtek
Introduction
In this article, I will compare Starbucks’ (NASDAQ:SBUX) dividend valuation from 2015 to its dividend valuation today. The technique I use for the comparison will show why using historical dividend streak records as a qualifier to screen for potential dividend investments is unnecessary and can sometimes produce counterproductive results because this type of dividend streak screen can significantly limit an already limited dividend investing universe. It can also tilt a portfolio into businesses that are in the later stages of maturity, rather than those with longer (and faster growing) dividend production.
I will show how I estimate future dividends of stocks with limited dividend histories by examining Starbucks’ earnings history from 2005-2014. Then I’ll show the predictive power of that technique in estimating Starbucks’ dividends from 2015 to 2024. I’ll use a similar process to calculate the current dividend valuation and compare the two periods (2004-2014 and 2015-2024). This should show readers a way to buy quality dividend-paying stocks much earlier in their life cycle and produce better long-term returns than relying on a dividend streak screen.
Categorizing Starbucks’ Business
Understanding a business’ earnings history is always important for any type of fundamental valuation process, but earnings history is even more important when there is limited dividend data. Starbucks didn’t start paying a dividend until about 2010, so there was a very short dividend history in 2014/5, and Starbucks would not have made any dividend streak lists at that time. Fortunately, earnings can be predictive of future dividends. This allows us to make dividend estimates based on the long-term earnings history. It also helps us categorize Starbucks’ business maturity.
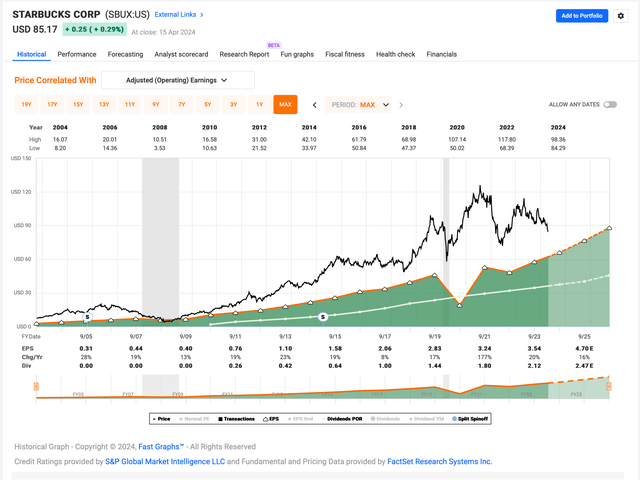
The first thing I examine with any business is what its historical earnings pattern looks like. In the FAST Graph above, Starbucks’ earnings per share are represented by the dark green shaded area. Starbucks experienced a moderately cyclical EPS decline in 2008 during the recession and also a larger (but understandable) EPS decline during the 2020 pandemic when everything was shut down, but in both cases, earnings quickly recovered. The overall earnings growth trend of the past 20 years has been very good.
Once we have determined earnings are growing relatively predictably and are not too cyclical, the next thing we want to know is how fast those earnings are growing. Since I will be comparing the 2005-2014 period to the 2015-2024 period, I will share earnings growth rate estimates for both periods. When I estimate future earnings growth, I base it on historical earnings during the previous economic cycle, but I control for years in which earnings growth declined (like 2008 and 2022) and for share buybacks (because those inflate the EPS growth numbers by reducing shares). Also, in this case, I excluded the 2020 pandemic year because those conditions are unlikely to repeat, but I did make adjustments for Starbucks’ significant stock buybacks from 2015-2024 (about 25% worth of shares outstanding).
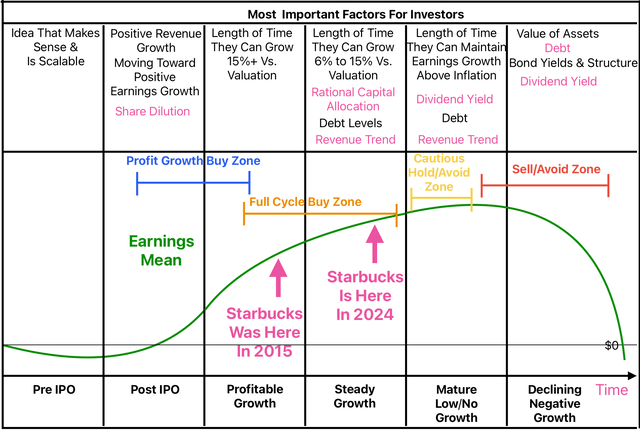
When I make these adjustments and measure the results, I get an +18.19% earnings growth rate for the 2005-2014 period and a +9.64% earnings growth rate for the 2015-2024 (ex-2020) period. These growth rates are important because they can help us categorize where Starbucks is (or was) in the overall public business lifecycle. Understanding where a business might be in the business lifecycle can help provide a broader context of the potential risks and rewards associated with owning the stock. I created the graphic below to help show where I think Starbucks was in 2015 and where it is today.
While the time each successful public business spends in each of these stages can vary a lot from business to business, it’s good to have a general idea of roughly where a business stands at any given point in time. And while sometimes businesses can successfully travel backward along this line to an earlier stage (as Apple (AAPL) did with the introduction of the iPhone), once a business gets fairly large, this becomes more difficult to do. A case in point with Starbucks is their attempt to grow Teavana in 2012 to spur growth via a new franchise. Teavana ultimately failed, and no longer exists anywhere as a franchise. The fact is, it’s quite hard for large businesses to find and develop new growth drivers that are big enough to move the earnings growth needle significantly.
Starbucks started paying a dividend in 2010, and they raised the dividend enough through 2012 so that the dividend payout ratio rose into the 30% range, which is where I consider the dividend of a still-growing business to be roughly fully funded. This was actually pretty early for a business growing as fast as Starbucks was (still solidly in the profitable growth stage), to initiate a substantial dividend. My observation has been most businesses don’t issue a substantial dividend until they reach the “steady growth” phase. The combination of solid earnings growth and payout ratio created a reasonably good opportunity for dividend investors at the time (assuming having a long dividend streak wasn’t one of their purchasing criteria).
What many income investors rarely understand is that the fact Starbucks was in the profitable growth stage in 2015 and did not have a long dividend track record actually provided a significant margin of safety compared to later “mature stage” businesses that might have had a longer dividend track record. Because, while we never know exactly when a business will move from one stage to another, all other things being equal, it is much more risky to own a business that is on the verge of tipping from slow growth or no growth to decline. The reason for this is that there is typically much less time to earn one’s initial investment back via the dividend in a “mature stage” business relative to a “profitable growth” (Starbucks in 2015) or even a “steady growth” stage business where Starbucks is right now.
Because time is such a critical factor for dividend investing, I have structured my dividend analysis to estimate how many years it will take an investor to earn an amount equal to their initial investment back via only the dividend and dividend growth. I call this the “Dividend Time Until Payback” analysis. It is important to place the dividend payback time in the context of what stage that business is in. An investor would want to have their dividends paid back faster in a mature stage business than in an earlier stage business, other things being mostly equal because the danger of decline is usually bigger for mature businesses.
Dividend Time Until Payback
In order to estimate the dividend time until payback, we only need two metrics: the dividend yield, and the future dividend growth rate. However, because dividends come out of earnings and are not in addition to earnings, estimating the earnings growth rate is necessary to estimate the long-term dividend growth rate. I have found that history is usually a very good predictor of the future for both earnings and dividends as long as we control for several additional factors like cyclicality, stage of life of the business, clear signs of disruption, increasing debt, or mismanagement. I’ve already reviewed earnings cyclicality and business stage in this article, and I don’t see any signs of real disruption for Starbucks. Since this article is about valuation, I’m going to set aside management for the time being and use the historical trends as a guide for the analyses.
Because dividend growth will be limited by earnings growth over the long term, I limit the dividend growth rate estimate to the expected earnings growth rate unless the payout ratio is less than 50%, in which case I average the historical dividend growth rates and earnings growth rates together to get the future dividend growth rate. For example, if a business has a 5% historical earnings growth rate, a 10% dividend growth rate, and a 40% payout ratio, then the future dividend growth rate expectation would be 7.5%. If the same business had a 60% payout ratio, then the future dividend growth rate would be limited to the historical earnings growth rate level of 5%. In Starbucks’ case in 2015, because we have a limited dividend history, and when dividends are initially instated, the growth rates can be unsustainably high due to the base effects caused by starting from zero, I simply limit the dividend growth expectation to the historical earnings growth rate at that time, which was +18.19%. By 2015, Starbucks’s payout ratio was over 30%, so it was fair to assume the dividend was fully implemented, even if we didn’t have good historical data on how much it would grow after being fully implemented.
Importantly, I assume these dividends will be collected by the owner of the business and held or spent. I do not assume they will be reinvested. If a retiree wishes to live off their dividends, they can’t both spend them and reinvest them.
As part of this process, I assume the investor starts with a $100 investment, and I test to see how long it would take them to accumulate an additional $100 only from the dividends using the process above. This metric can help investors compare a faster-growing business in the earlier stages of the business life cycle that might have a smaller initial starting dividend yield, to businesses that are in the later stages of the business life cycle that have slower growth, but higher starting dividend yields. But it can also be used to compare the valuations of a business today to what they were in the past for the same business, which is what I am going to do next for Starbucks.
Starbucks Stock 2005-2014
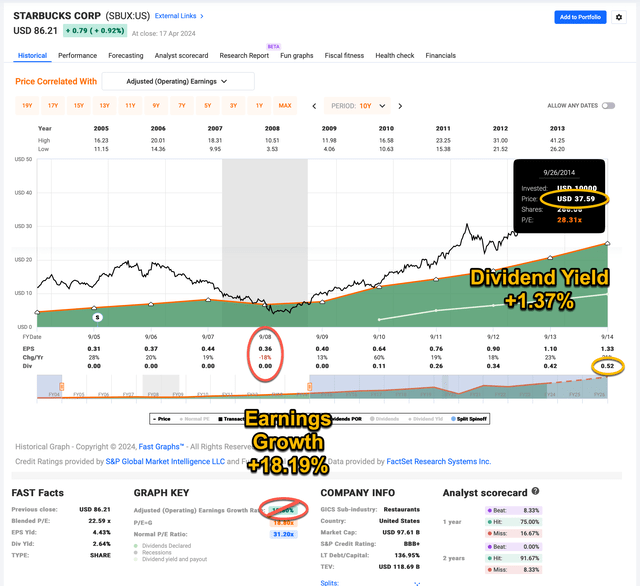
The time frame for the Fast Graph above is from 2005-2014. At the end of this period in September 2014 Starbucks dividend yield was +1.37%. Once I controlled for the -18% earnings growth decline in 2008 and a decrease in shares outstanding of about -5%, the earnings growth during this period was approximately +18.19%.
This means we have a +1.37% dividend yield, growing at +18.19%. What we want to know is how many years it will take to earn $100 in dividends on a $100 initial investment back in 2014/5.
| Year |
Dividend Projection On $100 |
Projected Cumulative Dividends |
Projected Year | Actual Dividends On $100 |
Actual Dividends Collected On $100 |
| 1 | $1.62 | $1.62 | 2015 | $1.70 | $1.70 |
| 2 | $1.91 | $3.53 | 2016 | $2.13 | $3.83 |
| 3 | $2.26 | $5.79 | 2017 | $2.66 | $6.49 |
| 4 | $2.67 | $8.46 | 2018 | $3.35 | $9.84 |
| 5 | $3.17 | $11.63 | 2019 | $3.83 | $13.67 |
| 6 | $3.73 | $15.36 | 2020 | $4.36 | $18.03 |
| 7 |
$4.41 |
$19.78 | 2021 | $4.79 | $22.82 |
| 8 | $5.22 | $25.00 | 2022 | $5.21 | $28.03 |
| 9 | $6.16 | $31.16 | 2023 | $5.64 | $33.67 |
| 10 | $7.29 | $38.45 | 2024 | $6.09 | $39.76 |
| 11 | $8.61 | $47.06 | 2025 | ||
| 12 | $10.18 | $57.24 | 2026 | ||
| 13 | $12.04 | $69.28 | 2027 | ||
| 14 |
$14.22 |
$83.50 | 2028 | ||
| 15 | $16.80 | $100.30 | 2029 | ||
|
15 Year Time Until Payback |
The table above shows how long my Dividend Time Until Payback valuation would have taken Starbucks stock to earn an amount equal to one’s initial investment back via only the dividends and dividend growth. The estimate was that it would have taken about 15 years. The column on the far-right shows the actual dividends that would have been collected on a $100 investment. Assuming Starbucks 2024 dividends come in as expected, the actual amount of one’s initial investment returned via dividends so far is about 39.76%, my estimate was about 38.45% through 2024. Given how close that 10-year projection was, I think it offers some evidence that it’s a pretty good dividend valuation method.
Now let’s apply the same method to today.
SBUX stock from 2015-2024
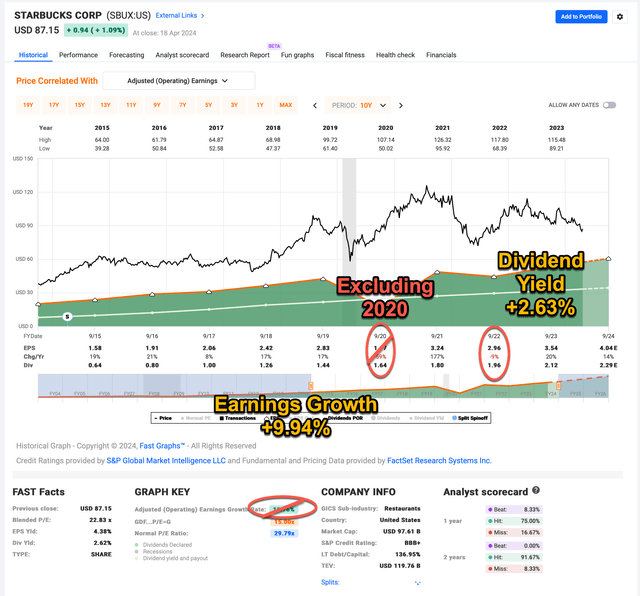
I have annotated the FAST Graph above with several adjustments. First, I excluded 2020 altogether due to its unusual nature and unlikelihood of repeating anytime soon. When calculating earnings growth, I also adjusted for buybacks and the 2022 earnings growth decline of -9%. After doing those things, I come up with a more conservative earnings growth rate of +9.94% from 2015-2024. For the dividend yield, I pulled forward 2024’s dividends, which produced a +2.63% dividend yield.
Next, let’s examine dividend growth.
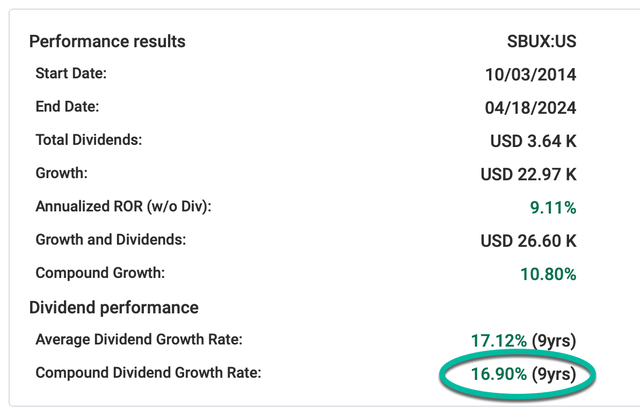
Starbucks compounded dividend growth rate was +16.90% during this period.
Using Starbucks forward earnings estimates, the dividend payout ratio is +56.68%, which is higher than 50%. This means I will use the lower of Starbucks’ +9.94% earnings growth and +16.60% dividend growth rate as my long-term expected dividend growth rate, so, +9.94% will be the projected dividend growth rate going forward.
Putting all this together, I will assume a +2.63% dividend yield, growing at +9.94%. What we want to know is how many years it will take to earn $100 in dividends on a $100 initial investment in 2024.
| Year | Projected Dividend on $100 | Projected Cumulative Dividends on $100 |
| 1 | $2.88 | $2.88 |
| 2 | $3.16 | $6.04 |
| 3 | $3.46 | $9.50 |
| 4 | $3.80 | $13.30 |
| 5 | $4.16 | $17.46 |
| 6 | $4.56 | $22.02 |
| 7 | $5.00 | $27.02 |
| 8 | $5.49 | $32.51 |
| 9 | $6.02 | $38.53 |
| 10 | $6.60 | $45.13 |
| 11 | $7.23 | $52.36 |
| 12 | $7.93 | $60.29 |
| 13 | $8.69 | $68.98 |
| 14 | $9.53 | $78.51 |
| 15 | $10.45 |
$88.96 |
| 16 | $11.46 | $100.42 |
|
16 Year Dividend Time Until Payback |
It would take about 16 years for an investor buying Starbucks stock today to earn their investment back via purely the dividend and dividend growth using these projections. This is remarkably close to the same amount of time an investor buying in 2015 could have expected. There is one note of caution I would make regarding that comparison, however. Because Starbucks is a more mature business than they were 10 years ago, there is probably more risk associated with today’s valuation than 2015’s valuation. Additionally, because of Starbucks’ global footprint, particularly in China, geopolitical risks and deglobalization are much higher for Starbucks now than in 2015 when US/China relations were better. This is a risk we often see with huge brands that have penetrated most of the global markets. We’ve already seen how McDonald’s divested its franchise in Russia after the Ukraine invasion.
For these reasons, it’s possible Starbucks could effectively move into the “mature/low-growth” business stage faster than it otherwise might have, or at least have reset the current growth trend. That said, given that the time until the payback estimate for a 60/40 portfolio right now is about 19 years, these risks might already be priced into Starbucks’ stock. I currently track about 72 dividend stocks with this valuation method and Starbucks’ valuation is currently in the 14th percentile (a lower number being better), so relative to other high-quality dividend stocks, it’s pretty attractive here.
Starbucks Vs NOBL In 2014/5
I stated in the introduction of this article that Starbucks could serve as an example of why requiring dividend streaks isn’t necessary for dividend investing, and why doing so could even be counter-productive. In this section, I will compare the dividend returns of Starbucks to ProShares S&P 500 Dividend Aristocrats (NOBL) from the decade of 9/26/2014-10/1/2023 to give an example of what I mean. I chose NOBL for this example because it requires a 25-year dividend streak for stocks to be included. I chose this time period because that’s when SBUX starts its fiscal year, and it gives us a full decade’s worth of returns to examine.
Let’s start by simply looking at the total returns during this period.
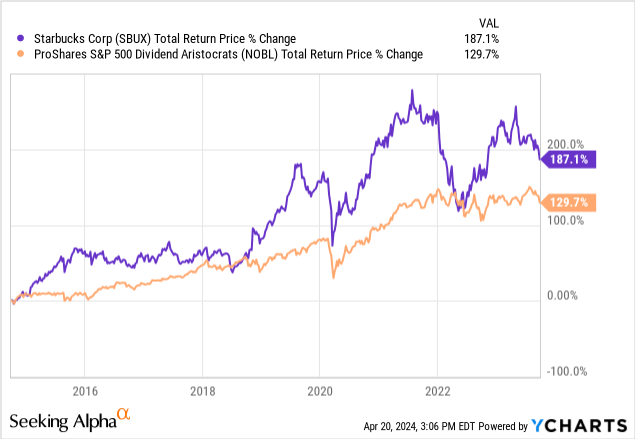
During this time frame, Starbucks’ total returns were better than NOBL’s about 99% of the time. (And they remain better today, with SBUX at about a 180% return vs NOBL’s 158% return.) I’m going to focus on the dividends for the remainder of this section, but I wanted to put to rest the idea that there was some other sacrifice an investor would have had to make to get better dividend returns.
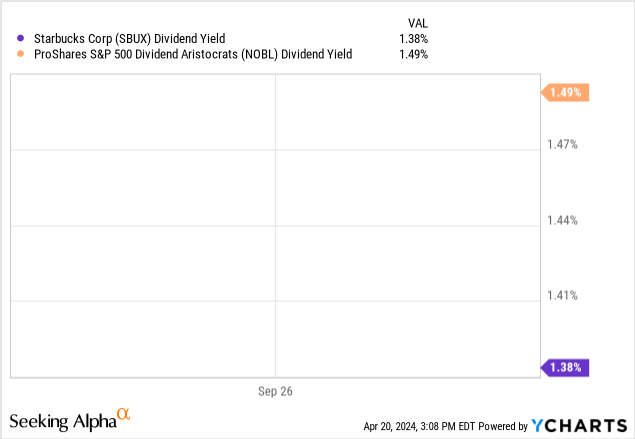
The starting dividend yields at the beginning of this time frame in late September 2014 were almost the same, with SBUX’s dividend yield at 1.38% (I used 1.37% in my previous calculations, which is just a rounding difference.) and 1.49% for NOBL. While the starting yields were similar, what really sets the dividend performance apart is the dividend growth rate during this decade.
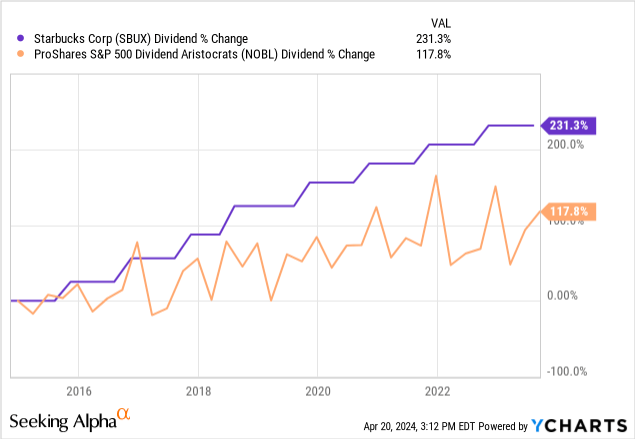
Even though NOBL’s quarterly payouts were more volatile, we can easily see that SBUX grew its dividends at about double the rate of the Dividend Aristocrats during this decade. It’s my view this is because the average business stage of Dividend Aristocrats is “Mature”, so they will rarely grow earnings (and therefore dividends) as fast as an earlier-stage business.
While Starbucks would have returned about +38.45% of one’s initial investment via dividends during this decade, NOBL would have only returned about +23.44%. This is significant underperformance, and it will likely ultimately take NOBL more than 50% longer to return an investor’s money via the dividend than Starbucks. That is a heavy price to pay for requiring a long dividend streak.
Conclusion
I aim for very high returns relative to most investors, so for a business to be attractive to me based solely on the dividends, I require a 10-year time until payback before I would buy. I might be willing to buy at the 12-year threshold if there is some other growth potential (as with my recent purchase of Pfizer (PFE)). So Starbucks’ current 16-year time until payback estimate isn’t short enough for me to buy it at today’s price based on dividends. However, it does still appear to be a good value relative to other dividend investments as long as they can keep growing earnings at a mid-to-high single-digit rate. Ultimately, each investor will have to decide the payback threshold with which they are comfortable.
While Starbucks is just one case study, it does serve as a good example of why dividend streaks are not very useful screens for dividend investors. First, these screens can exclude very good dividend investments like Starbucks in late 2014. And second, they can tilt a dividend portfolio toward more mature businesses in danger of decline, which is an underappreciated risk. My hope is this article was able to highlight these dynamics, so investors are more aware of them.
Analyst’s Disclosure: I/we have a beneficial long position in the shares of PFE either through stock ownership, options, or other derivatives. I wrote this article myself, and it expresses my own opinions. I am not receiving compensation for it (other than from Seeking Alpha). I have no business relationship with any company whose stock is mentioned in this article.
Seeking Alpha’s Disclosure: Past performance is no guarantee of future results. No recommendation or advice is being given as to whether any investment is suitable for a particular investor. Any views or opinions expressed above may not reflect those of Seeking Alpha as a whole. Seeking Alpha is not a licensed securities dealer, broker or US investment adviser or investment bank. Our analysts are third party authors that include both professional investors and individual investors who may not be licensed or certified by any institute or regulatory body.
If you have found my strategies interesting, useful, or profitable, consider supporting my continued research by joining the Cyclical Investor’s Club. It’s only $40/month, and it’s where I share my latest research and exclusive small-and-midcap ideas. Two-week trials are free.
