Summary:
- Starbucks has a high return on tangible capital that improved last fiscal year and is higher than the ratio for the two preceding years.
- Investors today are purchasing SBUX stock at about a 33% discount as measured by the forward EBIT/EV ratio.
- The return on tangible capital and the EBIT/EV ratio are two ratios that Joel Greenblatt points to in explaining his success as an investor.
JohnFScott
Introduction
In this article, we review Starbucks’ (NASDAQ:SBUX) recent financial record using the criteria offered by Mr. Joel Greenblatt in his bestselling book “The Little Book That Still Beats the Market”*. In particular, we review Starbucks’ return on tangible capital and earnings yield while making adjustments to reflect the methodology that Mr. Greenblatt employed. When applicable, we identify the rationale behind the adjustments to book values and connect it to the framework outlined in his work. After our study, we shall find that Starbucks’ return on tangible capital is higher than in previous years and that the earnings yield provides an attractive margin of safety. Investors with a holding period of at least a year should consider the stock a worthwhile addition to their portfolio.
*The Little Book That Still Beats the Market by Joel Greenblatt. Copyright 2010 and published by John Wiley & Sons, Inc.
Recent Quarter
By most accounts, Starbucks had a disappointing second quarter for fiscal year 2024. Total company revenue was down 1% year-over-year. Global comparable store sales declined 4%. Traffic was down in the North America segment and in China. In the Middle East, volatility adversely impacted results. Operating margins contracted by 1.4% and EPS declined by 7%.
Familiar themes emerge when we look for the underlying reasons for the disappointing quarterly performance. For the North American segment, Starbucks’ customers continue to feel the impact of the inflationary macroeconomic environment. Higher prices for essentials translate to lower budgets for discretionary items. This dynamic is not unique to Starbucks, many businesses in the consumer discretionary sector are feeling the impact as well. The slowdown was mostly seen in the afternoon daypart which corresponds to their occasional customer base rather than their regular, breakfast daypart customer. In China, which is part of the international segment, Starbucks is facing intense pricing competition from the mass segment. Similar to North America, the decline in China was most noticed in the afternoons and evenings. As a company, Starbucks is still highly dependent on North America. In fiscal year 2023, 74% of total net revenues were generated from this segment.
When Starbucks announced their disappointing Q2 results on April 30th, the stock dropped to a 52-week low and now sits below that price at $77.78 per share. Their 52-week high of $107.66 was recorded on November 16th 2023.
Source: Share price is intraday on May 21, 2024, and is from Seeking Alpha.
Methodology and the Magic Formula Investing
Magic Formula Investing is a strategy that Joel Greenblatt championed in his aforementioned bestselling book. Joel Greenblatt is the Managing Principal and Co-Chief Investment Officer of Gotham Asset Management and, for over two decades, a professor on the adjunct faculty of Columbia Business School. Many consider Mr. Greenblatt among the most successful investors of our time. Two concepts outlined in the book are to buy stocks of companies that have a high return on tangible capital and also a high earnings yield. While the concepts are clear enough, the interpretation and the application in practice is not as straightforward. For example, in terms of return on tangible capital, Mr. Greenblatt uses operating income in the numerator and only the assets that are necessary to running the business for the denominator. The denominator requires some subjective adjustments. In terms of earnings yield, Mr. Greenblatt uses the operating income in relation to enterprise value rather than the more commonly used reciprocal of the P/E ratio.
In terms of the application when it comes to stock selection, if a company can be shown to have high returns on tangible capital using recent year’s financial data and the high returns on tangible capital observed can be plausibly maintained, then the recent underperformance could be viewed as an opportunity to acquire stock in the company provided there is an adequate margin of safety. The margin of safety is measured by the relative earnings yield and has to be enough to compensate the investor for risks that may include, for example, the headwinds of the business, execution risk with respect to ongoing strategic initiatives and perhaps even the relatively limited time at the helm of their new CEO.
Return on Tangible Capital: Numerator
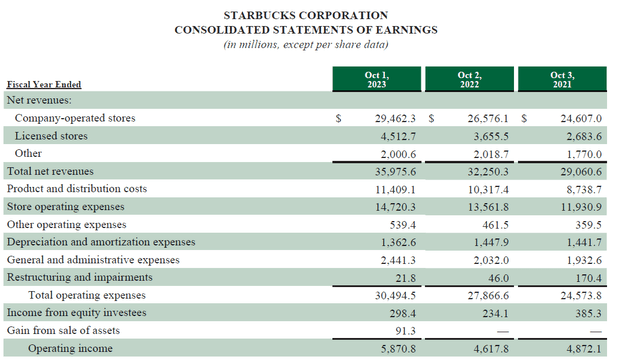
One of the first things that becomes clear while reading “The Little Book” is that Mr. Greenblatt doesn’t take a per share perspective with investment decisions. Instead, he looks at the entire business in terms of how efficiently it can earn a return on capital. For example, for the return on tangible capital ratio, the numerator considers operating income, which provides a measure of income without the effect of interest and tax expense. Companies are placed on equal footing and are not given credit for their use of debt nor their tax efficiency. Please see Exhibit 1 for a portion of the fiscal year 2021 to 2023 Statement of Earnings. The expense portion of the Statement is not germane to our analysis and is left out.
Focusing on the fiscal year that Ended on October 1, 2023, column, the line items appear straightforward for the most part. I would like to call out three items. Firstly, Greenblatt’s framework uses last year’s figure as a baseline without making adjustments. We therefore do not extrapolate from the recent quarter data, nor do we incorporate guidance. Secondly, “gain from sale of assets” isn’t really an operating performance. Starbucks isn’t in the business of selling assets, they are in the business of selling coffee. We shall remove the $91.3 million gain from our measure of operating income. “Income from equity investees” is income from entities that Starbucks can exert influence but does not control, such as the North American Coffee Partnership JV. We keep this item for our estimate.
Return on Tangible Capital: Denominator
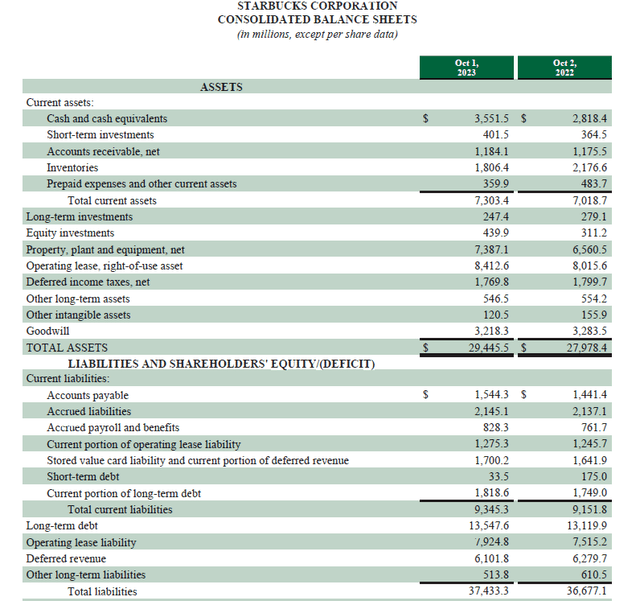
Please take a look at Exhibit 2. The equity account is not applicable and has been left out of the exhibit.
Greenblatt’s strategy is to consider only the tangible net capital employed in the business. In this case, the tangible net capital is equal to the net working capital plus net fixed assets. Focusing on the fiscal year ending October 1, 2023, net working capital is current assets minus current liabilities, which would be a negative figure. We shall ignore the negative net working capital and not use it as part of the denominator. Using the negative net working capital would reduce the denominator and overstate the ratio and result in a less conservative estimate. This is not in keeping with the general message of the framework. From the non-current assets bucket, we shall remove “operating leases, right-of-use asset” from consideration. This entry is a reflection of ASC 842 which is a recent accounting standard that requires balance sheet recognition of lease assets and liabilities. There is an offsetting account called “operating lease liability” for $7,942.8 million. For Starbucks, leases often include the option to extend or to terminate at their sole discretion. “Deferred income tax, net” is excluded from consideration because we do not consider the impact of leverage or taxes with this framework. We also remove intangible assets and goodwill as it is not directly tied to the operating performance of the business.
Please take a look at Table 1 where we look at our adjusted measure of return on capital.
| Table 1: Return on Tangible Capital ($ in millions) | |||
| 2023 | 2022 | 2021 | |
| Adjusted Operating Income | 5779.5 | 4617.8 | 4872.1 |
| Tangible Assets | 8162.95 | 8404.1 | 8299.00 |
| Adjusted Operating Income Return on Tangible Assets | 70.80% | 54.9% | 58.7% |
Source: Starbucks 10-K from 2020 to 2023
I have applied the same methodology to 2022 and 2021 and used the average of the beginning and ending values for the balance sheet items. The recent fiscal year’s return on tangible capital is actually higher than the two previous years. For every dollar invested in assets directly related to operating performance, Starbucks earns about 70 cents before taxes and interest.
Earnings Yield
Similar to the approach with the return on capital, Greenblatt looks at the entire business in deciding if the valuation is attractive. Often, investors consider the earnings yield as the reciprocal of the P/E ratio and, like the P/E ratio, the earnings yield is arrived at after consideration of the effects of leverage and tax expense. Using operating income to enterprise value shifts the investor’s perspective to consider the value placed on the operating assets of the business without consideration to interest and tax expense. Please take a look at Table 2.
| Table 2: Earnings Before Interest Expense (EBIT) and Taxes to Enterprise Value (EV) | |||
| SBUX | 5 Yr. Avg. | % Difference to 5Y Avg. | |
| EBIT/EV (TTM) | 5.07% | 2.50% | -50.65% |
| EBIT/EV (FWD) | 5.27% | 3.51% | -33.38% |
Source: Seeking Alpha. I used the reciprocal of the EV/EBIT as presented on the site.
EBIT is earnings before interest expense and taxes and is synonymous with operating income. EV means enterprise value and is the market value of equity plus the market debt less cash and cash equivalents.
Starbucks is trading at a meaningful discount to value as measured by this ratio. The ratio is below its five-year average on a trailing and forward basis.
Caveats and Fair Value
There are two caveats worth mentioning. The first is that it could take some time for stock prices to appreciate and is the reason that the methodology recommends a holding period of at least a year. We would suggest extending that to at least eighteen months. Secondly, the best application of this strategy is to find a group of 20-30 stocks that exhibit low correlation and share the same high return on capital and high earnings yield characteristics to maximize the potential benefit to an investor’s portfolio. While it is difficult to count on an individual stock to outperform, having a basket of stocks that have similar characteristics will enhance the chances of favorable results.
The framework doesn’t offer a view on the fair value of the stock. Instead, what is suggested in “The Little Book” is that once the earnings yield reaches a level that doesn’t anymore offer a sufficient margin of safety, then the capital should be redeployed into other businesses that have high returns on capital and a high earnings yield. The investor would book capital gains in the process.
Final Thoughts
Greenblatt pointed out that a high return on tangible capital business will probably be available at a discount only if the near-term prospects of the company are not very attractive. Otherwise, the stock will be priced at a premium to reflect the high returns relative to tangible capital. Greenblatt also explained the mechanism for which the stock price of such a company will eventually recover: If a company earns high returns on tangible capital, then it can reinvest retained earnings in other high return on tangible capital projects or locations. This will push earnings higher, and the market price assigned to the earnings will follow. If the shares stay subdued for longer, the company can use some of the retained earnings to buy back shares, which will increase the price of the stock because there are fewer outstanding shares per unit of earnings.
For investors that view the current travails of Starbucks as something that can be recovered from and have a holding period of at least one year, the recent underperformance of the stock may provide an attractive entry point. Investors should take advantage of the opportunity.
Analyst’s Disclosure: I/we have a beneficial long position in the shares of SBUX either through stock ownership, options, or other derivatives. I wrote this article myself, and it expresses my own opinions. I am not receiving compensation for it (other than from Seeking Alpha). I have no business relationship with any company whose stock is mentioned in this article.
Seeking Alpha’s Disclosure: Past performance is no guarantee of future results. No recommendation or advice is being given as to whether any investment is suitable for a particular investor. Any views or opinions expressed above may not reflect those of Seeking Alpha as a whole. Seeking Alpha is not a licensed securities dealer, broker or US investment adviser or investment bank. Our analysts are third party authors that include both professional investors and individual investors who may not be licensed or certified by any institute or regulatory body.


