Summary:
- Despite The Home Depot’s acquisition of SRS Distribution, mixed financial results and market weaknesses justify maintaining a “hold” rating.
- Recent data shows a 0.7% revenue decline, driven by lower comparable sales, transactions, and average ticket prices.
- Increased SG&A costs and declining profitability metrics, including net income and operating cash flow, further support a cautious stance.
- Economic conditions and housing market trends suggest additional weakening, making it prudent to remain neutral on Home Depot’s stock.
Sundry Photography
Back in late March of this year, one company that I had decided to downgrade was home improvement giant The Home Depot, Inc. (NYSE:HD). Since October 2022, I had been bullish on the firm. And the returns during that window of time had been positive. The stock was up 44.1% while the S&P 500 (SP500) was up 39.6%. But between how the stock had become priced, and because of the firm’s decision to acquire SRS Distribution in exchange for $18.25 billion, I felt as though a downgrade to a “hold” from a “buy.” Since then, the stock is actually down 0.7% while the S&P 500 is up 6.4%.
Since that time, data covering two additional quarters has come out. The firm has also completed its acquisition of SRS Distribution. This gives us additional clarity regarding the overall health and trajectory of the business. But between how shares are still priced and because of key market weaknesses, I think it would be a mistake to upgrade it at this time. As a result, I’ve decided to keep the firm rated a “hold” for now.
A look at recent results
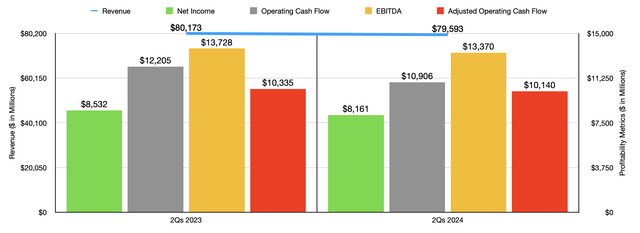
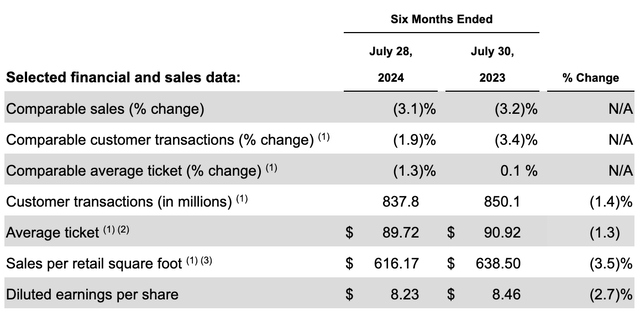
Fundamentally speaking, recent data provided by management has been mixed, but mostly negative. For the first half of 2024, revenue for the company came in at $79.59 billion. That represents a decrease of 0.7% compared to the $80.17 billion the company reported one year earlier. This decline was driven by weakness across the board. For starters, comparable sales declined by 3.1% during this period of time. This was because of a 1.9% drop in comparable transactions and a 1.3% drop in the comparable average ticket. The total number of transactions for the company fell from 850.1 million to 837.8 million, while the average ticket during this time dropped from $90.92 to $89.72.
The picture for the company would have been worse had it not been for its acquisition of SRS Distribution. That purchase closed in June of this year. And according to management, that new entity contributed $1.3 billion to the firm’s top line. Management attributed the comparable sales decline to macroeconomic conditions that resulted in fewer purchases at its stores. In addition, there was price stabilization that can only be interpreted as price cuts that were done following price increases the prior year that the company pushed through because of inflationary pressures.
With revenue dropping, profits for the company also took a hit. Net income fell from $8.53 billion to $8.16 billion. This was even though the firm’s gross profit margin expanded from 33.3% to 33.7% because of lower transportation expenses and lower shrinkage. Other costs, however, did increase year over year. In particular, selling, general, and administrative costs, grew from 16.6% of revenue to 17.4%. A reduction in legal-related benefits, an increase in payroll costs, and deleveraging associated with the decline in comparable store sales, were all responsible for this. Other profitability metrics for the company also took a dive. Operating cash flow fell from $12.21 billion to $10.91 billion.
If we adjust for changes in working capital, the decline was more modest, from $10.34 billion to $10.14 billion. Meanwhile, EBITDA for the company dropped from $13.73 billion to $13.37 billion.
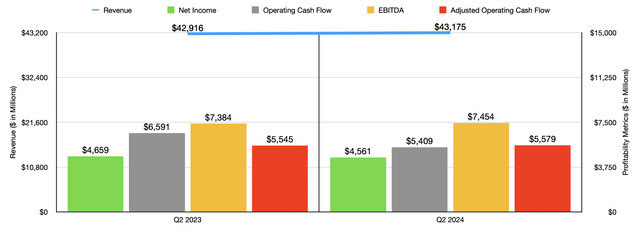
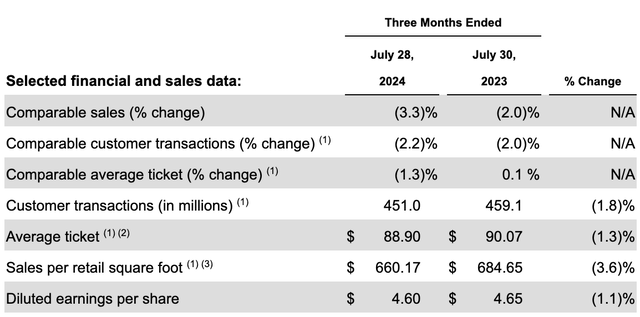
In the chart above, you can see results for just the most recent quarter on its own. As was the case for the first half of the year in its entirety, profits were down. However, revenue and some cash flow items came in stronger year over year. The rise in revenue for the company came from the $1.3 billion from the company’s acquisition of SRS Distribution. Comparable sales, however, dropped a rather painful 3.3% as customer transactions dropped 2.2% on a comparable basis and as the comparable average ticket of customers fell by 1.3%. The same pressures that impacted the company for the first half of the year as a whole impacted results for the second quarter.
When it comes to the 2024 fiscal year in its entirety, management expects total revenue to come in between 2.5% and 3.5% above what it was last year. However, comparable sales are expected to decline by between 3% and 4%. This disparity can be attributed to things. First, management expects that SRS Distribution will add $6.4 billion in revenue for the year. And second, an extra operating week will add about $2.3 billion to the company’s top line. Adjusted earnings per share should fall by between 1% and 3%. But this includes $0.30 per share associated with the extra operating week and some unknown amount associated with SRS Distribution.
When it comes to valuing the company, we are faced with certain challenges because of the aforementioned purchase of SRS Distribution. In my prior article on The Home Depot, we were given some estimates regarding that business on a standalone basis. And we also had trailing 12-month data for The Home Depot as well. I would argue that because of the small decline in comparable sales expected, the overall financial performance achieved by The Home Depot will not be radically different on a standalone basis than it was in 2023. If we make this assumption, and we use the data provided by management regarding SRS Distribution, we can get some insight into a pro forma picture for the combined enterprise.
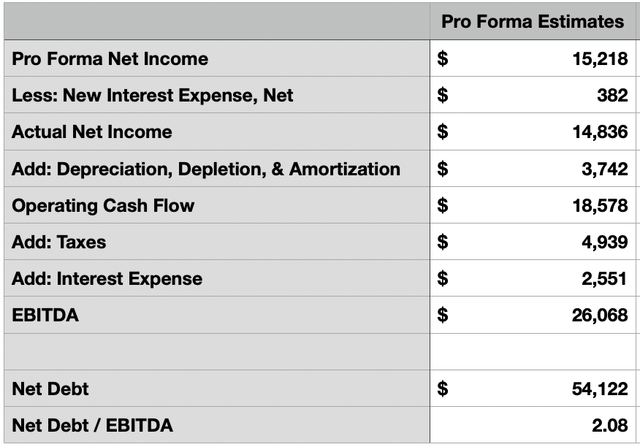
I actually did this kind of analysis in my prior article. But now, we have additional data. This includes interest rates incurred on the debt that The Home Depot issued to make the acquisition. It also factors in cash flows that The Home Depot has generated up to this point. In the table above, you can see what my calculations are for pro forma net income, operating cash flow, and EBITDA. You can also see the net leverage ratio of the company based on current net debt of $54.12 billion. Management used a different measure for leverage that included an add-back for operating leases and also added eight years’ worth of those rents to the firm’s debt. They also looked at gross debt rather than net debt.
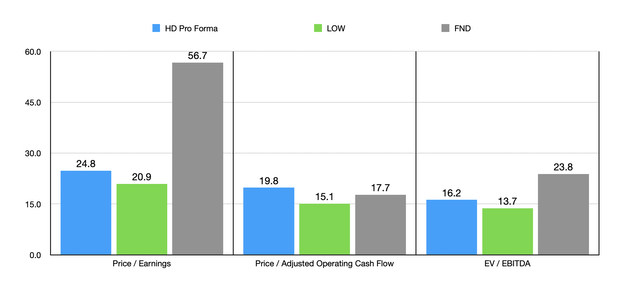
Using these calculations, we can see in the chart above how The Home Depot is valued on a pro forma basis. That chart also compares The Home Depot to two similar firms, Lowe’s Companies (LOW) and Floor & Décor Holdings (FND). In each case, The Home Depot is valued between the two companies. When you discuss the valuation on a standalone basis, I would argue that shares are a bit pricey. But again, we are dealing with an industry leader with a great track record. So I wouldn’t go so far as to say that the stock is overvalued. However, I would argue that we are getting pretty close to that.
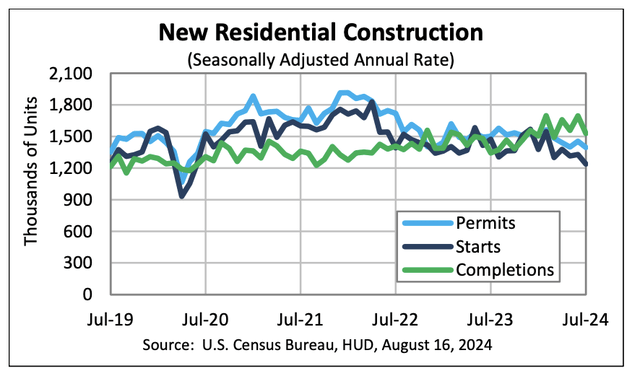
There are a couple of other factors that played a role in my decision to be neutral to slightly negative when it comes to The Home Depot. For starters, economic conditions are not exactly positive for the company. This year, according to one source, spending on improvements, repairs, and remodeling activities, should total about $450 billion in the US. That’s down from $481 billion spent in 2023. A different source estimated the decline from $489 billion to $452 billion. But that’s not all, the company does generate revenue from other activities as well. The residential housing space is one such example. Even though housing completions are up year over year, climbing 13.8% in July compared to the same time last year, housing starts and building permits are down. For the latest month available, which would be July, housing starts are down 16% compared to the same time last year. Building permits, meanwhile, are down 7%.
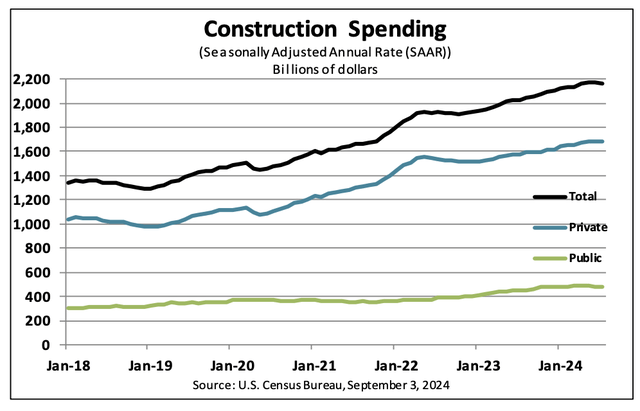
This is not to imply that everything is bad. When talking about the construction industry more broadly, there is some positive news to consider. In July, total construction spending in the US was up 6.7% year over year. And for the first seven months of 2024, it was up 8.8% compared to what it was at the same time in 2023. On the whole, this is a net positive. But with the other market data that I covered already, I would say that the picture for The Home Depot is slightly negative on the whole.
Takeaway
Based on the data provided, I still think that The Home Depot is a fine business. But I don’t think it’s a great opportunity to buy into at this time. The good news is that interest rate cuts should eventually result in an improvement in its markets. However, with uncertainty whether there will be a soft landing, and with market conditions pointing to additional weakening as the delayed effect associated with starts and permits eventually take a toll on completions in the housing market, I think the company merits a more cautious approach. This is especially true considering how shares are priced, particularly on an absolute basis. Because of this, I have decided to keep the firm rated a “hold” for now.
Analyst’s Disclosure: I/we have no stock, option or similar derivative position in any of the companies mentioned, and no plans to initiate any such positions within the next 72 hours. I wrote this article myself, and it expresses my own opinions. I am not receiving compensation for it (other than from Seeking Alpha). I have no business relationship with any company whose stock is mentioned in this article.
Seeking Alpha’s Disclosure: Past performance is no guarantee of future results. No recommendation or advice is being given as to whether any investment is suitable for a particular investor. Any views or opinions expressed above may not reflect those of Seeking Alpha as a whole. Seeking Alpha is not a licensed securities dealer, broker or US investment adviser or investment bank. Our analysts are third party authors that include both professional investors and individual investors who may not be licensed or certified by any institute or regulatory body.
Crude Value Insights offers you an investing service and community focused on oil and natural gas. We focus on cash flow and the companies that generate it, leading to value and growth prospects with real potential.
Subscribers get to use a 50+ stock model account, in-depth cash flow analyses of E&P firms, and live chat discussion of the sector.
Sign up today for your two-week free trial and get a new lease on oil & gas!

