Summary:
- Generally, I do not suggest overweighting the Tesla position in an investment portfolio. This is due to the company’s elevated Valuation and enhanced risk level.
- However, in this article, I’ll demonstrate how you can construct a $50,000 dividend portfolio that balances dividend income and dividend growth while mitigating risk, with Tesla as the predominant position.
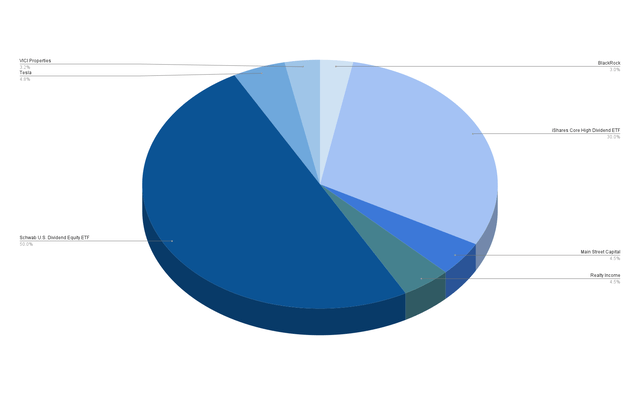
- This dividend portfolio, consisting of 2 ETFs and 5 individual companies, reaches a broad diversification over sectors, ensuring that no sector exceeds 20% of the overall portfolio.
- At the same time, the portfolio holds companies with a low 24M Beta Factor among the top holdings, serving as a counterbalance to the Tesla position, and reducing portfolio volatility.
Leonhard Simon
Investment Thesis
Numerous Tesla, Inc. (NASDAQ:TSLA) enthusiasts tend to overlook the level of investment risk associated with holding a large proportion of their overall investment portfolio in Tesla shares.
Today, Tesla has a P/E [FWD] Ratio of 69.25, which lies 310.82% above the Sector Median of 16.86. This Valuation indicates that Tesla’s stock price could drop significantly if the company is not able to meet its growth targets.
However, this does not mean that you should avoid investing in Tesla. I am convinced that Tesla has significant competitive advantages, a strong financial health (underlined by its Return on Equity of 27.95%), and shows excellent growth prospects. It is further worth mentioning that the company is also part of my personal investment portfolio, even though it represents a relatively small percentage.
The objective of today’s article is to show you how you could build a diversified dividend portfolio with only 2 ETFs and 5 individual companies, with Tesla being the largest proportion compared to the overall portfolio.
During this analysis, I will show you that through careful construction, the portfolio’s overall risk level will be relatively low despite only consisting of 2 ETFs and 5 individual picks. Even with Tesla, a relatively high-risk company, occupying the largest individual position, this dividend portfolio will maintain its relatively low-risk profile.
In addition to the above, this dividend portfolio achieves widespread diversification across sectors, in which no sector represents more than 20% of the overall portfolio even after distributing the investments from the two chosen ETFs, Schwab U.S. Dividend Equity ETF (SCHD) and iShares Core High Dividend ETF (HDV), across their respective sectors.
Due to the fact that three of the five individual companies exhibit 24M Beta Factors below 1, we are further reducing the portfolio’s risk level. These companies with a low 24M Beta Factor serve as a counterbalance to the Tesla position, helping us to reduce the elevated overall risk level which is a result of Tesla being the largest position of this dividend portfolio.
In addition to that, it can be stated that no single company accounts for more than 5% of the overall portfolio (Tesla represents 4.8%), even when allocating SCHD and HDV across their respective companies. This indicates a reduced company-specific concentration risk.
By meticulously selecting stocks for this dividend portfolio, I have further ensured that it reaches an attractive Weighted Average Dividend Yield [TTM] of 3.66%. In addition, it achieves a 5-year Weighted Average Dividend Growth Rate [CAGR] of 8.91%, even though it holds a non-dividend paying company such as Tesla as the largest position.
This portfolio construction supports my thesis that it is possible to successfully integrate a higher risk company that does not pay a dividend in a diversified dividend portfolio with a reduced risk level, blending dividend income and dividend growth with a pure growth company like Tesla.
The following two ETFs and five individual companies have been included in this dividend portfolio:
- iShares Core High Dividend ETF.
- Schwab U.S. Dividend Equity ETF.
- Tesla.
- BlackRock, Inc. (BLK).
- VICI Properties Inc. (VICI).
- Realty Income Corporation (O).
- Main Street Capital (MAIN).
Overview of the 2 Selected ETFs and 5 Individual Companies That Are Part of This Dividend Portfolio
|
Symbol |
Name |
Sector |
Industry |
Country |
Market Cap |
Dividend Yield [TTM] |
Payout Ratio |
Dividend Growth 5 Yr [CAGR] |
P/E [FWD] |
Allocation |
Amount |
|
SCHD |
Schwab U.S. Dividend Equity ETF |
ETF |
ETF |
United States |
3.48% |
13.05% |
50% |
25000 |
|||
|
HDV |
iShares Core High Dividend ETF |
ETF |
ETF |
United States |
3.77% |
4.70% |
30% |
15000 |
|||
|
TSLA |
Tesla, Inc. |
Consumer Discretionary |
Automobile Manufacturers |
United States |
617.09B |
– |
– |
0% |
69.25 |
4.80% |
2400 |
|
MAIN |
Main Street Capital |
Financials |
Asset Management and Custody Banks |
United States |
$3.76B |
6.18% |
66.67% |
3.78% |
9.28 |
4.50% |
2250 |
|
BLK |
BlackRock, Inc. |
Financials |
Asset Management and Custody Banks |
United States |
118.52B |
2.51% |
52.94% |
10.72% |
20.28 |
3.00% |
1500 |
|
VICI |
VICI Properties Inc. |
Real Estate |
Other Specialized REITs |
United States |
30.58B |
5.45% |
67.77% |
10.05% |
12.28 |
3.20% |
1600 |
|
O |
Realty Income Corporation |
Real Estate |
Retail REITs |
United States |
45.28B |
5.85% |
73.52% |
3.66% |
36.94 |
4.50% |
2250 |
Source: The Author, data from Seeking Alpha
Risk Analysis of The Current Composition of This Dividend Portfolio
Risk Analysis of the Portfolio Allocation per Company/ETF
While SCHD (with 50% of the overall portfolio) and HDV (30%) represent the largest positions of this dividend portfolio, Tesla represents the largest individual position, accounting for 4.8%.
The second and third-largest individual positions are Realty Income (4.5%) and Main Street Capital (4.5%), followed by VICI Properties (3.2%) and BlackRock (3%).
Risk Analysis of the Company-Specific Concentration Risk When Allocating HDV and SCHD Across the Companies They Are Invested in
The graphic below demonstrates the distribution of this dividend portfolio when allocating SCHD and HDV across the companies they are invested in.
The graphic demonstrates that Tesla is the largest individual position, representing 4.80% of the overall portfolio.
The second-largest position is BlackRock, accounting for 4.66%. This is followed by Realty Income (4.50%), Main Street Capital (4.50%), and AbbVie (4.29%).
Chevron (3.79%), Verizon (3.77%), Merck & Co. (3.71%), VICI Properties (3.20%), PepsiCo (3.06%) and Coca-Cola (3.06%) account for less than 4% of the overall portfolio.
The remaining companies represent less than 3% of the overall portfolio. Please note that the graphic below shows all companies that account for at least 1.50% of the overall portfolio (companies that represent less are not included in this graphic).
Source: The Author, data from Seeking Alpha and Morningstar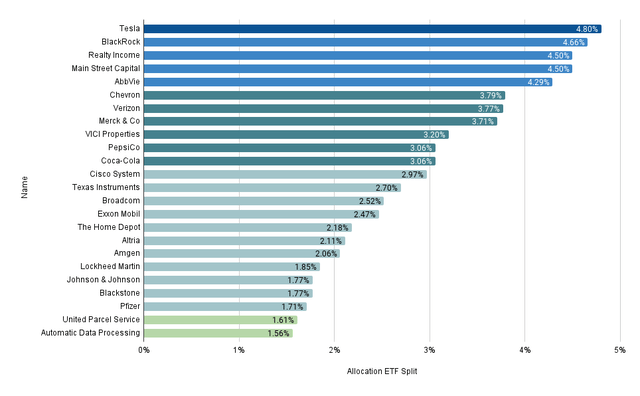
The portfolio allocation across companies and the fact that no single company represents more than 5% of the overall portfolio (even when allocating SCHD and HDV across their respective companies) indicate a reduced company-specific concentration risk. These characteristics underline the reduced overall risk level of this dividend portfolio, even when holding Tesla, a relatively high-risk company, as the largest position.
Risk Analysis: Analyzing the 5 Individual Companies That Are Part of This Dividend Portfolio
Analysis of The Profitability Metrics of the 5 Individual Companies That Are Part of This Dividend Portfolio
The graphic below demonstrates the high Profitability of the 5 selected individual companies that are part of this dividend portfolio.
With 27.35%, Tesla exhibits the highest Return on Equity, followed by Main Street Capital (18.19%), BlackRock (14.29%), VICI Properties (10.34%) and Realty Income (3.02%).
The relatively high Return on Equity of the five individual companies underlines my investment thesis that this portfolio comes attached to a relatively low risk level, even though it only consists of 2 ETFs and 5 individual companies (from which Tesla represents the largest individual position).
Source: The Author, data from Seeking Alpha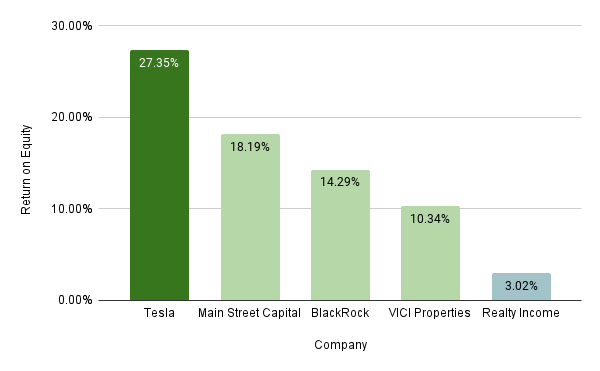
Analyses of The Growth Metrics of the 5 Individual Companies That Are Part of This Dividend Portfolio
The graphic below further indicates that the five carefully selected individual companies exhibit positive growth outlooks: each has shown a Revenue Growth Rate [FWD] of more than 5%.
Among the five selected companies, VICI Properties has the highest Revenue Growth Rate [FWD] (35.66%), followed by Main Street Capital (20.23%) and Tesla (18.25%).
BlackRock (7.45%) and Realty Income (6.47%) exhibit lower Revenue Growth Rates [FWD], still exceeding 5%.
The positive Revenue Growth Rate of each of the individual companies once again highlights the portfolio’s lowered risk level.
Source: The Author, data from Seeking Alpha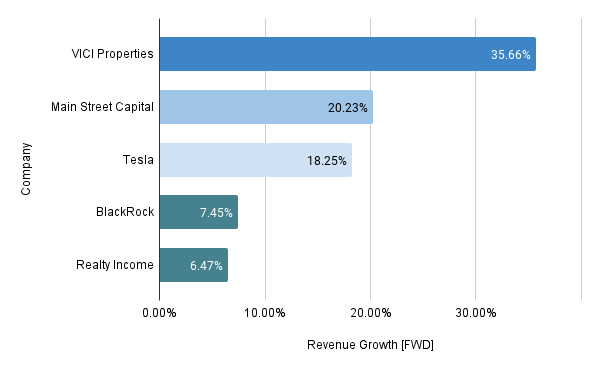
Analyses of The 24M Beta Factors of the 5 Individual Companies That Are Part of This Dividend Portfolio
The graphic below indicates that Tesla (with a 24M Beta Factor of 1.85) and BlackRock (24M Beta Factor of 1.59) have a significantly higher risk level when compared to the other individual companies.
In contrast to the previously mentioned companies, Realty Income (with a 24M Beta Factor of 0.62), VICI Properties (0.72) and Main Street Capital (0.76) can contribute significantly to reducing portfolio volatility. These companies help us to reduce the elevated risk level that comes from holding Tesla as the largest position.
Source: The Author, data from Seeking Alpha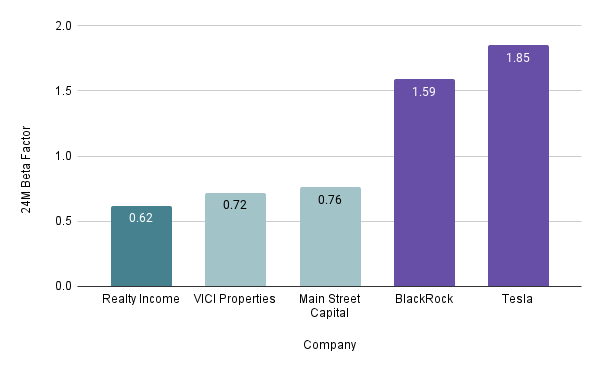
If you plan to hold Tesla as the largest position of your investment portfolio, I believe it is crucial to overweight companies that can contribute successfully to reducing portfolio volatility. Such companies should serve as a strategic counterbalance to the Tesla position, reducing portfolio volatility and lowering its overall risk level, providing us with elevated chances for positive investment outcomes.
Risk Analysis of the Portfolio’s Sector-Specific Concentration Risk When Allocating HDV and SCHD Across Their Respective Sectors
The graphic below illustrates that, when distributing investments in SCHD and HDV across their respective sectors, the Financials Sector emerges as the dominant component of this dividend portfolio (with 18.09% of the total allocation).
The second largest is the Health Care Sector with 15.42%, followed by the Consumer Staples Sector with 11.08% and the Energy Sector with 11.06%.
The following sectors account for less than 10% of the overall portfolio: the Consumer Discretionary Sector (9.88%), the Information Technology Sector (9.24%), the Industrials Sector (8.92%), and the Real Estate Sector (7.68%).
The Communication Services Sector (4.19%), the Utilities Sector (2.88%), and the Materials Sector (1.56%) account for less than 5% of the overall portfolio.
Source: The Author, data from Seeking Alpha and Morningstar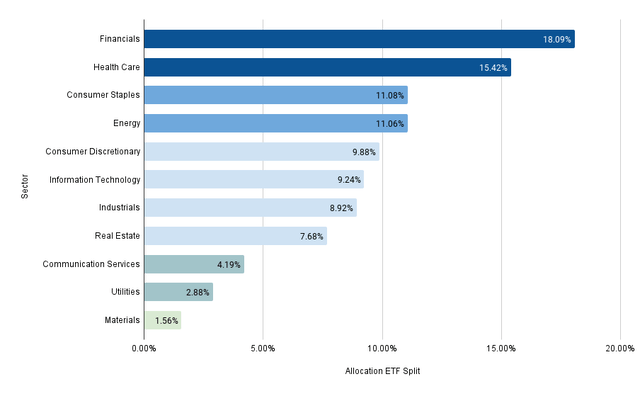
Since no single sector accounts for more than 20% of the overall portfolio and nine of the 11 sectors represent less than 12% of the overall portfolio, the reduced sector-specific concentration risk of this portfolio is evidenced, indicating a reduced overall risk level despite holding Tesla as the largest individual position.
The Elevated Risk When Holding Tesla as The Largest Position of Your Investment Portfolio
Holding the Tesla stock as the largest position of an investment portfolio implies an elevated risk level.
The main reason for this is Tesla’s elevated Valuation, which means that the company’s stock price could drop to a significant degree if its growth target is not met in the future. This means that should Tesla fail to achieve its growth objectives, it could markedly impact the portfolio’s Total Return negatively.
Through the careful selection process of this dividend portfolio and the inclusion of companies with a low 24M Beta Factor, I have ensured lower volatility even though Tesla represents the largest position.
However, the portfolio’s risk level could significantly rise if Tesla’s stock value increases substantially more than the other positions within the portfolio.
In such a case, I suggest periodically selling a portion of your Tesla shares to reduce the company’s proportion in relation to the overall portfolio. Or, to incorporate additional companies with a lower risk level. This approach allows you to maintain a reduced overall risk level.
The Additional Advantages of The Dividend Income Accelerator Portfolio in Comparison to This Dividend Portfolio
Through the careful selection process of this dividend portfolio, it blends dividend income with dividend growth and provides investors with a lowered risk level, even though Tesla represents the portfolio’s largest holding. While the Weighted Average Dividend Yield [TTM] of this portfolio stands at 3.66%, its 5-year Weighted Average Dividend Growth Rate [CAGR] lies at 8.91%.
These are attractive characteristics. However, it is worth noting that The Dividend Income Accelerator Portfolio reaches a superior mix of dividend income with dividend growth, given the portfolio’s current Weighted Average Dividend Yield [TTM] of 4.30% and Weighted Average Dividend Growth Rate [CAGR] of 9.01%. I further believe that The Dividend Income Accelerator Portfolio provides investors with a superior risk-reward profile.
In case you are still not familiar with the investment approach of The Dividend Income Accelerator Portfolio, you can find a detailed description of its concept in the article below:
The Construction Of The Dividend Income Accelerator Portfolio
If you are interested in the current composition of the Portfolio, you can have a look at the article below:
Why To Add SCHO To Your Dividend Portfolio
Conclusion
This article is specifically tailored for investors looking to construct a dividend portfolio with a lower risk profile, while simultaneously holding Tesla as its largest position.
I believe that many Tesla enthusiasts underestimate the high risk level that comes attached to providing the company with a disproportionally high share of their overall portfolio. This article should help them see that by including Tesla in a diversified dividend portfolio, ensuring a lowered risk level for their overall portfolio, can provide them with elevated chances for successful investment outcomes.
When building such a portfolio, it is crucial to prevent the Tesla stock from becoming disproportionately large in relation to the entire portfolio. Should this occur, my general suggestion is to periodically sell a portion of your Tesla shares to reduce the company’s proportion compared to the overall portfolio. Alternatively, you could incorporate additional companies with a low Beta Factor, serving as a counterbalance to the Tesla position, ensuring that its position decreases in relation to the overall portfolio.
To further diminish the risk level of this dividend portfolio, incorporating U.S. Treasury Bonds represents a prudent strategy. I have implemented the same strategy with The Dividend Income Accelerator Portfolio, to which I have recently added the Schwab Short-Term U.S. Treasury ETF (SCHO).
Compared to the dividend portfolio I have presented today, The Dividend Income Accelerator Portfolio offers investors an even more attractive mix of dividend income and dividend growth. It currently offers a Weighted Average Dividend Yield [TTM] of 4.30% and a 5-year Weighted Average Dividend Growth Rate [CAGR] of 9.01%. Moreover, I believe it provides investors with a superior risk-reward profile due to its even lower risk level.
Author’s Note: Thank you for reading! I would appreciate any feedback on this dividend portfolio allocation article, as well as any thoughts on the two selected ETFs and five individual companies!
Analyst’s Disclosure: I/we have a beneficial long position in the shares of SCHD, TSLA, VICI, BLK, O, HDV, MAIN either through stock ownership, options, or other derivatives. I wrote this article myself, and it expresses my own opinions. I am not receiving compensation for it (other than from Seeking Alpha). I have no business relationship with any company whose stock is mentioned in this article.
Seeking Alpha’s Disclosure: Past performance is no guarantee of future results. No recommendation or advice is being given as to whether any investment is suitable for a particular investor. Any views or opinions expressed above may not reflect those of Seeking Alpha as a whole. Seeking Alpha is not a licensed securities dealer, broker or US investment adviser or investment bank. Our analysts are third party authors that include both professional investors and individual investors who may not be licensed or certified by any institute or regulatory body.
