Summary:
- Suncor Energy’s 2024 stock rise reflects strong operational performance, cost efficiency, and a strategic shift towards renewable energy and carbon reduction.
- Despite market volatility, Suncor posted robust financials in Q2 2024, with significant cash flow and a steady dividend payout, showcasing strong financial governance.
- Suncor’s integrated vertical model and high refinery utilization provide a competitive edge, ensuring stable margins and effective capital allocation.
- Valued below peers, Suncor offers an attractive investment with a high dividend yield and potential for growth, despite inherent risks in the oil sector.
jewhyte
Investment Thesis
Suncor Energy Inc (NYSE:SU) has steadily risen throughout 2024, reflecting its exceptional operational performance and strategic focus on cost efficiency and sustainability. In 2023, Suncor was able to bounce back from the volatility of the market due to increased production capacity, stable oil prices, and strong refinement profitability. In the first half of 2024, Suncor Energy has outperformed forecasts, resulting in a 13.8% increase in the stock while it outperforms the energy sector index and key competitors. Suncor is now a major competitor for future expansion within the worldwide energy transition thanks to the company’s strategic turn towards renewable energy projects and dedication to reducing carbon emissions.
Q2 Highlights
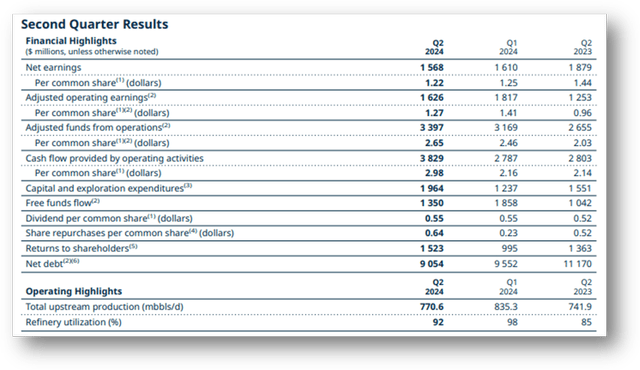
Even though the Q2 saw a drop in net earnings compared to the previous year, it has a remarkable financial picture. Reflecting some market volatility but constant operational efficiency, the company posted net earnings of $1.57 billion, down from $1.88 billion in the same quarter last year. Suncor’s capacity to create strong liquidity even in changing market conditions is shown by this increase in cash flow combined with a free funds flow of $1.35 billion, preparing it well for additional capital investments and returns to shareholders. With 92% of the refinery used, the business shows effective capacity use, optimizing output and guaranteeing consistent downstream operations.
The continuous enhancement of cash yield, which has more frequently surpassed the peer average in the last ten years, reflects Suncor’s focused effort on cash returns. This indicates that the company is keen on its capital return plan; in the previous ten years, it has paid out more than 65% of its market capitalization in dividends to shareholders. The company’s strong trustworthiness with investors is undoubtedly its steady dividend payout (CAD 0.55/share), along with its judgment to permit more substantial buybacks, which demonstrates excellent financial governance. The responsible management of capital by Suncor is shown through its sensible debt maturity.
Suncor Energy Investor Presentation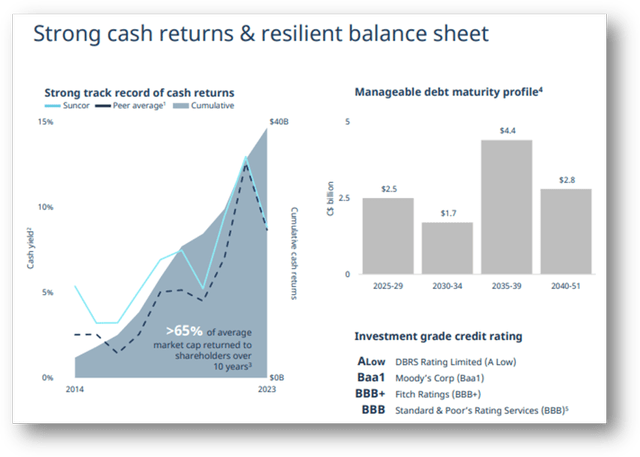
Achieving a critical strategic edge in a market that sees considerable energy price fluctuations is made possible by Suncor’s integrated vertical model. This integration also helps Suncor have a stable margin since it can profit from differences in crude oil prices and refined products. A varied series of assets reflects the successful transportation and marketing system of the company, pointing out the efficient delivery and marketing of the products while lessening risks in certain sectors or businesses.
Suncor Energy Investor Presentation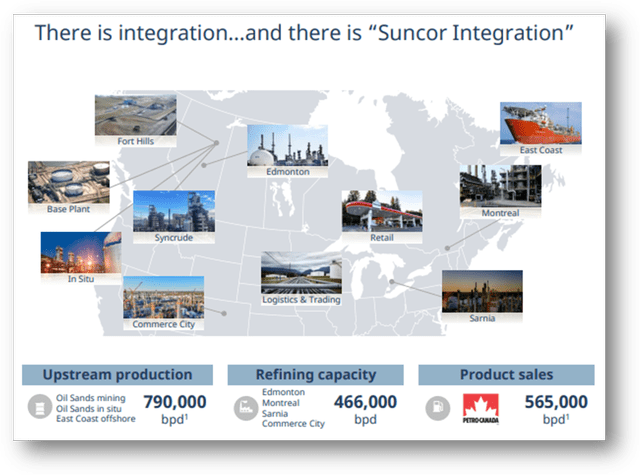
For upgrading and mining, Suncor demonstrates robust performance, with its base plant showing a steady 90% utilization and Syncrude achieving record production in 2023, which has improved from past years. After achieving >90% usage throughout the previous decade, Suncor plans to accomplish a 95% objective throughout Situ Assets. The improved production capabilities of the enterprise show how well it supervises its operations. The improved production capabilities of the enterprise show how well it supervises its operations.
Suncor Energy Investor Presentation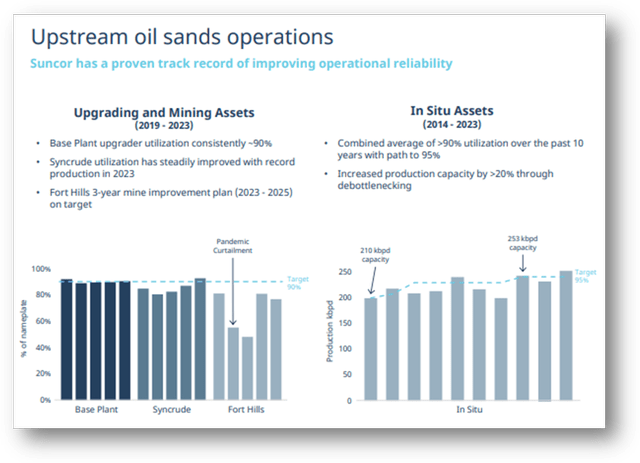
Suncor has retained an operational edge, typically exceeding the averages for the US and Canada in refinery utilization, particularly during periods of volatility (such as the pandemic). The profit chart unambiguously shows that Suncor’s power lies in its accrual of EBITDA, consolidating its position as a leader in the market. A strong profitability relative to other businesses introduces a durable competitive advantage, resulting in significant shareholder profits and safeguarding of stock value.
Suncor Energy Investor Presentation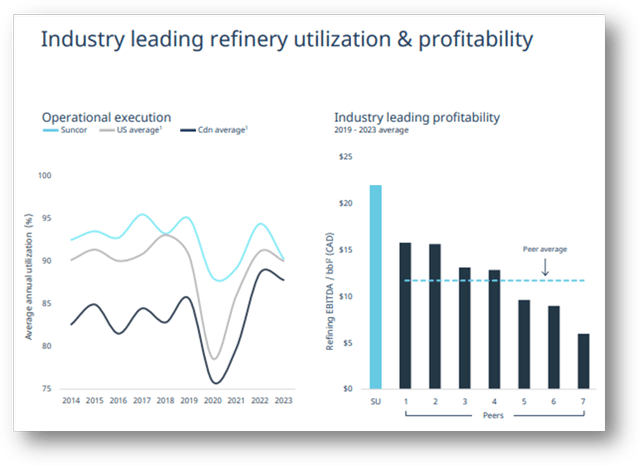
Robust Operations
Statista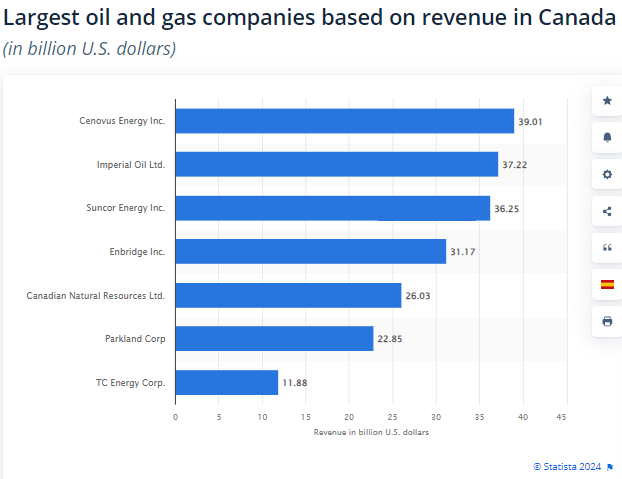
Suncor’s high revenue performance indicates its capacity to capitalize on market demand and properly manage its large energy assets, ranking closely with colleagues such as Cenovus Energy ($39.02 billion) and Imperial Oil ($37.22 billion). This variety distinguishes Suncor in its control of three major refineries—Edmonton, Montreal, and Sarnia—which harmonize to produce up to 300,000 oil barrels each day. Suncor is a consistent and diverse participant in the oil and gas sector thanks to its strong income-generating capacity and integrated business model, including exploration, manufacturing, and refining.
Statista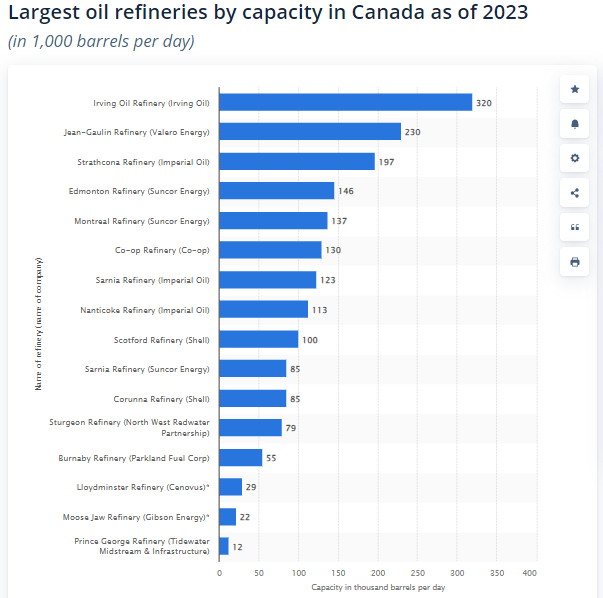
Peer Comparison
In the integrated oil and gas industry, Suncor Energy peer comparison shows that it distinguishes itself by showing a mix of appealing value, operational effectiveness, and future expansion possibilities. Suncor’s lower forward P/E ratio than Occidental Petroleum (OXY) and Eni (E) suggests that the market might be undervaluing the company about its earnings projection, notwithstanding industry volatility. For those who share the company’s long-term vision, this offers a chance, especially considering its solid cash flow-generating and capital management.
Though it lags behind certain peers like Cenovus Energy (CVE), which is pursuing expansion more aggressively, the revenue growth—especially a three-year compound annual growth rate (CAGR) of 17.99%—is impressive. This implies that Suncor might be scaling with a more conservative or disciplined strategy, giving profitability top priority above explosive growth even as it grows. Given a levered free cash flow margin of 15.04%, the company’s capacity to create cash is a major asset. This strong cash creation gives Sunbuybackse for shareholder distributions—such as dividends or share buybacks in addition to helping to fund capital projects and lower debt.
|
SU |
OXY |
E |
IMO |
CVE |
EQNR |
|
|
P/E GAAP (FWD) |
9.96 |
14.03 |
15.38 |
10.53 |
9.19 |
8.78 |
|
P/E GAAP (TTM) |
8.74 |
13.35 |
12.62 |
9.79 |
9.29 |
7.58 |
|
PEG Non-GAAP (FWD) |
0.61 |
0.81 |
– |
1.06 |
– |
3.62 |
|
PEG GAAP (TTM) |
0.31 |
NM |
NM |
7.43 |
0.33 |
NM |
|
Price/Sales (TTM) |
1.3 |
1.69 |
0.51 |
0.99 |
0.78 |
0.69 |
|
Revenue 3 Year ((CAGR) |
17.99% |
11.59% |
20.30% |
24.87% |
27.00% |
22.97% |
|
Revenue 5 Year (CAGR) |
5.69% |
8.07% |
3.98% |
8.60% |
21.66% |
7.31% |
|
Levered FCF Margin |
15.04% |
11.05% |
4.64% |
7.46% |
7.31% |
12.32% |
|
Return on Equity |
17.68% |
14.43% |
7.35% |
22.17% |
16.69% |
20.66% |
Looking at return on equity (ROE), Suncor’s 17.68% shows effective capital allocation for shareholders. Imperial Oil (IMO), on the other hand, beats Suncor here, suggesting that operational levers like asset use or cost control could be further improved. Both ahead and trailing Suncor’s PEG ratio show a robust growth trend at a somewhat reasonable value. Value-oriented investors who give growth potential top priority and minimize downside risk are the top attractions here.
Suncor could have to carefully monitor one area: its long-term revenue growth among peers. The energy transition is causing major changes in the oil and gas sector while the company expands gradually. More aggressively in some areas, peers such as CVE and IMO could be able to seize market share or profit on upcoming energy trends. Suncor offers a generally balanced investing case. It prioritizes shareholder value while maintaining the cash flow and financial discipline to handle brief volatility.
Valuation
SU is presenting a strong case for its value in the oil and gas sector. The P/E ratios of the company reflect a sizeable sector discount. Value investors find an opportunity in this undervaluation, especially considering Suncor’s constant operations in the energy sector and capacity to create regular cash flow. Both prospective (4.71) and trailing (4.82), the company’s Enterprise Value (EV) to EBITDA ratio is far lower than the sector median, which is 5.93 and 6.26, respectively. Suncor most certainly is selling at a lower multiple of its cash earnings, given the large discount (more than 20%). Particularly for those seeking exposure to a consistent oil producer with room for expansion as long as commodity prices remain high, investors would find it enticing.
Seeking Alpha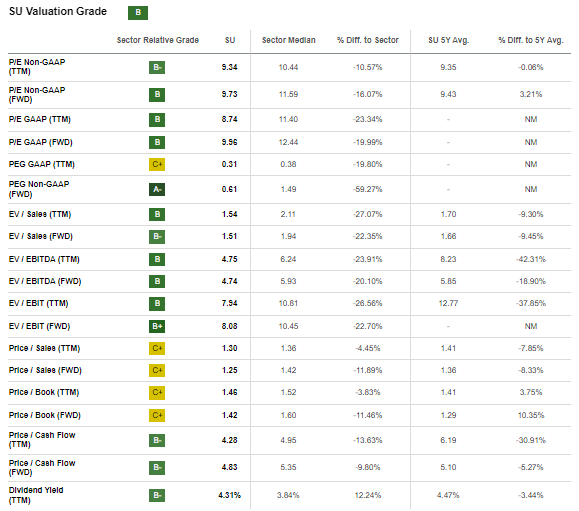
A major competitive advantage of Suncor is its capacity to turn profits into cash, particularly in a capital-intensive industry where liquidity will decide a company’s capacity to maintain operations and keep reinvesting in expansion projects. Additionally, with a significant dividend yield (TTM) of 4.24%, Suncor surpasses the sector median of 3.80%. Safeguarding finances during inflation requires a stable income coming from dependable sources of energy.
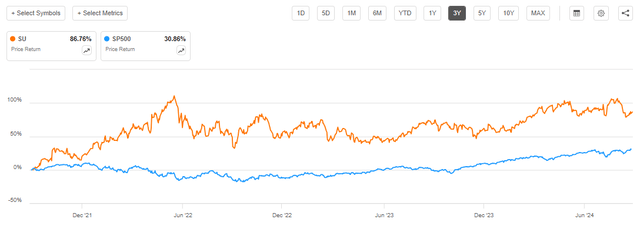
Suncor’s latest performance demonstrates a capacity to beat the S&P 500, particularly as a result of steady commodity prices and operational cost savings. Thanks to good cash flow, sharp capital allocation methods, and sensible cost management, Suncor is doing better than the market. As the energy sector follows cycles, the present success of Suncor in today’s high-oil-price setting may be minimized if oBuybackss go down in the future.
Delivering Value Through Buybacks
Sbuybacks reduced its overall outstanding shares by 8% through the buy-back of its shares, over $4 billion in the last year. From several perspectives, this immediately creates value for owners. First, lowering the number of outstanding shares raises earnings per share (EPS), appbuybackto investors and driving stock price rise. Second, Suncor’s buyback program tells the market management thinks the stock is cheap, which would increase investor confidence and, hence, raise the stock price. Especially at times of great oil prices, this approach appeals to a wide spectrum of investors by complementing Suncor’s already high dividend yield and offering consistent income and capital appreciation, thus improving general shareholder returns.
Risks
Suncor Energy (SU) experiences several kinds of company risk relative to its oil sands activities that are inherent to its operations. One significant risk is the upfront and ongoing reliance on the potentially less efficient production method of mining for bitumen from the oil sands, as well as increased environmental costs. Higher costs associated with strict environmental laws and costs of carbon policies are other threats facing Suncor, especially since the Canadian government is keen on strong climate policies.
Last but not least, it can be considered that Suncor still depends heavily on the transportation infrastructure, such as the Keystone XL pipeline or others; this is geopolitically sensitive and might indicate possible restrictions on the transport capacity, therefore affecting the producer’s efficiency in terms of reaching the market.
Conclusion
I’d say Suncor Energy is now undervalued in the oil and gas industry, with great upside potential, especially for investors looking to access the energy market at reasonable pricing. In an erratic market, it has robust cash flow generation, careful capital management, and competitive dividend yield appeal. Though its strong fundamentals should give it some durability, the cyclical character of oil prices still poses a risk. Any significant drop in commodity prices or more general market volatility could cause a review of its stock price.
Analyst’s Disclosure: I/we have no stock, option or similar derivative position in any of the companies mentioned, and no plans to initiate any such positions within the next 72 hours. I wrote this article myself, and it expresses my own opinions. I am not receiving compensation for it (other than from Seeking Alpha). I have no business relationship with any company whose stock is mentioned in this article.
Seeking Alpha’s Disclosure: Past performance is no guarantee of future results. No recommendation or advice is being given as to whether any investment is suitable for a particular investor. Any views or opinions expressed above may not reflect those of Seeking Alpha as a whole. Seeking Alpha is not a licensed securities dealer, broker or US investment adviser or investment bank. Our analysts are third party authors that include both professional investors and individual investors who may not be licensed or certified by any institute or regulatory body.
