Summary:
- We are bullish on the energy sector as a whole. Lyn Alden provides her commentary and latest updates.
- Suncor and Occidental are two tickers that have caught our attention and have the potential to outperform.
- What are the specific price levels identified as support and targets overhead?
PPAMPicture/E+ via Getty Images
By Levi at Elliott Wave Trader; Produced with Avi Gilburt
Certainly not a knock on the Oracle of Omaha. But, read down just a bit as we delve into the energy complex so that you better understand the premise of this piece. We will discuss how to spread out our risk while still keeping positions in high-quality picks in this sector. Suncor (NYSE:SU) and Occidental (OXY) are but two of the tickers that we will be updating in the days to come.
As you will see in the next section below, Lyn Alden extensively covers the energy sector for us and provides keen insights into not only the macro picture but also the individual names that can perhaps rise higher than the more mediocre charts out there. Let’s listen in to her latest commentary.
The Current Fundamental Snapshot Of The Energy Sector With Lyn Alden
“I’m bullish the whole energy complex and don’t have a firm view on the relative performance of different names. I like holding a bunch of different ones to spread out operational risk, jurisdictional risk, and to get exposure to different types/sources of oil. For me it’s more of a macro play than a company-specific play.
Adding some drillers and pipelines can also spread out risk. For cashflow positive energy companies with reasonable balance sheets, I view them as positive carry plays on future high oil prices. At current oil prices, they return significant cashflow to shareholders via debt reduction, they pay dividends, and they buy back shares. That status quo alone is pretty decent. But then should we get higher oil prices sometime this decade, they can gain disproportionally from that and help protect the rest of a portfolio that generally does better amid low energy/commodity prices.
For investors with the time to dig deeper into individual names, I think long-life reserves are a key metric to prioritize and are worth paying up for. The bullish case for energy is a long one, not a cyclical one, and companies with strong balance sheets and long-lived reserves give ample space to let the thesis play out.” – Lyn Alden
Here’s One Specific Name That We Favor
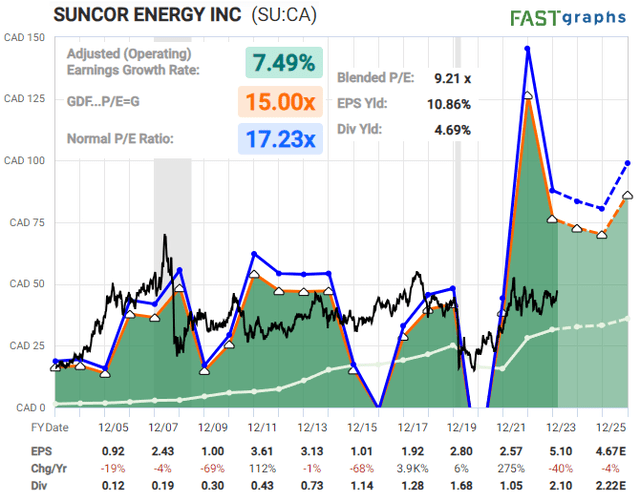
Let’s take a look at Suncor via its valuation, but also how the structure of price on the chart is pointing to potential outperformance in the sector.
chart by Lyn Alden – FastGraphs
We have reasonable valuation for (SU) and a chart that suggests a long consolidation has finally completed. The next leg higher could be upon us.
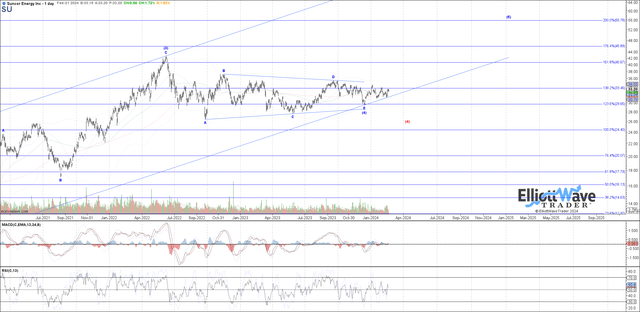
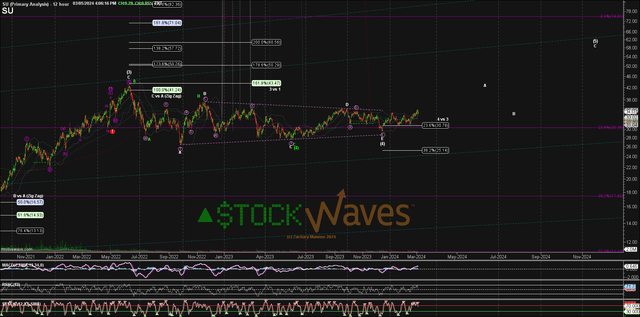
chart by Garrett Patten – StockWaves – Elliott Wave Trader chart by Zac Mannes – StockWaves – Elliott Wave Trader

Both of our lead analysts share the same view provided by this current structure on the chart. Once price breaks back above the $35.50 level, it will be further confirmation of the primary count shown. Ultimately, the overhead target is possibly as high as the $55 region. As always, we will closely monitor this as it progresses and more data is filled in.
In the alternative, should price break under $31 in the near term, it may be a warning that this rally is not quite yet ready to run.
A Quick Look At The OXY Chart
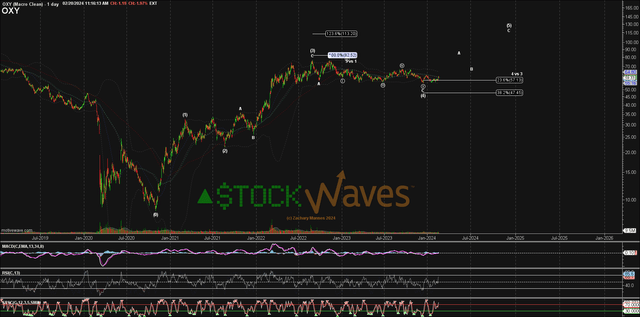
chart by Zac Mannes – StockWaves – Elliott Wave Trader
Zac Mannes shares with us this chart showing a similar picture for OXY as is painted by SU. Well, a logical question follows – can’t we have both? Of course. In fact, this would go along with Lyn’s view stated above:
“I like holding a bunch of different (names) to spread out operational risk, jurisdictional risk, and to get exposure to different types/sources of oil.” – Lyn Alden
The OXY chart price levels rhyme with the same structure as SU and some of the other energy names we are also diligently tracking. In this case, current near term resistance is in the $62 – $63 region, with support at the last low of $55.
Just One With More To Follow
This is some brief coverage of SU and OXY. We have two more names to discuss next week as well and will share those articles with the readership shortly. It is our view that the energy sector as a whole is on the cusp of another move higher. Our earnest endeavor is to provide coverage on which individual names can perhaps outdo the herd.
Do You Have A System In Place?
Those who have experience forged by time in the markets will tell you that it’s imperative to have a system of sorts in place. You need to be able to define how much you are willing to risk vs. how much gain is likely. Those who survive across the decades in the greatest game on earth will also inform you that the preservation of capital is paramount.
While there are multiple manners of doing this, we have found Fibonacci Pinball to be a tool of immense utility for traders and investors alike. For much more information on how this system can work for you, please begin with part one of a six part series of articles from Avi Gilburt, “This Analysis Will Change The Way You Invest Forever”.
I might also suggest giving this methodology a fair shake. Why? If you have heard of Elliott Wave Theory, what was the source? Surely you would want to consult someone that has performed an in-depth study of the how’s and why’s of the method. As well, this comprehensive investigation would be backed up with published studies on the matter and a body of work that shows the utility of said methodology in real-time.
Conclusion
There are many ways to analyze and track stocks and the market they form. Some are more consistent than others. For us, this method has proved the most reliable and keeps us on the right side of the trade much more often than not. Nothing is perfect in this world, but for those looking to open their eyes to a new universe of trading and investing, why not consider studying this further? It may just be one of the most illuminating projects you undertake.
(Housekeeping Matters)
If you would like notifications as to when our new articles are published, please hit the button at the bottom of the page to “Follow” us.
Analyst’s Disclosure: I/we have no stock, option or similar derivative position in any of the companies mentioned, but may initiate a beneficial Long position through a purchase of the stock, or the purchase of call options or similar derivatives in OXY over the next 72 hours. I wrote this article myself, and it expresses my own opinions. I am not receiving compensation for it. I have no business relationship with any company whose stock is mentioned in this article.
Seeking Alpha’s Disclosure: Past performance is no guarantee of future results. No recommendation or advice is being given as to whether any investment is suitable for a particular investor. Any views or opinions expressed above may not reflect those of Seeking Alpha as a whole. Seeking Alpha is not a licensed securities dealer, broker or US investment adviser or investment bank. Our analysts are third party authors that include both professional investors and individual investors who may not be licensed or certified by any institute or regulatory body.
STOCK WAVES: Where fundamental analysis meets technical analysis for highest-probability investment opportunities! Get leading Elliott Wave analysis from our team, along with fundamental insights and macro analysis from top author Lyn Alden Schwartzer.
“Stockwaves is my bread and butter, and that’s only catching maybe 10% of the charts they throw out! I had 7-10x+ trades with SW last year, and dozens more that were “slackers” (LOL) with “only” 3-4-5x returns. Amazing!” (Nicole)
Click here for a FREE TRIAL.
