Summary:
- Suncor Energy shares have risen 28% in the past year, driven by strong capital returns and low-cost oil sands operations, as well as efficiency gains.
- Suncor reported solid Q2 earnings, beating expectations and benefiting from increased commodity prices and strong cost controls.
- Suncor’s integrated business model, strong balance sheet, and increased buybacks make it an attractive investment with potential for share price growth.
dan_prat
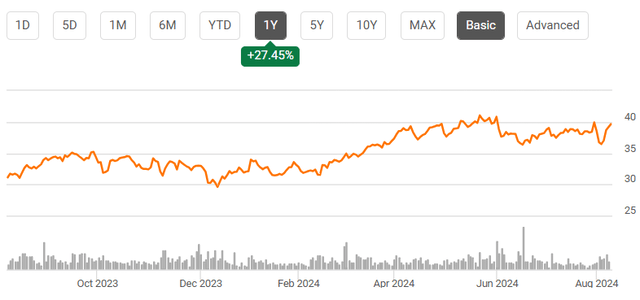
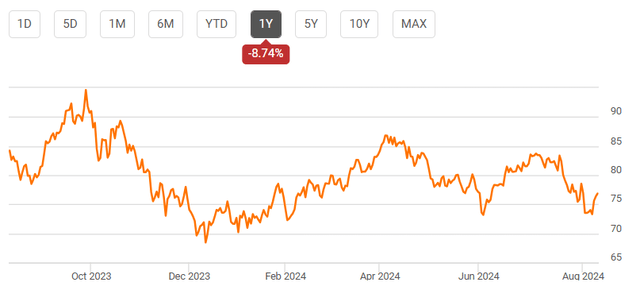
Shares of Suncor Energy (NYSE:SU) have been a strong performer over the past year, rising 28%, aided by strong capital returns and its low-cost oil sands operations. After reporting a solid Q2, SU has moved back toward its 52-week high. I last covered Suncor in January, rating shares a “buy,” given the strengths of its integrated business model. Since then, the stock has rallied 24%, significantly outpacing the market’s 13% gain. Indeed, shares have even eclipsed my $38 price target, making now a good time to revisit Suncor. I remain bullish.
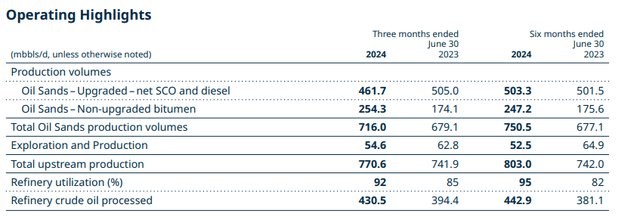
In the company’s second quarter, Suncor earned $1.27, beating consensus of $1.10. (Please note, as a default, information is shown in Canadian dollars, consistent with Suncor’s reporting. Any time a figure is in USD, it will be noted as such). Suncor has benefitted from increased commodity prices, as WTI averaged $80.55 from $73.75 last year. Over a full year, each $1 USD of oil impacts cash flow by $200 million. However, Suncor also continues to improve operating efficiency with both rising production and improved refinery throughput, as you can see below.
Looking first at its upstream results, Suncor is primarily an oil sands producer, which is actually more similar to mining than fracking. I say this because frackers have very low cash operating costs (often below $10/barrel), but production falls very quickly after a well is completed, sometimes by 40%. As a consequence, there is a need to spend significant sums on cap-ex to maintain production. Oil sands are almost the opposite—there is an extremely low decline rate, meaning little cap-ex is needed, but cash operating costs can run over $30/barrel.
Each model has unique benefits and drawbacks. Frackers can be very responsive to changes in oil prices; on a spike, they can drill more and quickly ramp production, or vice versa. However, when they pull back on cap-ex, production can begin to decline quickly, reducing cash flow when oil recovers. By comparison, oil sands producers cannot easily move production quickly to adapt to commodity price environments. However, even during downturns when they pare back cap-ex, their production profile is unimpaired.
While oil sands producers may not be able to as quickly capitalize on price spikes, their limited cap-ex needs make them a very durable business in my view, which is why I have viewed Suncor favorably. Indeed, Suncor has just a 5% corporate decline rate. With operating costs in the mid-$30s and $10 of sustaining cap-ex needs, Suncor has a breakeven price of about $45, or roughly $35 USD, well below where oil is trading.
In total, Suncor had 771mbo/d of upstream production from 742mbo/d last year. Almost all of this comes from oil sands; its traditional E&P production was 55mbo/d from 62mbo/d last year, due to the divestiture of its UK business. Production was up 8% sequentially, though.
Looking to its core oil sands business, bitumen production rose 2.5% to 834mbo/d, thanks to its increased ownership of Fort Hills. Last year, it acquired the remaining 31% stake in Fort Hill that it did not own, increasing its owned production. Overall, oil sands pre-tax income of $1.75 billion rose from $1.3 billion last year, generating $1.7 billion of free cash flow from $1.5 billion last year.
With complete ownership of Fort Hill, Suncor is working through operational improvements to bring utilization above 90% from the mid-to-upper 80%s. Fort Hills cash costs declined to $30.60 from $31.40 while Syncrude cash costs of $40.15 fell from $42.60 last year, pointing to the benefits of these efficiency efforts.
One drawback to the oil sands business is that this heavy crude sells at a discount to WTI & Brent. Most of the production is land-locked, and that limited takeaway capacity adds to the discount. Suncor solves this problem by also being a refiner. Its refining unit enjoys wider margin thanks to lower input costs. It still realizes the entire value of the supply chain to end gasoline and diesel prices, whereas standalone oil sands producers lose some of the economics to refiners. With 40% of refining input coming from its facilities and 100% from inland crude, Suncor has consistently enjoyed wide EBITDA margins.
Suncor Energy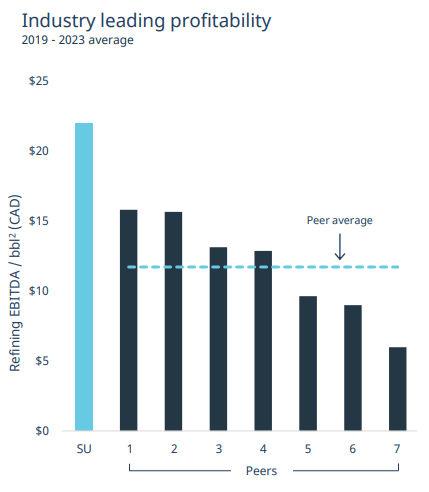
Refining and marketing earned $588 million from $494 million as output rose 9% to 431bo/d as utilization came in at 92% from 85% last year. Suncor does significant seasonal maintenance during Q2, which temporarily reduces refinery capacity. This turnaround activity was particularly pronounced last year, creating a favorable comp. Due to increased turnaround activity seasonally, refinery utilization was down from 98% in Q1.
Suncor’s 5-2-2-1 crack spread of $26.7 from $34.20 last year. Refining margins were extremely wide in 2022-2023 as Russia’s invasion of Ukraine distorted markets. With markets more normalized and slower demand for productions, crack spreads have normalized. However, as I have discussed, given structural refining supply constraints and some demand recovery, I believe crack spreads are likely near a bottom.
Even with tighter crack spreads, increased throughput supported profits, given significant fixed costs that can now be spreads across more barrels. As such, the unit generated $518 million of free cash flow from $404 million last year. Refining operating expenses fell by $1 to $6.95. Gross margins fell less than $1 on a first-in-first-out basis to $37.65; though they were down nearly $5 on a last-in-first-out basis, which is more indicative of the tighter spread environment.
Suncor delivered strong results with operating efficiencies continuing, and we continue to see the benefits of its integrated model. In aggregate, prices and margins were a $241 million tailwind to earnings after royalties. Impressively, operating expenses fell by $9 million to $2.67 billion. This drove the increase to $1.6 billion of operating earnings from $1.3 billion last year.
Management has held guidance flat. While Suncor is still guiding to 770-810mbod of production this year, results so far put the company on pace to exceed the top end of the range. I see production coming in at 800-820mbod, given the momentum we are seeing in oil sands. This has also increased my confidence Suncor can achieve its target of 100mbo/d production growth by 2026.
Suncor Energy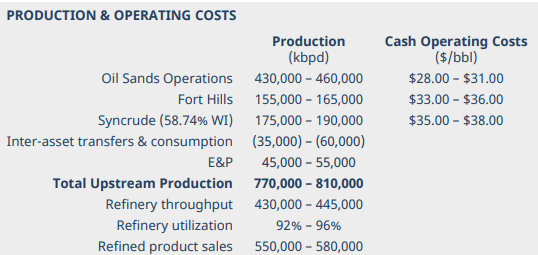
Given these results, the company generated $1.35 billion of free cash flow from $1.04 billion last year. Through six months, it has spent $3.2 billion on cap-ex, and $3.2 billion in free cash flow. That leaves it on track to hit its target of $6.4 billion of cap-ex, with just over $2.9 billion going to growth projects.
Suncor also has passed a critical benchmark on its balance sheet that will result in greater capital returns. Suncor now has $9.05 billion of net debt, down $500 million sequentially. As you can see below, this debt is well-laddered. Suncor has just 0.6x net debt to funds from operations and net debt to capital of just 17%. This gives the company an excellent balance sheet.
Suncor Energy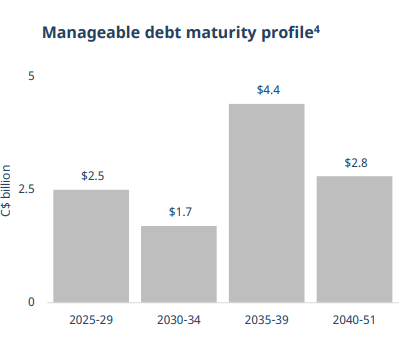
Suncor has tied the allocation of excess capital to its debt load. With net debt dropping to $9 billion, it has now increased its buybacks to 75% of cash flow after the dividend from 50%. This is about 3 months ahead of my expectations, thanks to strong H1 results. Once it hits $8 billion, all excess cash flow will go to buybacks. In Q2, it did $825 million of share repurchases for $1.5 billion of capital returns.
These buybacks have led to nearly 3% share count reduction, and that pace should increase with buybacks now being a higher piece of its capital allocation. It also offers a secure dividend yield of 4%. In January, I was targeting about $5.7 billion in free cash flow, which translated to $4.3 billion USD in January. This drove my $38 target based on an 8-9% free cash flow yield.
Now as you can see, oil prices were higher in H1 than they are currently. As such, I expect some slowing in cash flow in H2 vs H1. Oil prices remain the primary risk to the outlook. My view continues to be oil will trade in the $70-85 range, given OPEC supply constraints and modest economic growth. If there were a recession, oil prices could fall further. On the other hand, geopolitical risks in the Middle East could cause supply outages and boost prices. I view the risk as balanced.
Suncor now has about $6 billion in free cash flow capacity in my view, or about $4.5 billion in USD terms. Its dividend costs about $2.8 billion, and so it can return another $2.4 billion via buybacks (75% of $3.2 billion). That means in about 15 months, it will have paid $1 billion in debt down, bringing debt below $8 billion and allowing it to enter a 100% buyback regime.
SU has about $3.50 USD in free cash flow. That gives shares an 8.75% free cash flow yield. I view that as attractive, given its integrated model, ramping buybacks and stellar balance sheet. Additionally, with modest production growth, free cash flow should rise ~2-3%/year, holding commodity prices flat. SU should trade down to an 8% free cash flow, if not toward 7%, as a result. With a modest share count reduction, that can push shares to $44-45 over the next year, or about 15% with its dividend. As such, I remain a buyer of Suncor.
Analyst’s Disclosure: I/we have no stock, option or similar derivative position in any of the companies mentioned, and no plans to initiate any such positions within the next 72 hours. I wrote this article myself, and it expresses my own opinions. I am not receiving compensation for it (other than from Seeking Alpha). I have no business relationship with any company whose stock is mentioned in this article.
Seeking Alpha’s Disclosure: Past performance is no guarantee of future results. No recommendation or advice is being given as to whether any investment is suitable for a particular investor. Any views or opinions expressed above may not reflect those of Seeking Alpha as a whole. Seeking Alpha is not a licensed securities dealer, broker or US investment adviser or investment bank. Our analysts are third party authors that include both professional investors and individual investors who may not be licensed or certified by any institute or regulatory body.
