Summary:
- Suncor Energy’s cost-cutting plan aims to lower breakeven costs by US$10, driven by operational efficiencies and strategic investments.
- Suncor is projecting a 24% compound annual growth rate in free cash flow per share from 2024 to 2026, driven by operational improvements and cost savings.
- The second quarter of 2024 showcased strong operational execution, with record upstream production and impressive turnaround efficiency.
- With Suncor’s enhanced operational efficiency and planned debt reduction, the stock is poised for significant appreciation, potentially reaching C$80(US$60) per share in three years.
Iryna Tolmachova/iStock Editorial via Getty Images
In my previous analysis of Suncor Energy (NYSE:SU) (TSX:SU:CA), I focused on the company’s transformation under the new management and the significant potential I saw in the stock. At that time, I was arguing that the market had not given credit to Suncor for its ambitious turnaround story, and my PV12.5 valuation suggested a ~30% upside. Since then, the oil prices are down from ~US$80 to ~US$75 WTI, while the shares of Suncor are trading higher. The turnaround story so far has been unveiled very positively, with great quarterly updates and bullish news from management addressing further improvements in efficiencies, higher production growth, and strict budgeting.
In this update, I will focus on the recent developments in Suncor’s cost-cutting plan, review the impressive Q2 results, and provide an updated valuation with sensitivity analysis.
Cost Savings Plan
Suncor’s new management, led by CEO Rich Kruger, has been laser-focused on operation and cost efficiency, which is critical for long-term success. In my previous analysis, I anticipated cost reductions of C$5 per barrel.
Target breakeven (Suncor Investors Presentation)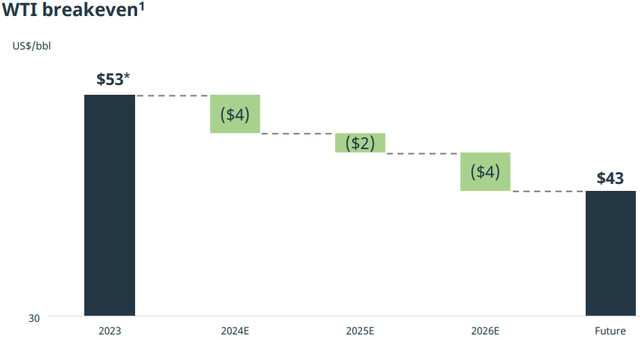
When Suncor’s management presented a goal to lower breakeven by US$10 during their May presentation, my jaw literally dropped. I initially questioned the feasibility of aggressive cost cuts, given the need to improve the safety standards and reputation of the company in this matter. However, after digging deeper, it became clear that these savings come from a combination of higher production scale, strategic upfront Capex investments, and a series of optimizations across the board with no risks of potential safety hazards.
Additionally, the company is finalizing its deleveraging. It will soon hit its debt target of C$8B, which will lower its interest payments, and with an ongoing share-buyback program, there will be fewer shares, reducing its dividend expenses.
Cost-cuts contributions (Suncor’s presentation)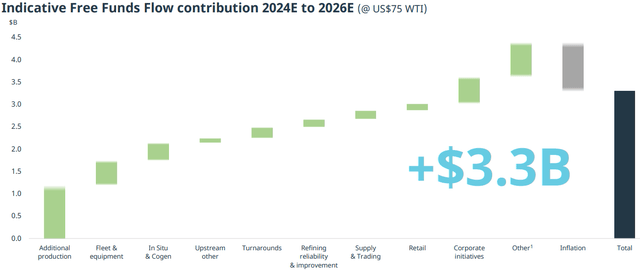
The graph above illustrates the various initiatives across the company departments that are expected to drive the Free Funds Flow by ~C$3.3B from 2024 to 2026 (assuming US$75 WTI). These initiatives include:
- Additional Production: Increase in production throughput by 100k bbls/d, increase efficiency in core oil sands operations.
- Fleet & Equipment: Beyond autonomous trucks, Suncor is investing in more efficient equipment, which reduces operational costs and increases reliability.
- In Situ & Cogeneration: Enhancements in in-situ operations and cogeneration projects that improve energy efficiency and reduce operating costs.
- Turnarounds: Suncor is streamlining its turnaround processes, as highlighted by Shelley Powell, who mentioned, “This is a new approach to what we call risk-based inspection. It has allowed us to take a fair amount of work out of the turnaround without adding any additional risk.”
- Refining Reliability & Improvement: Upgrades to refining processes that enhance efficiency and reduce downtime, contributing to higher margins.
- Supply & Trading: Optimization in supply chain management and trading strategies that capture value from market opportunities.
- Retail: Improvements in retail operations, driving higher margins and customer satisfaction.
- Corporate Initiatives: Company-wide initiatives aimed at reducing overhead and administrative costs.
- Other & Inflation: Mitigating the impact of inflation through efficiency gains in various areas.
These initiatives are not only about slashing costs but about creating a more agile organization that can quickly react to changes in market conditions and deliver outstanding returns for its shareholders.
We can already see the improvements in Q2 results.
Operations
Suncor’s Q2 results solidify the company’s turnaround story and position it among the leaders in oil sands operators. Suncor reported strong production of 771k bbls/d and refinery throughput of 431k bbls/d, reflecting the strong momentum that Suncor has been building throughout the year.
Rich Kruger summarized the quarter’s achievements during the earnings call: “The second quarter was about execution and momentum. High-quality execution of major upstream and downstream turnaround activities and maintaining momentum in targeted improvement priorities, including operational reliability and cost management.”
The refining utilization hit an impressive 92% in Q2 despite planned turnarounds at its Sarnia and Montreal refineries. Downstream operations achieved record refined product sales of 595k bbls/d, surpassing the previous record set in 1Q24, further solidifying shareholders’ trust in the turnaround story.
Financials
Financially, Suncor generated C$3.4B in AFFO and C$1.4B in FCF and returned over C$1.5B to shareholders through share repurchases and dividends, reflecting the commitment to shareholder returns. As Kris Smith, Suncor’s CFO, noted, “Our laser focus on costs continued with total operating selling and general expenses of $3.2 billion in the quarter, which is down over $250 million from Q1.” This consistent focus on cost management, coupled with strong operational performance, positions Suncor well for a robust second half of 2024.
The Impact on the Valuation
During the May presentation, management provided detailed guidance as to what production, cash flow, and Capex we can expect over the next three years. I built a simple model based on this guidance. (Note.: 2023 numbers are not actual but normalized).
24% FCF CAGR (Suncor’s Presentation)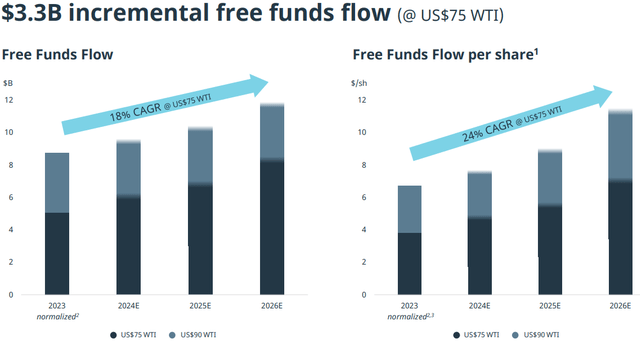
Due to the combination of cost-savings, reduction in share count, and increase in production output, Suncor expects to achieve a 3-year CAGR of 24% in free cash flow per share from 2023 normalized numbers, assuming US$75 WTI.
Author’s model (Based on Suncor’s guidance)
The company is expected to achieve its debt target in the first half of next year. (It might be even this year if WTI averages over US$75.) Everything above the base 4% dividend yield will be pointed towards the reduction of shares outstanding. So far, with the rate of change in Suncor, I see this projection as being conservative. During the Q2 call, Kruger emphasized, “We are exceeding our rate of expected improvement on the volume side of it… and we are quite pleased with the fundamental performance of the organization on those factors that we can control.
For my valuation, I am simply discounting the resulting dividends and buybacks. In the final year, I am discounting a “sustainable free cash flow”, which is planned FCF+Growth Capex, and pretending that the company switches to a 100% payout ratio with no spending for growth or any further cost efficiency improvements.
DCF with different discount rates (Author’s model)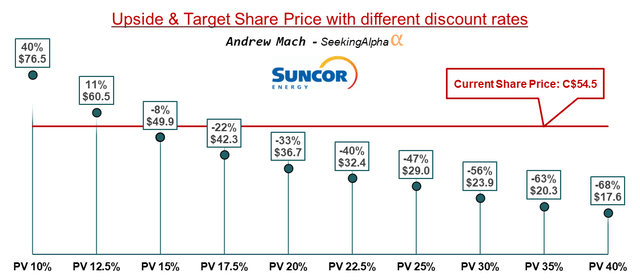
Discounting with different discount rates shows me that Suncor is currently priced for ~14% annual returns going forward if the WTI stays flat at US$75.
Impact of different oil prices
To understand the main risk, it’s essential to consider how a company’s profitability is impacted by oil price fluctuations. Given Suncor’s integrated business model that combines forth upstream production and downstream refining, the company is relatively resilient to the volatility in crude prices.
Each US$5 move in WTI prices moves the value of future free cash flows by ~15%, which is caused by low breakeven costs. In May’s presentation, Management stated that their current breakeven costs are ~C$53. After further observation, you can see that they calculate the breakeven cost with the base dividend included. This shows that management doesn’t consider dividends as something optional; they simply account for them as non-negotiable costs. Approx. C$10 from each barrel sold goes towards dividends. In my sensitivity analysis, I am defining breakeven as a point before the dividend payments. This is currently sitting at ~US$46 WTI, but due to the cost-cutting measures, it is expected to drop to ~US$36 WTI.
Sensitivity analysis (Author’s model)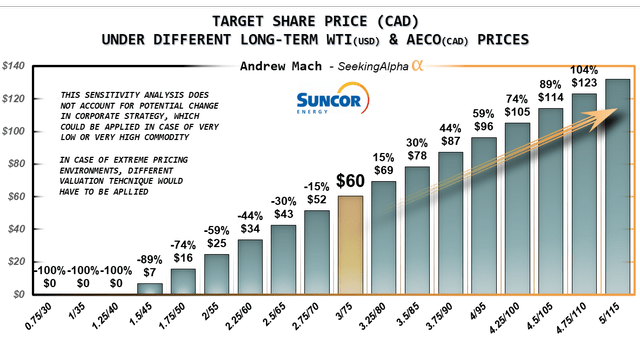
For comparison, we can look at the other side of the spectrum, where the FCF of Surge Energy (SGY:CA) moves by ~30% with a US$5 move. Investors like to call it as having a torque to the oil price. What it really means is low-margin, higher-risk play with higher potential if oil prices rise.
Final Thoughts
Based on the current trajectory, Suncor is well positioned to reach its goal of ~C$7 FCF per year by 2026. The stock could trade at 10-12x FCF, making it a C$70-84 (US$50-60) stock. As Suncor continues to execute its turnaround story, lowering its breakeven costs and improving its FCF, the market will likely follow and recognize the full value of these improvements, leading to a re-rating of the stock.
In conclusion, the turnaround has great momentum, and the focus on efficiency is driving substantial value creation. With solid Q2 performance and a clear path to further improvements, Suncor still remains a Strong Buy with significant upside potential over the coming years. In my opinion, investors who believe in the turnaround story should consider adding Suncor to their portfolio before the market fully prices in these positive developments.
Analyst’s Disclosure: I/we have a beneficial long position in the shares of SU either through stock ownership, options, or other derivatives. I wrote this article myself, and it expresses my own opinions. I am not receiving compensation for it (other than from Seeking Alpha). I have no business relationship with any company whose stock is mentioned in this article.
Seeking Alpha’s Disclosure: Past performance is no guarantee of future results. No recommendation or advice is being given as to whether any investment is suitable for a particular investor. Any views or opinions expressed above may not reflect those of Seeking Alpha as a whole. Seeking Alpha is not a licensed securities dealer, broker or US investment adviser or investment bank. Our analysts are third party authors that include both professional investors and individual investors who may not be licensed or certified by any institute or regulatory body.
