Summary:
- Super Micro Computer faces significant credibility issues, including short-seller reports and failure to release their last 10-K financial statement, posing delisting risks.
- The high accruals ratio and insufficient operational cash flows suggest unsustainable earnings and a weak business model.
- Increasing inventory, coupled with declining payables days, exposes SMCI to significant financial risks, especially if demand fluctuates.
- Competitive pressures and credibility issues are damaging SMCI’s growth prospects, making it difficult to compete with stronger players like Dell in the server market.
echoevg
Introduction
Super Micro Computer (NASDAQ:SMCI) has been one of the most volatile stocks on the market this year. It began the year as a key partner of NVIDIA (NVDA) in deploying new data center hardware and, at one point, delivered YTD returns of over 300% for investors. I recall hearing it described as “the next NVIDIA” more than once. Recently, however, the company has made headlines for less favorable reasons, including a short-seller report and delisting risk. From its peak, the stock experienced a dramatic drawdown of nearly 85% before rebounding to double its price from this year’s lows.
The stock currently faces delisting risks, as the company has failed to release their last 10-K financial statement, and its former auditor, Ernst & Young, recently resigned. Opinions on the stock are divided. Some consider a company that cannot publish its financial statements to be uninvestable, while others see opportunities for tactical trades. Meanwhile, optimists interpret the appointment of a new auditor as a promising step toward resolving the underlying issues.
In this article, I analyze their financial statements to highlight several red flags that, in my view, justify sell rating for the company. As a fundamental analyst, my primary focus is on assessing the company’s financial health and performance metrics, rather than predicting the stock’s next likely move.
The Accruals Ratio
To begin the analysis, I’d like to focus on the accruals ratio of earnings. As we know, accounting practices can significantly influence net income. For instance, adjustments to depreciation or early revenue recognition may artificially inflate earnings. The accruals ratio measures the portion of a company’s earnings that is not supported by cash flows. Accrual-based earnings derive from accounting practices and tend to reverse in subsequent periods. Therefore, a high accruals ratio suggests low earnings persistence within a company.
The CFA Institute proposes two main methods for calculating the accruals ratio:
1. Cash-Based Ratio: Calculated as the difference between net income and the sum of cash flow from operations (CFO) and cash flow from investing (CFI).
Ratio 1 – Cash based ratio (Equity Asset Valuation – 3rd Edition)
2. Balance-Sheet-Based Ratio: Calculated as the change in net operating assets (NOA) from period t-1 to period t.
Ratio 2 – Balance Sheet based (Equity Asset Valuation – 3rd Edition)
Where:
Equity Asset Valuation – 3rd Edition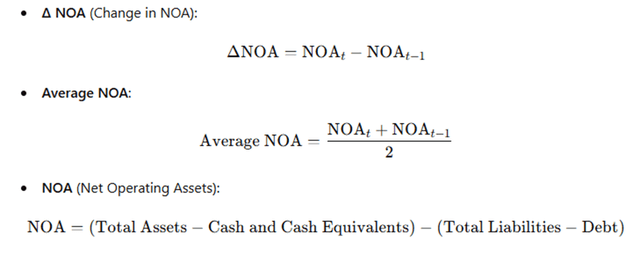
In this type of analysis, it’s preferable to compare the trend in accruals with those of the company’s peers. SMCI’s closest competitors in the server market are Hewlett Packard (HPE) and Dell (DELL). However, their diversified business models dilute the relevance of direct comparisons. To provide a more accurate comparison reflecting the growth driven by AI data center rollouts, I have also included Celestica (CLS) and Vertiv (VRT) in the analysis. Both companies are significantly involved in AI data center infrastructure and have experienced earnings growth as a result.
The evolution of SMCI’s financials is shown below, based on data consolidated by S&P – Capital IQ, with values expressed in millions of dollars. I will limit the analysis to the results presented in May, for the period ending in March, as it represents the most recent complete 10-Q published (even if 10-Qs are unaudited).
Financials SMCI (S&P Capital IQ – compiled by the author)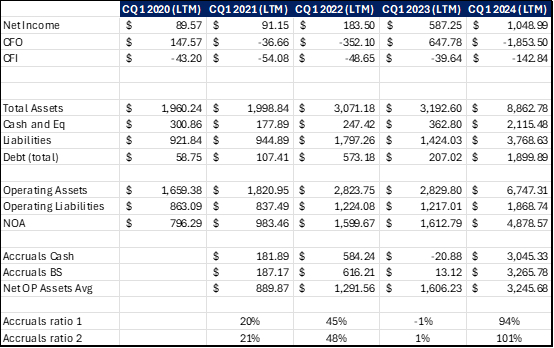
The data shows that, in the last period, net income was entirely consumed by working capital needs, including inventory funding and reduced accounts payable days. This indicates insufficient operational cash flows to sustain future growth.
A high accruals ratio often signals that earnings growth is unsustainable, as it is not supported by real cash flows. However, in this case, the conclusion is not obvious due to distortions caused by huge inventory investments. The volatility in these ratios, caused by inventory build-ups, raises concerns about their business model. It suggests a weak position in the supply chain, as they must pay upfront for product access and later sell it at a margin to recover costs.
I calculated the same ratios for the mentioned peers over the same periods, as follows:
Calculated Ratios (S&P Capital IQ – compiled and calculated by author)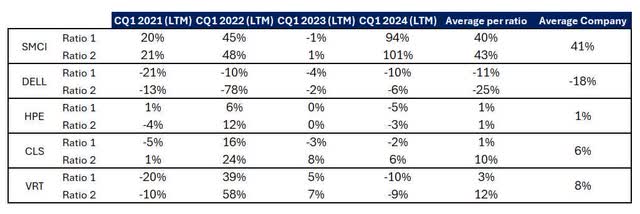
The average and volatility of the accruals ratios are notably higher for SMCI compared to its peers. For a company previously penalized for accounting violations, such as “prematurely recognizing revenue and understating expenses over a period of at least three years”, this raises serious concerns. At least, it can be concluded that their business model is the most fragile among the analyzed companies.
In contrast, Dell demonstrates superior efficiency with a negative cash conversion cycle, highlighting its strong operational management.
Balance Sheet Management
If we take a closer look at SMCI’s cash conversion cycle, we see that, despite significant increases in revenue, the time it takes SMCI to convert revenue into cash is increasing. Inventory trends have been mixed and volatile and, at the same time, average days of payables have been steadily declining.
S&P Capital IQ – Elaborated by the author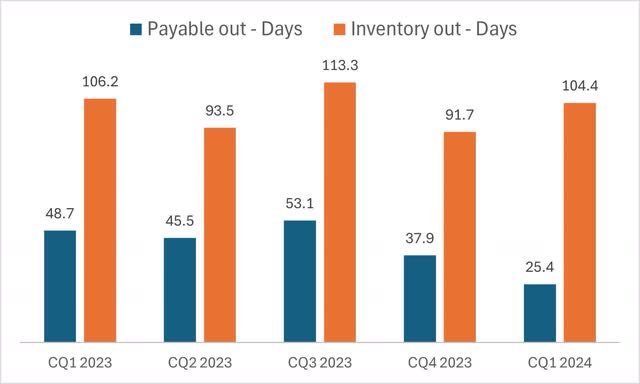
Decreasing average days of payables suggests that the company’s need to pay upfront has steadily increased, likely to secure access to NVIDIA (NVDA) products. These trends expose the company to significant risks if demand fluctuates or is overstated, potentially leading to excessive inventory on the balance sheet. This also points to weaknesses in their business model.
The company’s inventory surged from $1.54 billion in CQ1 2023 to $4.41 billion in CQ1 2024. Since operational cash flow was insufficient to support this investment, the company was forced to raise debt, driving its debt-to-equity ratio up from 13% in CQ4 2023 to 37.3% in CQ1 2024.
The vulnerabilities in the balance sheet are becoming increasingly critical, especially as recent developments have begun to undermine the company’s credibility.
Additional Risks
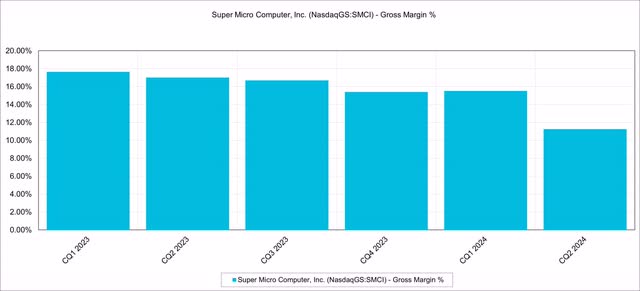
In addition to the previously mentioned risks, the Hindenburg short-seller report raised other risks worth considering. They are also being probed by the US DoJ after this report. Furthermore, the company’s gross margin appears to be under significant pressure. The server investment market has become increasingly commoditized, shifting the focus to total cost of ownership. This dynamic forces companies to balance operational efficiency with competitive financing options.
Dell’s strong operational capabilities allow it to provide financial solutions, which are especially beneficial for enterprises and Neocloud providers with restricted access to capital. In contrast, Super Micro’s substantial working capital growth has strained its balance sheet, limiting its ability to offer competitive financing to potential customers.
Even if Super Micro delivers a more efficient technical solution, deploying servers can still be more cost-effective with Dell, as financing costs for smaller companies can decrease from 13% to 9% (as per Semi Analysis report). To stay competitive in the total cost of ownership landscape, Super Micro may need to reduce its pricing premium, a trend that is already becoming apparent:
Besides, the credibility issues faced by SMCI are damaging not only to the stock but also to the company’s growth prospects. Customers may be inclined to switch suppliers, and NVIDIA, their most important partner, could reduce its reliance on them, further compounding these challenges.
First Quarter – Preliminary Information
On the 5th of November, SMCI reported a business update and conducted an earnings call conference, providing financial information for the quarter ended September 30, 2024, and guidance for the second quarter of fiscal year 2025 ending December 31, 2024. Since this is an interim, preliminary, and unaudited report, I have a hard time considering the validity of the presented figures.
For this earnings call, the company guided profits for the second quarter between $0.48 and $0.58, far below market estimates of $0.75, serving as further indication of earnings mean reversion. The revenue growth rate is also dropping, from 38% last quarter to 12% QoQ in this report.
Gross margins for the period were better than FQ42024, increasing from 11.3% to 13.3%. However, they were also guided down by 100 basis points for the next quarter, showing no evidence that the range of 15-17% can be achieved again.
Regarding cash generation, the company reported operating cash flow of approximately $407 million, derived from a net income of $433 million. However, inventory grew by $590 million compared to the last quarter. Assuming the usual depreciation rate of $10 million and $67 million for stock-based compensation (SBC), this leaves a nearly $500 million discrepancy in positive cash flows that would need to be explained by other accounting entries, such as accounts payable and receivables.
While generating cash would be a positive trend for the company, it’s hard to double-check the numbers since no detailed report was issued.
Conclusion
In this analysis, I will not be conducting a valuation as usual, given the credibility of their financial statements is under scrutiny.
The combination of the short-seller report, rising working capital demands, a weak business model, credibility risks, pressure on gross margins, and the failure to provide audited financial statements strongly supports my sell rating.
I will revisit the company’s rating and valuation if they are able to publish audited financial statements.
In the short term, price movements in stocks like this one can be highly volatile. Therefore, this Sell rating should not be interpreted as a recommendation to short the stock, but rather as advice to stay away from owning it.
Analyst’s Disclosure: I/we have no stock, option or similar derivative position in any of the companies mentioned, and no plans to initiate any such positions within the next 72 hours. I wrote this article myself, and it expresses my own opinions. I am not receiving compensation for it (other than from Seeking Alpha). I have no business relationship with any company whose stock is mentioned in this article.
Seeking Alpha’s Disclosure: Past performance is no guarantee of future results. No recommendation or advice is being given as to whether any investment is suitable for a particular investor. Any views or opinions expressed above may not reflect those of Seeking Alpha as a whole. Seeking Alpha is not a licensed securities dealer, broker or US investment adviser or investment bank. Our analysts are third party authors that include both professional investors and individual investors who may not be licensed or certified by any institute or regulatory body.


