Summary:
- Taiwan Semiconductor beat analyst expectations with strong Q1 figures, driven by global demand for advanced chips used in AI systems.
- Going forward, the company anticipates continued growth in demand for AI and server chips throughout 2024.
- TSM’s stock prices have broken through major resistance levels, indicating potential for further gains might be ahead.
shih-wei
Taiwan Semiconductor (NYSE:TSM) is breaking through major long-term resistance levels after the central computing processor producer released first-quarter earnings figures that beat analyst expectations on both the top-line and bottom-line. Strong global demand for the advanced chips used in artificial intelligence systems helped the company generate annualized growth rates of 16.5% in net revenues ($18.87 billion) and 8.9% annualized growth in net income ($6.95 billion). In both cases, this performance strongly surpassed consensus estimates ($17.97 billion in net revenue and $6.58 billion in net income for the period) and these figures also surpassed prior guidance releases, indicating that quarterly revenues would likely fall within an $18 billion to $18.8 billion range.
1Q24 Earnings (Taiwan Semiconductor)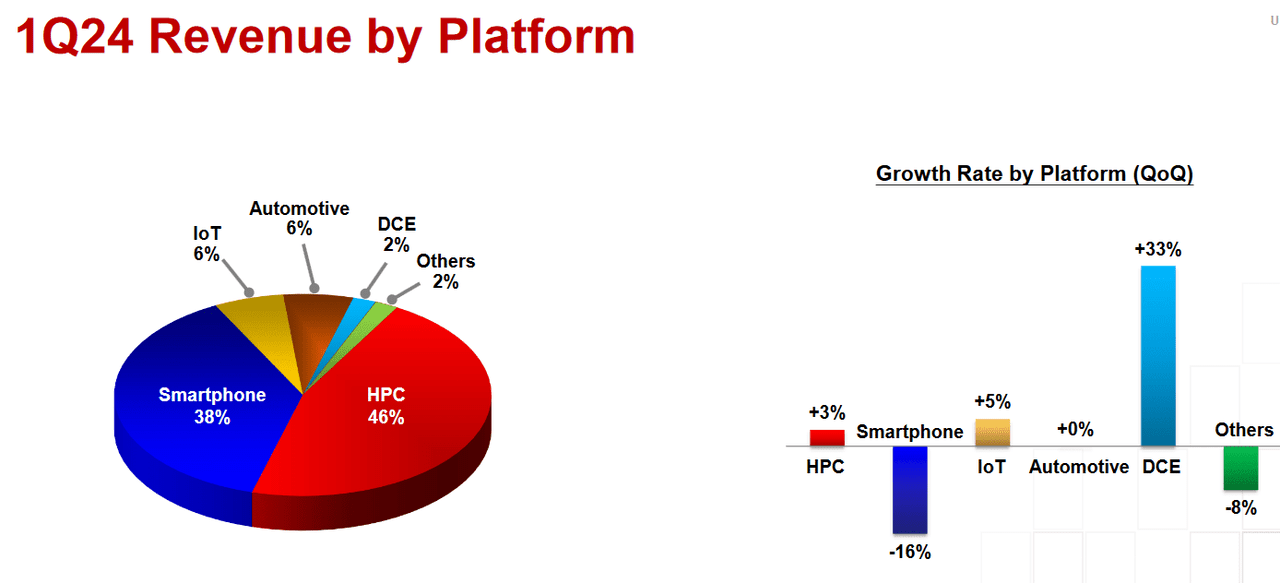
In the current quarter, Taiwan Semiconductor anticipates continued strength in global demand for 5-nanometer and 3-nanometer chips with continued growth throughout 2024 driven in large part by the company’s extensive customer base, which includes key names like Apple (AAPL) and Nvidia (NVDA).
1Q24 Earnings (Taiwan Semiconductor)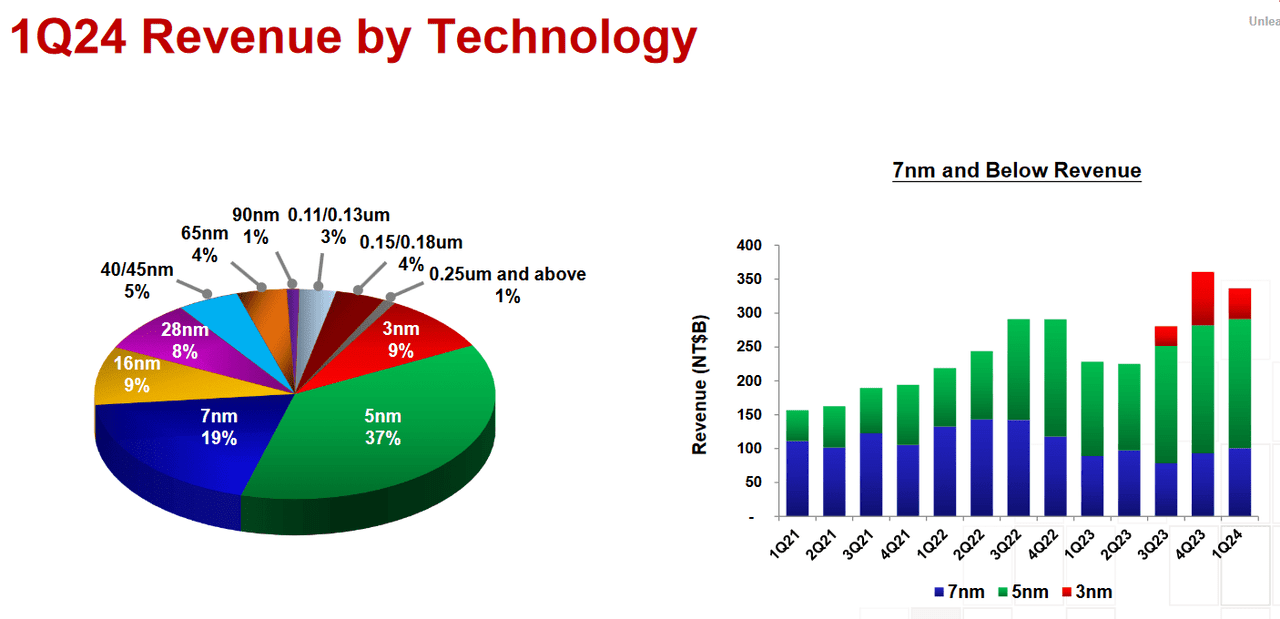
Overall, Taiwan Semiconductor expects to see better than double revenue growth from its artificial intelligence server chip offerings during the full-year period as widespread needs for energy-efficient processing power continue to surge through the tech industry. For the second-quarter period, the company estimates revenue figures that fall within a range of $19.6 billion to $20.4 billion.
1Q24 Earnings (Taiwan Semiconductor)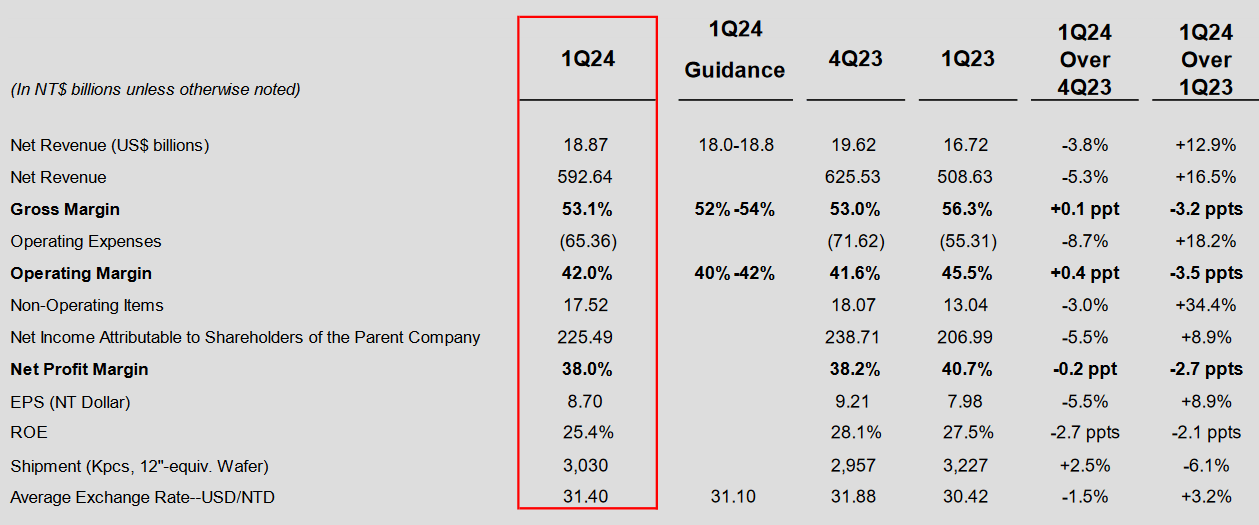
Given both the strength of these figures and the relative stability of the company’s long-term outlook, it will become important for investors to identify potential price levels that can be used to establish new long positions (or to build upon existing long positions). In the price history shown below, we can see that TSM shares have recently gapped higher – and, in the process, the stock has breached major long-term resistance levels on the monthly charts.
Major Historical Levels Breaking (Income Generator via TradingView)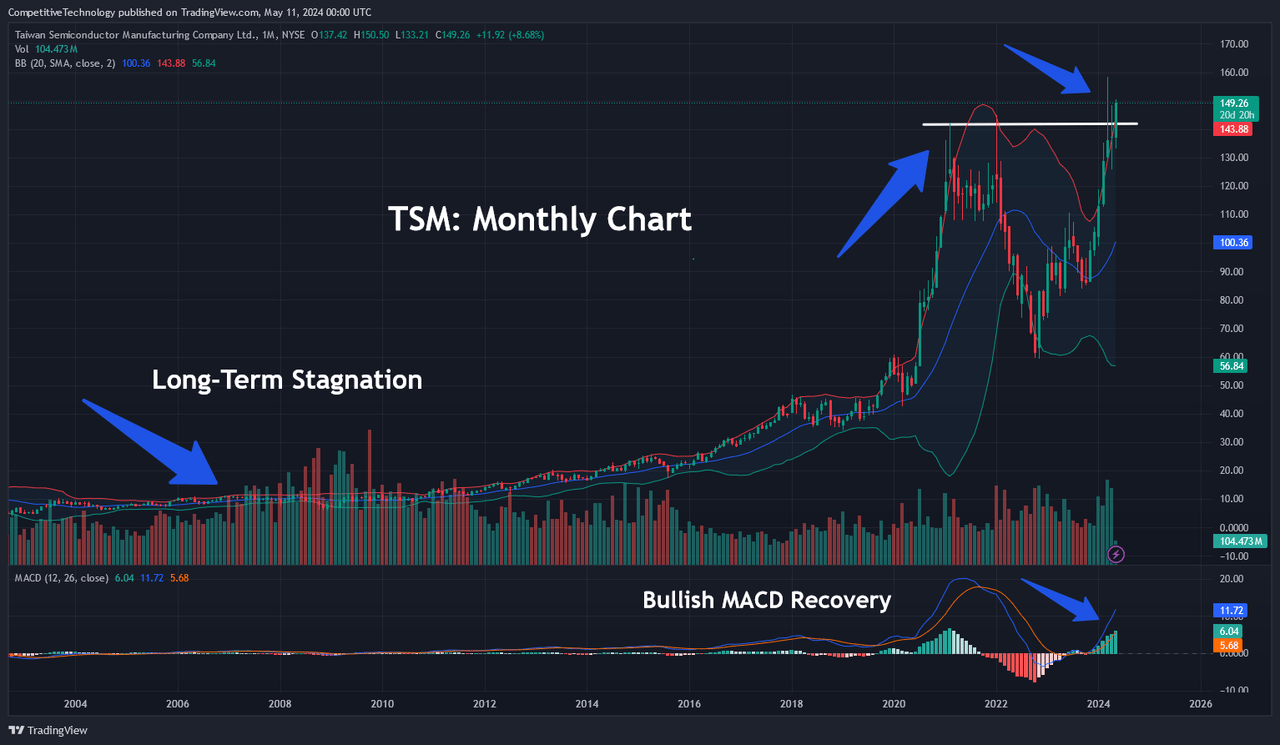
Following a long-term period of relative stagnation, TSM share prices have rocketed higher following the COVID-19 pandemic. However, we can also see that these extreme price moves have ultimately sustained themselves and should not be dismissed as event-driven due to the obvious changes in market dynamics which became present in the early 2020s. While the stock did experience a period of decline for almost the entire year in 2022, all of those losses have now been recovered and monthly readings in the Moving Average Convergence Divergence (MACD) remain bullish and imply further gains could be in store for this stock.
TSM: Monthly Chart (Income Generator via TradingView)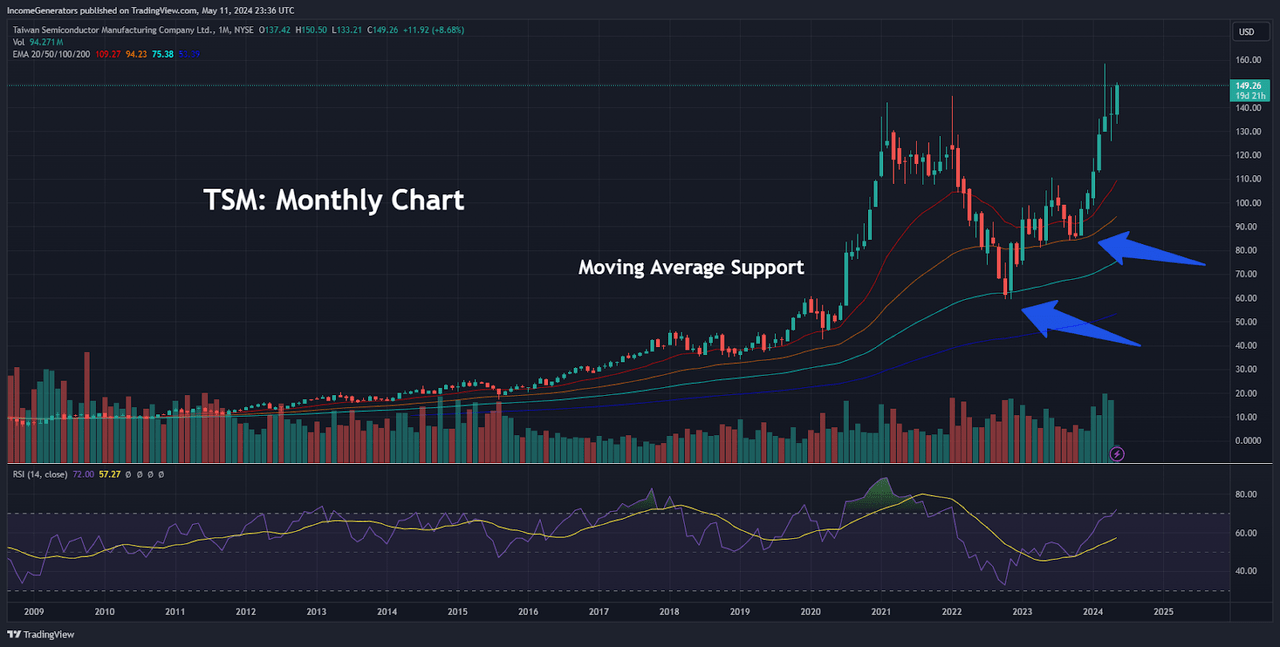
Supporting this bullish outlook is the fact that shares of TSM have managed to find support at well-defined price intervals. Specifically, the stock was able to halt its massive 2022 declines after finding strong support at the 100-month exponential moving average, and similar events occurred in 2023 when TSM saw an increase in buying activity upon share price declines to the 50-week exponential moving average. Furthermore, monthly indicator readings in the Relative Strength Index (RSI) are not heavily overbought (despite the strong pike higher in share prices) and this suggests that TSM still has room to run higher before becoming over-extended.
TSM: Weekly Chart (Income Generator via TradingView)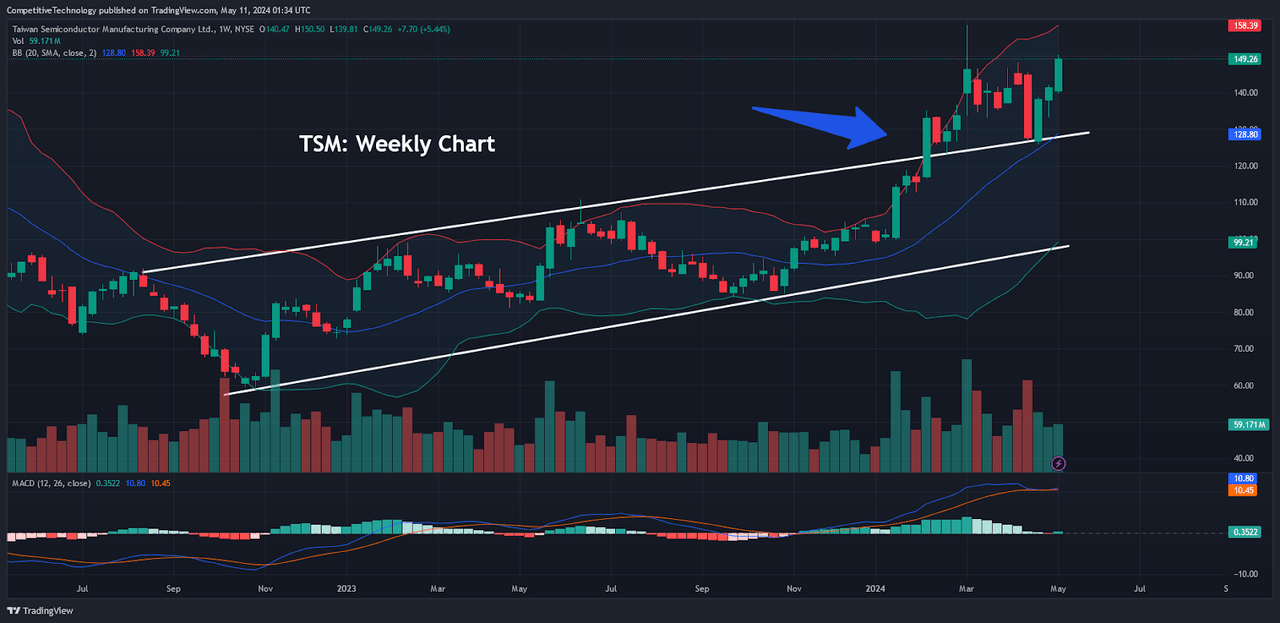
On the weekly charts, we can see additional reasons to side with a continued bullish outlook. Specifically, share prices have already broken above the uptrend price channel that began to form toward the end of 2022. Since this channel breakout has been tested to the topside, the latest upward price movement can be viewed with a higher level of validity – and the bullish momentum which currently characterizes share price action can be confirmed with positive readings in the weekly MACD readings for the period.
TSM: Weekly Chart (Income Generator via TradingView)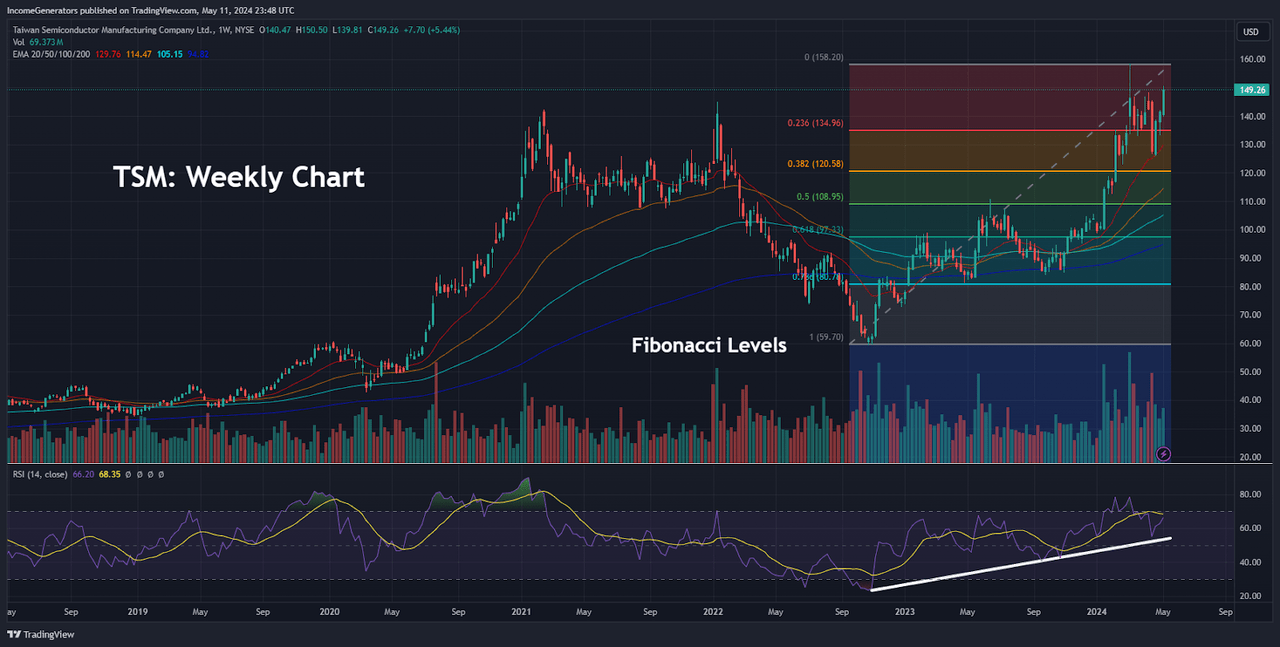
When we see strongly surging bull moves like the price structures that have been recorded with TSM, it can become quite difficult to identify potential downside targets that can be used to establish new buy entries in the event that share prices do start moving lower. To accomplish this, we will generally look toward Fibonacci retracement analysis as a means for identifying potential price targets to the downside. If we begin with the dominant trending move, we must start with the October 2022 lows of $59.43 and extend toward the March 2024 price highs.
Here, we can see that share prices have already broken through the 23.6% Fibonacci retracement (located just below $135) before ultimately finding support at the 20-week exponential moving average. Of course, this downside break does open the door to further corrective declines to the downside, and the next level of support using this analysis can be found at the 38.2% Fibonacci retracement near $120.60. If share values in TSM were to lose support near the $120 handle, the next likely level to the downside comes in at the 50% retracement just below $109 falls (which also falls within close proximity to the June 2023 resistance highs). Finally, a downside break of all of these levels would ultimately target the 61.8% Fibonacci retracement level, which is located just above $97.30 and falls in relatively close alignment with the January 2024 lows of $98.80.
On balance, we believe that Taiwan Semiconductor provides an excellent example of strong earnings performances, a sustainably positive corporate outlook (based on continued demand for advanced processors used in artificial intelligence systems), and a technical picture which supports the outlook for continued gains in share prices. While there are near-term risks for the company’s earnings outlook stemming from seasonal changes in smartphone demand, the widespread implementation of large language models (with programs like ChatGPT and similar offerings from a wide variety of Chinese technology companies) should continue to have a much broader effect on Taiwan Semiconductor’s earnings performances in the quarters ahead. Any time a stock has seen this type of bullish run higher, there is always a possibility for corrective downside moves and rounds of profit-taking from investors that are already long the stock. As a result, we have outlined several potential support zones that can be targeted as buy-entry levels in the event that these types of downside price moves come to fruition.
Global Foundry Revenues (CounterPoint Research)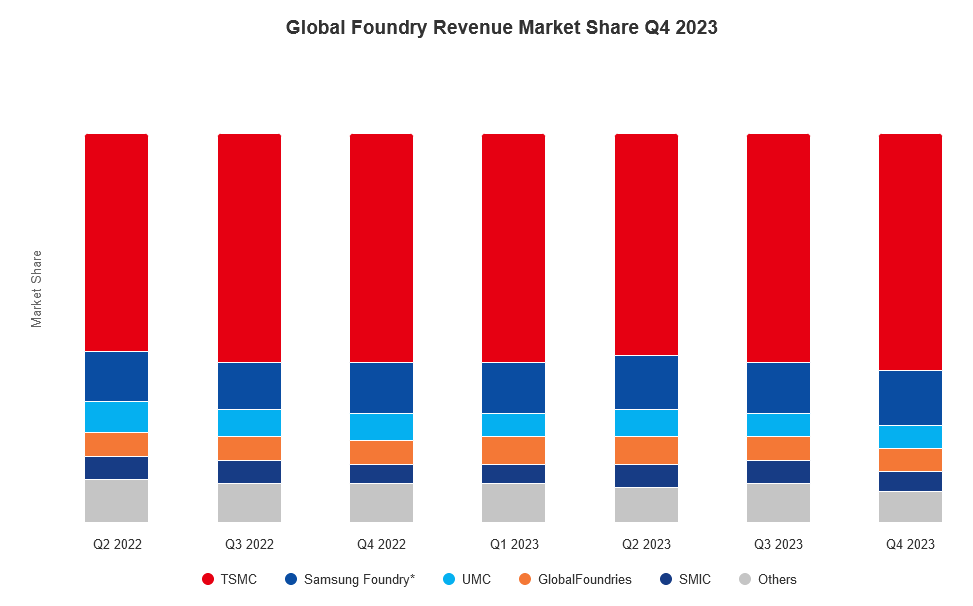
As the largest advanced central processor producer in the world, it remains clear that Taiwan Semiconductor’s competitors still have a large amount of ground that will need to be made up before reaching similar levels. During the fourth-quarter 2023, Taiwan Semiconductor recorded an incredible 61% of the entire world’s revenues from processor foundry production. To gain an idea of how remarkable this figure truly is, we can point to the second-place producer in Samsung Foundry (which accounted for just 14% of global revenues). Moreover, Taiwan Semiconductor’s net profit margin currently stands at 40% (which is the largest in the history of the company). Throughout the industry as a whole, the average net profit margin is less than 15% – and this strong level of outperformance largely stems from Taiwan Semiconductor’s chip offerings at 7nm and below (shown in the second chart image). These processors tend to allow for much higher profit margins, so Taiwan Semiconductor’s dominance in this segment of the market suggests that profitability expectations should remain quite attainable for the company going forward. Overall, we think that TSM provides an excellent example of long-term earnings growth and technical chart signals aligning in the same, strongly-bullish direction – and we believe that the stock remains attractive even as share prices are breaking through major historical resistance levels.
Analyst’s Disclosure: I/we have a beneficial long position in the shares of TSM either through stock ownership, options, or other derivatives. I wrote this article myself, and it expresses my own opinions. I am not receiving compensation for it (other than from Seeking Alpha). I have no business relationship with any company whose stock is mentioned in this article.
Seeking Alpha’s Disclosure: Past performance is no guarantee of future results. No recommendation or advice is being given as to whether any investment is suitable for a particular investor. Any views or opinions expressed above may not reflect those of Seeking Alpha as a whole. Seeking Alpha is not a licensed securities dealer, broker or US investment adviser or investment bank. Our analysts are third party authors that include both professional investors and individual investors who may not be licensed or certified by any institute or regulatory body.
